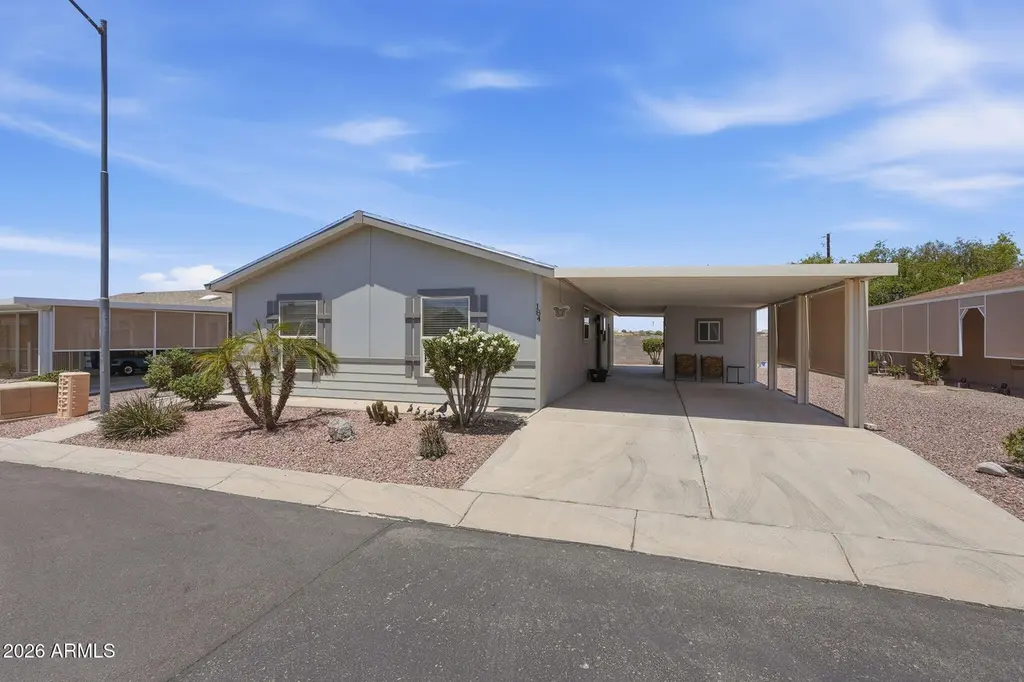
2263 N Trekell Rd #184 · Casa Grande, AZ
Flood risk 1/10 · Minimal
- FEMA flood zone
- X (shaded)
- Chance of flooding over 30 yrs
- 0.0%
- Est. flood insurance / yr
- $507 – $1,088
Fire risk 6/10 · Moderate
- Est. fire insurance / yr
- $610 – $1,132
Heat risk 9/10 · Severe
- Hot days now (above 113°F)
- 7 days/yr
- Hot days in 30 yrs
- 19 days/yr
Wind risk 1/10 · Minimal
- Chance of severe wind over 30 yrs
- —
Air-quality risk 1/10 · Minimal
- Unhealthy air days now
- 0 days/yr
- Unhealthy air days in 30 yrs
- 0 days/yr
Risk factors via First Street. Map © Google.
Why this score? — see what drove the C grade
The composite is a weighted blend of 9 inputs, each scored 0–100. Each bar is that input's sub-score; the figure is the points it added to the 100-point composite (weight × sub-score).
- Cash flow +23.1/30.0
- ARV discount +7.5/15.0
- DSCR +7.4/10.0
- 1% rule +6.0/10.0
- Condition / age +4.0/5.0
- Rent growth +3.7/5.0
- Livability +2.9/5.0
- Schools +1.5/10.0
- Appreciation +0.0/10.0
$139,000
🖨 Deal sheet (PDF) 📄 Offer letter ✓ Due diligence
Listing remarks
Highly improved and maintained 2012 home in Rancho Val Vista, a wonderful gated park with lovely 55+ amenities in Casa Grande, Fully furnished and move-in ready. Rancho Val Vista is just the right size - big enough for a heated pool, spa, pickleball, clubhouse activities and even a 2-lane bowling alley! This home has 2x6 construction, new roof with gutters and insulation, new Air Conditioner in 2022, lots of windows for natural light. The covered carport includes a shed to match the home. Mature landscape, automatic watering FURNISHED. Great price!
Key facts
- Pickleball
- Clubhouse activities
- Bowling alley
Tags
Property features AI
Finance
- Other: Lot size source: owner
- Financial info: Current financing non-assumable
- HOA & community: Land lease: $593 per month; No association fees included; Community pool; Community spa (heated); Pickleball courts; Biking/walking path
Exterior
- Parking: 2 covered parking spaces; 2 carport spaces
- Security: Gated community
- Utilities: Public sewer; Private water company
- Home design: Manufactured/mobile home; Leasehold ownership
- Construction: Metal siding; Wood frame construction; Composition roof
- Exterior features: Private street; Storage; Shed(s); Sprinklers in front and rear with auto timers; Gravel/stone front and back; Private maintained road; Mountain view
Interior
- Kitchen: Kitchen island; Laminate counters; Pantry; Refrigerator; Dishwasher; Disposal; Water purifier
- Bedrooms: 2 possible bedrooms
- Flooring: Carpet; Vinyl
- Bathrooms: 2 full bathrooms
- Heating & cooling: Electric heating; Central air; Ceiling fans
- Interior features: High-speed internet; Eat-in kitchen; Furnished (see remarks); Vaulted ceilings; Kitchen island; Pantry; Full bath in master bedroom; Laminate counters; Dual-pane windows
- Laundry & utility: Private water company service
Neighborhood map
What this means for you Summary
Snapshot
- This is a 2-bed/2.0-bath manufactured listed at $139k. Condition is rated good.
Deal economics
- At list price, monthly cash flow is $249 ($3k/yr) — positive.
- The deal already cash-flows at list — no discount required.
- Meets the 1% rule at list price ($2k rent vs $139k).
- Recommended offer: $135k (3.0% below list) — sets the bar for market timing.
- Cap rate 8.4% vs local median 4.1% in Casa Grande — top-decile yield for the area; either an underpriced asset or a hidden risk that comps aren't pricing in. Stress-test before assuming the spread holds.
Location & tenants
- Location reads 58/100 on livability (#220 in AZ) — a working-class tenant base; expect higher turnover. Strengths: cost of living A+, housing A+; Watch: crime D+, employment D+, schools F.
- Casa Grande Union High School District (4453) (suburban): math 14% / reading 21% proficiency, ranked #193 of 249 in AZ (top 78%) — low school quality limits family demand, transient renter base, plan for 1-2y turnover.
- Market conditions: Rents rising fast (+4.6%/yr); 633 active listings in the ZIP; 13 comparable units currently listed for rent nearby; rentals at typical pace (median 16d on market — plan ~3-4 weeks tenant-placement turnaround); 9,504 units permitted in Pinal County in 2024 (776 in 5+ unit buildings).
Forward outlook
- Local home prices are declining (-3.0%/yr); year-one equity from $961 of loan paydown is wiped out by about $4k of value loss. Plan a longer hold.
Negotiation context
- It's been on market 38 days — a 3% lower offer ($135k) is reasonable based on typical stale-listing flexibility.
Risks & watch-outs
- Climate carrying-cost: major wildfire risk; extreme-heat days projected 7→19/yr by 2055 (HVAC capex compounding) — expect insurance premiums to compound above CPI over the hold.
Questions for the listing agent
- It's been on market 38 days. Have you received any prior offers? Is the seller open to a 3% concession, seller financing, or rate buy-down credit?
- Is there a deadline driving the sale (1031 exchange, divorce, estate, relocation)? That informs how much negotiation room exists.
- Schools are F-rated, which usually means shorter tenancies and higher turnover. Who's the typical renter profile here, and what's been the actual vacancy rate?
- Crime grade is D in this area — have there been break-ins, vandalism, or insurance claims at this property in the last 3 years? What carrier currently insures it and at what premium?
- What's the average days-on-market for RENTAL listings here right now (not sales)? A rising rental-DOM trend means longer vacancies and softer asking-rent achievability than the comps imply.
- What's the recent tenant-quality profile in this submarket — average credit score on applications, eviction rate, late-payment / NSF rate, and stable-employment percentage? A property-management company in the area should have these aggregated.
- How much new for-sale + rental construction is in the pipeline within 1–3 miles? Heavy new supply typically softens prices + rents 12–24 months out; constrained supply supports both.
Investment metrics
- 1% rule
- 1.10% ✓
- Cap rate
- 8.45%
- Cash-on-cash
- 7.69%
- DSCR
- 1.34
- GRM
- 7.6
CMA / ARV
- ARV (on-the-fly)
- $51,744
- Comps found
- 12
Show comp detail 12 sales within ~0.75 mi
| Address | Dist | Beds/Ba | Sqft | Sold | Price | $/sf | Match |
|---|---|---|---|---|---|---|---|
| 2100 N Trekell Rd #20 | 0.32mi | 2/2.0 | 1,040 (-2%) | 0mo | $40,000 | $38 | 82 |
| 2140 N Cajeme Ave | 0.21mi | 2/2.0 | 1,105 (+5%) | 4mo | $53,900 | $49 | 79 |
| 2100 Trekell Rd #283 | 0.32mi | 2/2.0 | 1,056 (0%) | 8mo | $65,000 | $62 | 78 |
| 2100 N Trekell Rd #59 | 0.32mi | 2/2.0 | 1,056 (0%) | 13mo | $74,000 | $70 | 74 |
| 2100 N Trekell Rd #363 | 0.32mi | 2/2.0 | 980 (-7%) | 3mo | $40,000 | $41 | 70 |
| 2100 N Trekell Rd #194 | 0.32mi | 2/2.0 | 1,000 (-5%) | 9mo | $39,000 | $39 | 69 |
| 2100 N Trekell Rd #265 | 0.32mi | 2/2.0 | 1,024 (-3%) | 14mo | $55,000 | $54 | 68 |
| 2100 N Trekell Rd #330 | 0.32mi | 2/2.0 | 980 (-7%) | 7mo | $16,500 | $17 | 67 |
| 2100 N Trekell Rd #204 | 0.32mi | 2/2.0 | 1,152 (+9%) | 4mo | $39,500 | $34 | 66 |
| 2100 N Trekell Rd #50 | 0.32mi | 2/2.0 | 980 (-7%) | 8mo | $35,500 | $36 | 66 |
| 2100 N Trekell Rd #280 | 0.32mi | 3/2.0 (+1) | 1,008 (-4%) | 15mo | $62,500 | $62 | 60 |
| 2263 N Trekell Rd #81 | 0.20mi | 2/2.0 | 1,200 (+14%) | 13mo | $150,000 | $125 | 57 |
Match score weights: distance 35% · size 25% · config 20% · recency 20%. Top-matched comps best support the ARV.
Projected returns pro-forma
-3.0% appreciation · 4.6% rent growth · sell at horizon
- IRR
- -2.8%
- Equity multiple
- 0.89×
- Total profit
- $-4,119
- Equity at exit
- $20,725
- IRR
- 8.6%
- Equity multiple
- 1.71×
- Total profit
- $27,571
- Equity at exit
- $12,018
Cash invested: $38,920 (down + closing). Projections, not guarantees.
Landlord ↔ Tenant lean methodology
- Overall (STATE)
- 87 Strongly Landlord-Friendly
- State Arizona
- 87 Strongly Landlord-Friendly · R+3
- County
- — inherits STATE
- City
- — inherits STATE
ZIP-level market 85122
- Home prices YoY
- -22.4%
- Rents YoY
- 4.6%
- Active inventory
- 633
- Price-to-rent
- 7.6×
Monthly cashflow live
- Estimated rent
- $1,532 high interval (Pro) →
- Mortgage (P&I)
- −$729
- Tax est. 1.5%
- −$174 /mo · $2,085/yr
- Insurance
- −$58
- HOA
- −$0
- Vacancy / Maint / Mgmt
- −$322
- Net cashflow
- $249
Break-even live
Sensitivity live
| Price | -10% $345 | -5% $297 | +0% $249 | +5% $201 | +10% $153 |
|---|---|---|---|---|---|
| Rent | -10% $128 | -5% $189 | +0% $249 | +5% $310 | +10% $370 |
| Rate | -1.0pp $319 | -0.5pp $285 | base $249 | +0.5pp $213 | +1.0pp $177 |
UW: 25.0% down · 7.5% · 30yr · 1.5% tax · 5.0% vac · 8.0% maint · 8.0% mgmt
Financing live
Cash to close
- Down payment
- $34,750
- Closing costs
- $4,170
- Reserves months
- —
- Total cash needed
- —
Loan-product check · same deal, 3 products live
Conventional
25% down · 7.5% · 30yr
- Down + closing
- —
- Monthly P&I
- —
- Monthly cashflow
- —
- DSCR
- —
- Eligible?
- —
Personal DTI + credit; lowest rate.
DSCR
20% down · 8.5% · 30yr
- Down + closing
- —
- Monthly P&I
- —
- Monthly cashflow
- —
- DSCR
- —
- Eligible?
- —
No personal income docs; deal must DSCR.
Hard money
10% down · 12.0% · 12mo
- Down + closing
- —
- Monthly P&I
- —
- Monthly cashflow
- —
- DSCR
- —
- Eligible?
- —
Short-term bridge; refi at stabilization.
Rent comps 13 comps
| Address | Beds | Baths | Sqft | Rent | $/sqft | DOM | Units | Dist |
|---|---|---|---|---|---|---|---|---|
| 1139 E Yucca St Casa Grande, AZ | 3.0 | 3.0 | 1300 | $1,800 | $1.38 | 25d | 1 | 0.31mi |
| 2060 N Trekell Rd Casa Grande, AZ | 2.0 | 1.0–2.0 | 670 | $1,300 | $1.94 | 25d | 4 | 0.48mi |
| 700 E Rodeo Rd Casa Grande, AZ | 2.0 | 1.0–2.0 | 828 | $1,436 | $1.73 | 4d | 25 | 0.58mi |
| 1936 N Trekell Rd Casa Grande, AZ | 1.0–4.0 | 1.0–2.0 | 1033 | $1,492 | $1.44 | 3d | 29 | 0.69mi |
| 1292 E Rodeo Rd Casa Grande, AZ | 3.0 | 2.0 | 1005 | $1,500 | $1.49 | 6d | 1 | 0.72mi |
| 1926 N Avenida de Palmas Casa Grande, AZ | 2.0 | 2.0 | 1106 | $1,199 | $1.08 | 23d | 3 | 0.77mi |
| 2094 N Sweetwater Dr Casa Grande, AZ | 3.0 | 2.0 | 1266 | $1,700 | $1.34 | 25d | 1 | 1.10mi |
| 1858 N Center Ave Casa Grande, AZ | 2.0 | 2.0 | 1146 | $1,500 | $1.31 | 25d | 1 | 1.15mi |
| 1161 E O'Neil Dr Casa Grande, AZ | 2.0–4.0 | 2.0 | 1144 | $1,295 | $1.13 | 4d | 12 | 1.25mi |
| 290 W Viola St Unit 4 Casa Grande, AZ | 2.0 | 1.0 | 800 | $1,250 | $1.56 | 16d | 1 | 1.38mi |
| 645 W Jardin Dr Casa Grande, AZ | 3.0 | 2.0 | 1309 | $1,650 | $1.26 | 25d | 1 | 1.47mi |
| 1620 N Trekell Rd Casa Grande, AZ | 1.0–3.0 | 1.0–2.5 | 1090 | $2,165 | $1.99 | 2d | 1 | 1.48mi |
| 1641 N Kadota Ave Casa Grande, AZ | 1.0–2.0 | 1.0–2.0 | 750 | $1,100 | $1.47 | 2d | 3 | 1.50mi |
Listing history 17 events
-
2026-06-21days on market $139,000 Active 38 DOM
-
2026-06-18days on market $139,000 Active 35 DOM
-
2026-06-17days on market $139,000 Active 34 DOM
-
2026-06-16days on market $139,000 Active 33 DOM
-
2026-06-15days on market $139,000 Active 32 DOM
-
2026-06-13days on market $139,000 Active 30 DOM
-
2026-06-13days on market $139,000 Active 29 DOM
-
2026-06-09days on market $139,000 Active 26 DOM
-
2026-06-08pricedays on market $139,000 Active 25 DOM
-
2026-06-07remarks 554-char remark
-
2026-06-07days on market $145,000 Active 24 DOM
-
2026-06-04days on market $145,000 Active 21 DOM
-
2026-06-03days on market $145,000 Active 20 DOM
-
2026-06-02days on market $145,000 Active 19 DOM
-
2026-06-01days on market $145,000 Active 18 DOM
-
2026-05-31days on market $145,000 Active 17 DOM
-
2026-05-14$145,000 Active
ⓘ Source: listings_history table (triggers on properties + properties_extension) + one-shot
backfill from property_details.listing_events for pre-trigger history.
Climate risk First Street
- Flood 1/10 Low FEMA zone X (shaded) · 0% chance over 30 yrs
- Wildfire 6/10 Major
- Heat 9/10 Extreme 7 d/yr ≥113°F today · 19 d/yr by 30 yrs out
- Wind 1/10 Low
- Air quality 1/10 Low 0 unhealthy d/yr today · 0 by 30 yrs out
Nearby sold comps map
Loading sold comps map…
Walkable amenities ~0.75 mi
Loading nearby amenities…
Taxation est. · year 1
- Rental income
- $18,378
- − Mortgage interest
- −$7,786
- − Property taxes
- −$2,085
- − Insurance
- −$695
- − Repairs & maintenance
- −$1,470
- − Management
- −$1,470
- − Depreciation
- −$4,044
- Taxable income
- $828
- Est. tax owed @ 24.0%
- −$199
- After-tax cash flow
- $2,793/yr
For passive investors: Depreciation is non-cash, so a rental often shows a tax loss while cash-flowing — sheltering income. Rental losses are passive: they offset passive income freely, and up to $25,000/yr can offset ordinary (W-2) income if you actively participate and your MAGI is under $100k (phasing out to $0 by $150k); unused losses carry forward. On sale, claimed depreciation is recaptured at up to 25%, and gains may owe capital-gains tax (a 1031 exchange can defer both). Figures are a year-1 estimate at your 24.0% rate — not tax advice; consult a CPA.
Condition & rehab AI · 30 photos
This well-maintained 2012 home in Rancho Val Vista offers a good balance of updates and original features, making it a solid investment opportunity.
Value-add opportunities
- Both paint interior walls — fresh paint enhances curb appeal and interior aesthetics
- Both replace carpet with hardwood flooring — hardwood flooring is more durable and adds value
- Both install new kitchen backsplash — backsplash adds visual interest and is a common upgrade
Renovation cost estimate screening
Value-add ROI direction
- Both paint interior walls — fresh paint enhances curb appeal and interior aesthetics ↑
- Both replace carpet with hardwood flooring — hardwood flooring is more durable and adds value ↑
- Both install new kitchen backsplash — backsplash adds visual interest and is a common upgrade ↑
ⓘ Cost ranges are severity-bucket heuristics (US national rule-of-thumb). Get contractor quotes + a written scope before underwriting a rehab budget.
Schools (NCES district)
- District
- Casa Grande Union High School District (4453)
- NCES district ID
- 0401740
- Math proficiency
- 14% ▼ -15.00%
- Reading proficiency
- 21% ▼ -10.00%
- Median HH income
- $45,373
- Composite
- 15.38/100
- National rank
- #9319
- State rank
- #193 of 249 in AZ
Livability — Casa Grande
- Score
- 58/100
- State rank
- #220
- US rank
- #21534
Category grades
Schools grade is shown separately in the Schools card above.
Census & demographics
- Census place
- Casa Grande, AZ
- County
- Pinal County · 399,947 people
- City population
- 69,701
- Metro
- Phoenix-Mesa-Chandler, AZ
- Population (ZIP)
- 61,624
- Household income
- $68,443
- Rent vs Own
- Severe rent burden
- 1250.0
Population outlook (Pinal County) Hauer SSP2
- Today (2025)
- 437,574 people
- By 2030
- 446,903 · +2.1%
- By 2040
- 452,589 · +3.4%
- By 2050
- 444,126 · +1.5%
- By 2075
- 430,300 · -1.7%
- By 2100
- 393,536 · -10.1%
Race, ethnicity, and origin ACS 2023
- Neighborhood character
- Diverse neighborhood (Simpson 0.63)
- Race & ethnicity
- Hispanic / Latino 44% White 42% Two or more races 21% Black 4% Native American 4% Asian 1%
- Hispanic origin (detail)
- Mexican 40%
- Common ancestry
- Lithuanian 1% Slovak 1% Portuguese 1%
- Foreign-born
- 12% · Canada
- Languages at home
- 75% English-only · Spanish 23% Tagalog/Filipino 1% Other Indo-European 1%
Political lean MEDSL · Pinal
- 2024 margin
- Strong R (+22.1) · D 38.5% · R 60.6%
- 2008→2024 swing
- -7.6pp toward R · 2008: -14.5pp · 2024: -22.1pp
- All cycles
- 2024: R+22.1 2020: R+17.3 2016: R+19.3 2012: R+17.1 2008: R+14.5
Not yet ingested
- Civics
- —
Market trends
- HPI YoY
- ▼ -67.32%
- Current HPI
- 233.148
- Rent YoY
- ▲ 4.60%
- Metro
- Phoenix-Mesa-Chandler, AZ
- State GDP YoY
- ▲ 4.54%
- F500 in state
- 20
Industry mix (Fortune 500 HQ in AZ)
| Industry | F500 HQs | Revenue |
|---|---|---|
| Technology | 2 | $13B |
|
||
| Mining / Metals | 1 | $23B |
|
||
| Environmental Services | 1 | $16B |
|
||
| Metals / Steel | 1 | $14B |
|
||
| Technology Distribution | 1 | $9B |
|
||
| Homebuilding | 1 | $8B |
|
||
Price history
1 event — show timeline
- 2026-05-14 Listed $145,000 ARMLS
Cash-flow waterfall
monthlySold comps — $/sqft
last 12 mo · ≤1 miLoading sold comps…