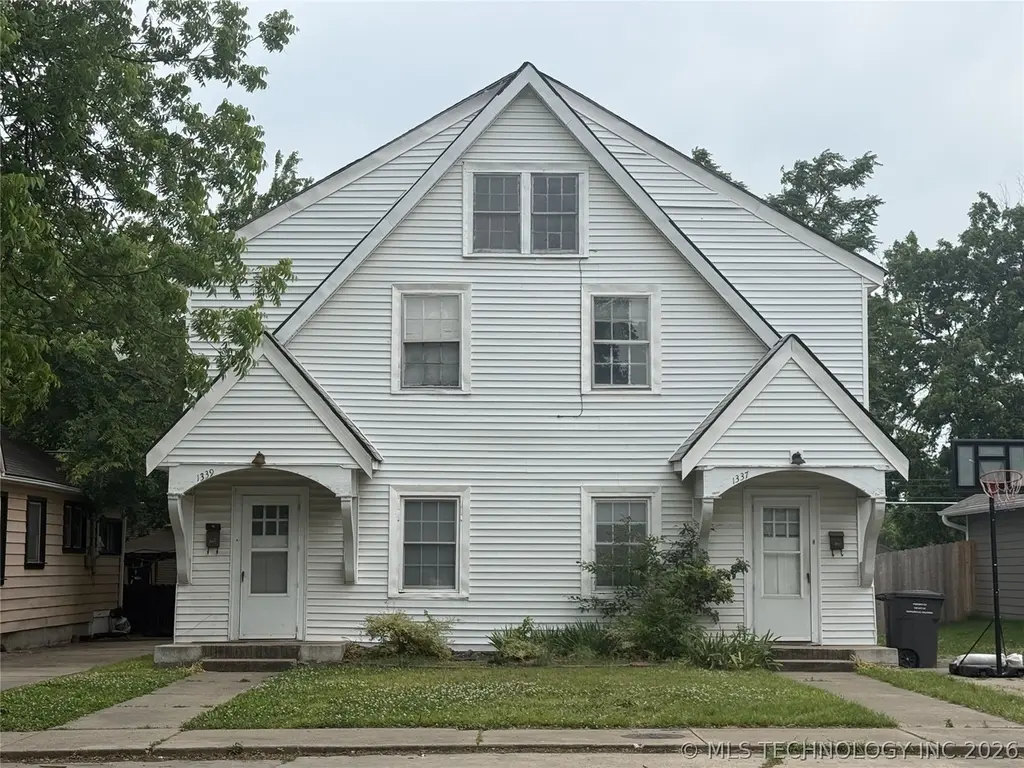
1337 S Keeler Ave · Bartlesville, OK
Flood risk 1/10 · Minimal
- FEMA flood zone
- X (unshaded)
- Chance of flooding over 30 yrs
- 0.0%
- Est. flood insurance / yr
- $507 – $1,088
Fire risk 7/10 · Major
- Est. fire insurance / yr
- $2,463 – $4,575
Heat risk 6/10 · Moderate
- Hot days now (above 112°F)
- 7 days/yr
- Hot days in 30 yrs
- 18 days/yr
Wind risk 2/10 · Minimal
- Chance of severe wind over 30 yrs
- 3.0%
Air-quality risk 2/10 · Minimal
- Unhealthy air days now
- 1 days/yr
- Unhealthy air days in 30 yrs
- 3 days/yr
Risk factors via First Street. Map © Google.
Why this score? — see what drove the B+ grade
The composite is a weighted blend of 9 inputs, each scored 0–100. Each bar is that input's sub-score; the figure is the points it added to the 100-point composite (weight × sub-score).
- Cash flow +30.0/30.0
- DSCR +10.0/10.0
- Appreciation +10.0/10.0
- 1% rule +9.4/10.0
- ARV discount +7.5/15.0
- Livability +3.2/5.0
- Schools +2.6/10.0
- Rent growth +2.5/5.0
- Condition / age +2.5/5.0
$90,000
🖨 Deal sheet 📄 Offer letter ✓ Due diligence
Listing remarks
Great investment opportunity in the established McDaniels II Subdivision! This duplex property features two separate apartments, each offering 2 bedrooms and 1 full bath. Whether you’re looking to expand your investment portfolio or live in one unit while generating rental income from the other, this property offers excellent potential. Conveniently located in a well-established neighborhood close to schools, shopping, and local amenities. Being sold as one building at one price—don’t miss this versatile income-producing property!
Key facts
- 6,885 sq ft lot
- Garage
- Built 1930
Property features AI
Exterior
- Parking: Detached garage (1 car)
- Security: No safety shelter
- Utilities: Electricity available; Natural gas available; Public water; Public sewer
- Home design: Faces east; Crawlspace foundation
- Construction: Built with vinyl siding and wood frame; Asphalt/fiberglass roof
- Exterior features: Patio; Chain link fence; No other exterior features listed
Interior
- Kitchen: Oven; Range; Stove; Refrigerator
- Bedrooms: Master bedroom (first level); Additional bedroom (first level)
- Flooring: Carpet
- Bathrooms: 2 full bathrooms
- Heating & cooling: Central heating (gas); Central air conditioning
- Interior features: Laminate countertops; Ceiling fan(s); Programmable thermostat; Insulated windows with wood frames; Insulated and storm doors
- Laundry & utility: Gas water heater
Neighborhood map
What this means for you Summary
Snapshot
- This is a 4-bed/1.0-bath single-family listed at $90k.
Deal economics
- At list price, monthly cash flow is $425 ($5k/yr) — positive.
- The deal already cash-flows at list — no discount required.
- Meets the 1% rule at list price ($1k rent vs $90k).
- Cap rate 12.0% vs local median 4.7% in Bartlesville — top-decile yield for the area; either an underpriced asset or a hidden risk that comps aren't pricing in. Stress-test before assuming the spread holds.
Location & tenants
- Location reads 64/100 on livability (#175 in OK) — a middle-class / working-renter tenant base. Strengths: cost of living A+, housing A+; Watch: employment C-, schools D+, crime D+.
- Bartlesville (town): math 30% / reading 29% proficiency, ranked #59 of 270 in OK (top 22%) — low school quality limits family demand, transient renter base, plan for 1-2y turnover.
- Market conditions: 137 active listings in the ZIP; 46 units permitted in Washington County in 2024 (0 in 5+ unit buildings).
- This rent runs 33% of the median local income ($47k/yr) — at the standard rent-burdened threshold; future hikes will face affordability resistance.
Forward outlook
- In year one you build about $10k of equity ($622 loan paydown + $9k appreciation (10.0% local appreciation)).
- Washington County population projected at +12% by 2050 — modest demand growth; plan on rents tracking national, not racing it.
- At projected returns (10.0% appreciation + 3.0% rent growth), your $25k cash investment doubles in ~2 years — after that, you're playing with house money.
- By year 4, paydown + projected appreciation supports a ~$34k cash-out refi (75% LTV) — recoverable capital for the next deal without selling this one.
Negotiation context
- Only 12 days on market — expect competitive offers; lowballing is unlikely to land.
- 7 sale attempts since 20y ago; this cycle's ask is 6% above the opening price — seller raised mid-cycle; expect resistance to lowballs.
- Current owner paid $67k; 34% above their basis — modest negotiation headroom, anchor on the comps not their cost.
Risks & watch-outs
- Watch-outs: built in 1930 — expect roof / HVAC / electrical / plumbing capex.
- Climate carrying-cost: major wildfire risk; extreme-heat days projected 7→18/yr by 2055 (HVAC capex compounding) — expect insurance premiums to compound above CPI over the hold.
Questions for the listing agent
- Built in 1930 — when were the roof, HVAC, electrical panel, plumbing, and water heater last replaced?
- Is there a deadline driving the sale (1031 exchange, divorce, estate, relocation)? That informs how much negotiation room exists.
- Schools are D-rated, which usually means shorter tenancies and higher turnover. Who's the typical renter profile here, and what's been the actual vacancy rate?
- Crime grade is D in this area — have there been break-ins, vandalism, or insurance claims at this property in the last 3 years? What carrier currently insures it and at what premium?
- What's the average days-on-market for RENTAL listings here right now (not sales)? A rising rental-DOM trend means longer vacancies and softer asking-rent achievability than the comps imply.
- What's the recent tenant-quality profile in this submarket — average credit score on applications, eviction rate, late-payment / NSF rate, and stable-employment percentage? A property-management company in the area should have these aggregated.
- How much new for-sale + rental construction is in the pipeline within 1–3 miles? Heavy new supply typically softens prices + rents 12–24 months out; constrained supply supports both.
Investment metrics
- 1% rule
- 1.44% ✓
- Cap rate
- 11.95%
- Cash-on-cash
- 20.22%
- DSCR
- 1.90
- GRM
- 5.8
CMA / ARV
- ARV (on-the-fly)
- $223,488
- Comps found
- 12
Show comp detail 12 sales within ~0.75 mi
| Address | Dist | Beds/Ba | Sqft | Sold | Price | $/sf | Match |
|---|---|---|---|---|---|---|---|
| 1520 SW Jennings Ave | 0.22mi | 4/2.0 | 2,024 (-12%) | 4mo | $163,000 | $81 | 62 |
| 1401 SE Delaware Ave | 0.38mi | 4/3.5 | 2,256 (-2%) | 11mo | $350,000 | $155 | 60 |
| 1107 S Keeler Ave | 0.21mi | 3/2.0 (-1) | 2,145 (-7%) | 16mo | $170,000 | $79 | 56 |
| 1490 SE Cherokee Pl | 0.36mi | 3/2.5 (-1) | 2,430 (+6%) | 10mo | $241,000 | $99 | 55 |
| 1625 Cherokee Pl | 0.45mi | 3/2.5 (-1) | 2,398 (+4%) | 8mo | $130,969 | $55 | 55 |
| 1732 S Dewey | 0.53mi | 3/2.5 (-1) | 2,110 (-8%) | 2mo | $245,000 | $116 | 49 |
| 703 SE Delaware Ave | 0.64mi | 4/1.0 | 2,189 (-5%) | 20mo | $62,000 | $28 | 46 |
| 1445 Apple Alley St | 0.60mi | 3/2.0 (-1) | 2,531 (+10%) | 1mo | $245,000 | $97 | 45 |
| 1604 S Johnstone Ave | 0.34mi | 3/3.0 (-1) | 2,134 (-7%) | 18mo | $215,000 | $101 | 43 |
| 1601 Cherokee Pl | 0.41mi | 3/2.0 (-1) | 1,990 (-14%) | 14mo | $175,000 | $88 | 37 |
| 1829 S Dewey Ave | 0.63mi | 3/2.0 (-1) | 2,090 (-9%) | 12mo | $209,000 | $100 | 36 |
| 1316 SE Delaware Ave | 0.42mi | 3/2.5 (-1) | 2,044 (-11%) | 21mo | $164,000 | $80 | 33 |
Match score weights: distance 35% · size 25% · config 20% · recency 20%. Top-matched comps best support the ARV.
Projected returns pro-forma
10.0% appreciation · 3.0% rent growth · sell at horizon
- IRR
- 39.4%
- Equity multiple
- 4.02×
- Total profit
- $76,062
- Equity at exit
- $81,079
- IRR
- 33.9%
- Equity multiple
- 9.05×
- Total profit
- $202,740
- Equity at exit
- $174,850
Cash invested: $25,200 (down + closing). Projections, not guarantees.
Landlord ↔ Tenant lean methodology
- Overall (STATE)
- 83 Strongly Landlord-Friendly
- State Oklahoma
- 83 Strongly Landlord-Friendly · R+20
- County
- — inherits STATE
- City
- — inherits STATE
ZIP-level market 74003
- Home prices YoY
- 5.0%
- Active inventory
- 137
- Price-to-rent
- 5.8×
Monthly cashflow live
- Estimated rent
- $1,298 medium interval (Pro) →
- Mortgage (P&I)
- −$472
- Tax from tax record
- −$91 /mo · $1,093/yr
- Insurance
- −$38
- HOA
- −$0
- Vacancy / Maint / Mgmt
- −$272
- Net cashflow
- $425
Break-even live
UW: 25.0% down · 7.5% · 30yr · 1.5% tax · 5.0% vac · 8.0% maint · 8.0% mgmt
Financing live
Cash to close
- Down payment
- $22,500
- Closing costs
- $2,700
- Reserves months
- —
- Total cash needed
- —
Loan-product check · same deal, 3 products live
Conventional
25% down · 7.5% · 30yr
- Down + closing
- —
- Monthly P&I
- —
- Monthly cashflow
- —
- DSCR
- —
- Eligible?
- —
Personal DTI + credit; lowest rate.
DSCR
20% down · 8.5% · 30yr
- Down + closing
- —
- Monthly P&I
- —
- Monthly cashflow
- —
- DSCR
- —
- Eligible?
- —
No personal income docs; deal must DSCR.
Hard money
10% down · 12.0% · 12mo
- Down + closing
- —
- Monthly P&I
- —
- Monthly cashflow
- —
- DSCR
- —
- Eligible?
- —
Short-term bridge; refi at stabilization.
Listing history 20 events
-
2026-05-18status Active
-
2026-05-18price $90,000
-
2026-04-17historical
-
2026-04-16status Active
-
2026-04-10historical
-
2026-04-07$85,000
-
2026-03-19historical
-
2026-03-06price $114,000
-
2026-02-23price $124,000
-
2026-02-13status Active
-
2026-02-13price $130,000
-
2026-02-08status Pending
-
2026-01-22$135,000 Active
-
2025-03-29status Pending
-
2025-03-29historical
-
2025-03-29$115,000 Active
-
2007-08-02soldstatus $67,000
-
2006-10-06historical
-
2006-04-26$79,500
-
2005-05-17soldstatus $59,000
ⓘ Source: listings_history table (triggers on properties + properties_extension) + one-shot
backfill from property_details.listing_events for pre-trigger history.
Tax reassessment forecast OK · Resets to sale price
- Current annual tax
- $1,093 · $91/mo
- Projected year-2 tax
- $1,093 · $91/mo
- Expected delta
- $0/yr ($0/mo · 0.0%)
ⓘ Screening estimate from a state-policy table — verify with the county assessor before closing.
Climate risk First Street
- Flood 1/10 Low FEMA zone X (unshaded) · 0% chance over 30 yrs
- Wildfire 7/10 Severe
- Heat 6/10 Major 7 d/yr ≥112°F today · 18 d/yr by 30 yrs out
- Wind 2/10 Low 3% chance of damaging wind over 30 yrs
- Air quality 2/10 Low 1 unhealthy d/yr today · 3 by 30 yrs out
Nearby sold comps map
Loading sold comps map…
Walkable amenities ~0.75 mi
Loading nearby amenities…
Taxation est. · year 1
- Rental income
- $15,571
- − Mortgage interest
- −$5,041
- − Property taxes
- −$1,093
- − Insurance
- −$450
- − Repairs & maintenance
- −$1,246
- − Management
- −$1,246
- − Depreciation
- −$2,618
- Taxable income
- $3,877
- Est. tax owed @ 24.0%
- −$931
- After-tax cash flow
- $4,164/yr
For passive investors: Depreciation is non-cash, so a rental often shows a tax loss while cash-flowing — sheltering income. Rental losses are passive: they offset passive income freely, and up to $25,000/yr can offset ordinary (W-2) income if you actively participate and your MAGI is under $100k (phasing out to $0 by $150k); unused losses carry forward. On sale, claimed depreciation is recaptured at up to 25%, and gains may owe capital-gains tax (a 1031 exchange can defer both). Figures are a year-1 estimate at your 24.0% rate — not tax advice; consult a CPA.
Schools (NCES district)
- District
- Bartlesville
- NCES district ID
- 4003630
- Math proficiency
- 30% ▼ -13.00%
- Reading proficiency
- 29% ▼ -10.00%
- Median HH income
- $48,889
- Composite
- 25.69/100
- National rank
- #7389
- State rank
- #59 of 270 in OK
Livability — Bartlesville
- Score
- 64/100
- State rank
- #175
- US rank
- #13940
Category grades
Schools grade is shown separately in the Schools card above.
Census & demographics
- Census place
- Bartlesville, OK
- County
- Washington County · 41,935 people
- City population
- 41,935
- Metro
- Bartlesville, OK
- Population (ZIP)
- 14,024
- Household income
- $47,168
- Rent vs Own
- Severe rent burden
- 395.0
Population outlook (Washington County) Hauer SSP2
- Today (2025)
- 54,946 people
- By 2030
- 56,249 · +2.4%
- By 2040
- 58,867 · +7.1%
- By 2050
- 61,600 · +12.1%
- By 2075
- 69,355 · +26.2%
- By 2100
- 73,067 · +33.0%
Race, ethnicity, and origin ACS 2023
- Neighborhood character
- Predominantly White (69%)
- Race & ethnicity
- White 69% Two or more races 14% Hispanic / Latino 7% Native American 7% Black 4%
- Hispanic origin (detail)
- Mexican 6%
- Common ancestry
- Slovak 2% Lithuanian 2% Italian 2%
- Foreign-born
- 2% · Canada
- Languages at home
- 96% English-only · Spanish 4%
Political lean MEDSL · Washington
- 2024 margin
- Solid R (+47.6) · D 25.0% · R 72.7% · Other 2.4%
- 2008→2024 swing
- -3.1pp toward R · 2008: -44.6pp · 2024: -47.6pp
- All cycles
- 2024: R+47.6 2020: R+48.0 2016: R+48.5 2012: R+47.8 2008: R+44.6
Not yet ingested
- Civics
- —
Market trends
- HPI YoY
- ▲ 14.78%
- Current HPI
- 309.9534
- Rent YoY
- —
- Metro
- Bartlesville, OK
- State GDP YoY
- ▲ 1.55%
- F500 in state
- 6
Industry mix (Fortune 500 HQ in OK)
| Industry | F500 HQs | Revenue |
|---|---|---|
| Energy | 3 | $48B |
|
||
Price history
+52.5% since first listed20 events — show timeline
- 2026-05-18 Relisted — MLS Technology, Inc.
- 2026-05-18 Price Changed $90,000 MLS Technology, Inc.
- 2026-04-17 Listing Removed — MLS Technology, Inc.
- 2026-04-16 Relisted — MLS Technology, Inc.
- 2026-04-10 Listing Removed — MLS Technology, Inc.
- 2026-04-07 Listed $85,000 MLS Technology, Inc.
- 2026-03-19 Listing Removed — MLS Technology, Inc.
- 2026-03-06 Price Changed $114,000 MLS Technology, Inc.
- 2026-02-23 Price Changed $124,000 MLS Technology, Inc.
- 2026-02-13 Relisted — MLS Technology, Inc.
- 2026-02-13 Price Changed $130,000 MLS Technology, Inc.
- 2026-02-08 Pending — MLS Technology, Inc.
- 2026-01-22 Listed $135,000 MLS Technology, Inc.
- 2025-03-29 Pending — MLS Technology, Inc.
- 2025-03-29 Listing Removed — MLS Technology, Inc.
- 2025-03-29 Listed $115,000 MLS Technology, Inc.
- 2007-08-02 Sold (Public Records) $67,000 Public Records
- 2006-10-06 Listing Removed — MLS Technology, Inc.
- 2006-04-26 Listed $79,500 MLS Technology, Inc.
- 2005-05-17 Sold (Public Records) $59,000 Public Records
Property tax history
+1.5%/yrLatest (2025): $1,093 · +1.9% YoY. Source: county tax records.
Cash-flow waterfall
monthlySold comps — $/sqft
last 12 mo · ≤1 miLoading sold comps…