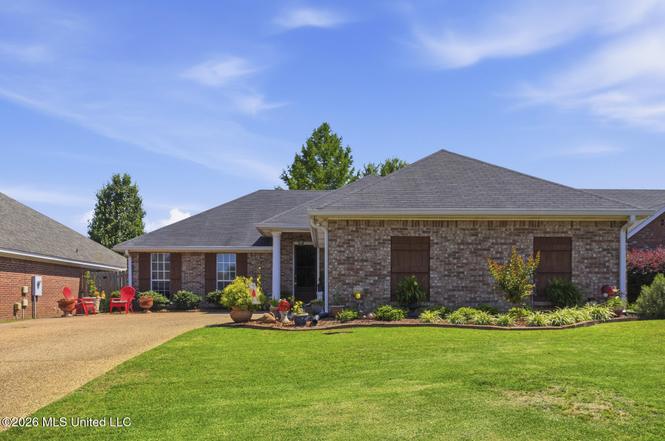
466 Magnolia Pl · Brandon, MS
Flood risk 1/10 · Minimal
- FEMA flood zone
- X (unshaded)
- Chance of flooding over 30 yrs
- 0.0%
- Est. flood insurance / yr
- $507 – $1,088
Fire risk 4/10 · Minor
- Est. fire insurance / yr
- $1,241 – $2,305
Heat risk 7/10 · Major
- Hot days now (above 108°F)
- 7 days/yr
- Hot days in 30 yrs
- 21 days/yr
Wind risk 8/10 · Major
- Chance of severe wind over 30 yrs
- 80.0%
Air-quality risk 2/10 · Minimal
- Unhealthy air days now
- 1 days/yr
- Unhealthy air days in 30 yrs
- 1 days/yr
Risk factors via First Street. Map © Google.
Why this score? — see what drove the D+ grade
The composite is a weighted blend of 9 inputs, each scored 0–100. Each bar is that input's sub-score; the figure is the points it added to the 100-point composite (weight × sub-score).
- Cash flow +17.6/30.0
- ARV discount +7.9/15.0
- DSCR +5.5/10.0
- Schools +4.6/10.0
- Rent growth +4.3/5.0
- Livability +4.0/5.0
- 1% rule +3.6/10.0
- Condition / age +2.5/5.0
- Appreciation +0.0/10.0
$237,000
🖨 Deal sheet (PDF) 📄 Offer letter ✓ Due diligence
Listing remarks
Beautifully maintained home in the desirable Sunchase Subdivision in Brandon, MS. This inviting 3-bedroom, 2-bath residence offers a thoughtfully designed semi-open floor plan. The living room features a warm corner fireplace that creates a cozy focal point and flows seamlessly into the dining area and kitchen. The kitchen has stainless steel appliances, ample cabinetry, and a spacious walk-in-pantry, perfect for everyday living. The primary suite comes with try ceilings and ensuite bath includes double vanities, a walk-in shower, and soaking tub. Step outside to enjoy a covered back patio overlooking a fully fenced, private backyard. The outdoor space is beautifully landscaped in both the
Key facts
- Ensuite bath
- Semi-open floor plan
- Double vanities
Tags
Property features AI
Finance
- HOA & community: Homeowners association with an annual fee of $200 (includes accounting/legal and management)
Exterior
- Parking: 2-car garage; Driveway (concrete)
- Security: Smoke detector(s)
- Utilities: Public water; Public sewer; Electricity connected; Water connected; Sewer connected
- Home design: Single-family house; One story; Move-in ready
- Construction: Brick construction; Architectural shingle roof; Slab foundation; Built in public records (living area)
- Exterior features: Private yard; Patio (slab); Privacy wood fence
Interior
- Kitchen: Built-in electric range; Electric cooktop; Electric range; Self-cleaning oven; Microwave; Dishwasher; Garbage disposal
- Flooring: Carpet; Ceramic tile
- Bathrooms: 2 full bathrooms
- Heating & cooling: Central heating (natural gas); Fireplace heating; Central air; Ceiling fan(s)
- Interior features: Ceiling fan(s); Double vanity; Entrance foyer; Walk-in closet(s); Dead bolt lock(s); Vinyl windows; Living room fireplace
- Laundry & utility: Inside laundry with electric dryer hookup; Gas water heater
Neighborhood map
What this means for you Summary
Snapshot
- This is a 3-bed/2.0-bath single-family listed at $237k.
Deal economics
- At list price, monthly cash flow is $188 ($2k/yr) — positive.
- The deal already cash-flows at list — no discount required.
- To meet the 1% rule (rent ≥ 1% of price), the offer needs to be $203k (14.4% below list).
- Recommended offer: $203k (14.4% below list) — sets the bar for 1% rule.
- Cap rate 7.2% vs local median 4.2% in Brandon — top-decile yield for the area; either an underpriced asset or a hidden risk that comps aren't pricing in. Stress-test before assuming the spread holds.
Location & tenants
- Location reads 81/100 on livability (#3 in MS, #1,514 nationally) — a professional / high-income tenant draw. Strengths: crime A+, employment A+, cost of living A+; Watch: amenities F, commute F.
- Rankin County School District (rural): math 56% / reading 48% proficiency, ranked #6 of 130 in MS (top 5%) — acceptable for families but not a draw, mixed tenant base, ~2y average lease.
- Zoned schools: Rouse Elementary (797 students, 100% FRL); Brandon Middle School (math 67% / reading 49%, grade B, #11 of 179 statewide, top 6%, 1,193 students, 100% FRL); Brandon High School (math 47% / reading 49%, grade D, #27 of 197 statewide, top 13%, 1,648 students, 100% FRL) — zoned schools average 100% FRL vs 35% district-wide (65 pts higher); higher-poverty schools than district average — tighter screening recommended.
- Market conditions: Rents rising fast (+7.1%/yr); 312 active listings in the ZIP; 3 comparable units currently listed for rent nearby; rentals at typical pace (median 25d on market — plan ~3-4 weeks tenant-placement turnaround); solid renter incomes; 343 units permitted in Rankin County in 2024 (0 in 5+ unit buildings).
Forward outlook
- Local home prices are declining (-3.0%/yr); year-one equity from $2k of loan paydown is wiped out by about $7k of value loss. Plan a longer hold.
- Rankin County population projected at +17% by 2050 — long-run rental-demand tailwind backs the buy-and-hold thesis.
Negotiation context
- Only 1 days on market — expect competitive offers; lowballing is unlikely to land.
- 4 sale attempts since 14y ago with the ask held roughly flat each time — persistent listings suggest the price (not the market) is what's stuck; bring a comps-based counter.
Risks & watch-outs
- Climate carrying-cost: severe wind risk, 80% chance of damaging wind over 30y; extreme-heat days projected 7→21/yr by 2055 (HVAC capex compounding) — expect insurance premiums to compound above CPI over the hold.
Questions for the listing agent
- What does the HOA fee cover, when was the last increase, and are there any pending special assessments or reserve-fund shortfalls?
- Is there a deadline driving the sale (1031 exchange, divorce, estate, relocation)? That informs how much negotiation room exists.
- Schools are A-rated — typically a magnet for longer-tenancy family renters. What's the average tenant stay here, and is there a school-zone premium baked into asking?
- The area grade is low — what's the realistic commute time and amenity access for the typical tenant pool here? Any planned neighborhood developments (good or bad) we should know about?
- What's the average days-on-market for RENTAL listings here right now (not sales)? A rising rental-DOM trend means longer vacancies and softer asking-rent achievability than the comps imply.
- What's the recent tenant-quality profile in this submarket — average credit score on applications, eviction rate, late-payment / NSF rate, and stable-employment percentage? A property-management company in the area should have these aggregated.
- How much new for-sale + rental construction is in the pipeline within 1–3 miles? Heavy new supply typically softens prices + rents 12–24 months out; constrained supply supports both.
Investment metrics
- 1% rule
- 0.86% ✗
- Cap rate
- 7.25%
- Cash-on-cash
- 3.41%
- DSCR
- 1.15
- GRM
- 9.7
CMA / ARV
- ARV (on-the-fly)
- $238,992
- Comps found
- 12
Show comp detail 12 sales within ~0.75 mi
| Address | Dist | Beds/Ba | Sqft | Sold | Price | $/sf | Match |
|---|---|---|---|---|---|---|---|
| 404 Briars Bnd | 0.12mi | 3/2.0 | 1,552 (+1%) | 6mo | $239,500 | $154 | 87 |
| 3019 Willow Dr | 0.22mi | 3/2.0 | 1,547 (+1%) | 4mo | $219,000 | $142 | 85 |
| 579 Lincolns Dr | 0.07mi | 3/2.0 | 1,458 (-5%) | 8mo | $235,000 | $161 | 82 |
| 569 Lincolns Dr | 0.02mi | 3/2.0 | 1,436 (-6%) | 10mo | $222,580 | $155 | 80 |
| 205 Edge Water Branch Dr | 0.17mi | 3/2.0 | 1,394 (-9%) | 2mo | $225,000 | $161 | 76 |
| 401 Windchase Dr | 0.17mi | 3/2.0 | 1,411 (-8%) | 5mo | $230,000 | $163 | 75 |
| 116 Windchase Dr | 0.20mi | 3/2.0 | 1,429 (-7%) | 6mo | $230,000 | $161 | 74 |
| 3007 Willow Dr | 0.22mi | 3/2.0 | 1,390 (-9%) | 0mo | $205,000 | $147 | 74 |
| 2030 Red Oak Dr | 0.28mi | 3/2.0 | 1,478 (-4%) | 9mo | $185,000 | $125 | 74 |
| 411 Ms-468 | 0.29mi | 3/2.0 | 1,635 (+7%) | 5mo | $319,000 | $195 | 71 |
| 677 Parker Pl | 0.09mi | 3/2.0 | 1,750 (+14%) | 2mo | $255,000 | $146 | 70 |
| 625 Briars Bnd | 0.12mi | 3/2.0 | 1,348 (-12%) | 10mo | $210,000 | $156 | 66 |
Match score weights: distance 35% · size 25% · config 20% · recency 20%. Top-matched comps best support the ARV.
Projected returns pro-forma
-3.0% appreciation · 7.13% rent growth · sell at horizon
- IRR
- -7.0%
- Equity multiple
- 0.73×
- Total profit
- $-17,729
- Equity at exit
- $35,337
- IRR
- 6.7%
- Equity multiple
- 1.59×
- Total profit
- $38,836
- Equity at exit
- $20,491
Cash invested: $66,360 (down + closing). Projections, not guarantees.
Landlord ↔ Tenant lean methodology
- Overall (STATE)
- 90 Strongly Landlord-Friendly
- State Mississippi
- 90 Strongly Landlord-Friendly · R+11
- County
- — inherits STATE
- City
- — inherits STATE
ZIP-level market 39042
- Home prices YoY
- -34.3%
- Rents YoY
- 7.1%
- Active inventory
- 312
- Price-to-rent
- 9.7×
Monthly cashflow live
- Estimated rent
- $2,030 medium interval (Pro) →
- Mortgage (P&I)
- −$1,243
- Tax from tax record
- −$57 /mo · $679/yr
- Insurance
- −$99
- HOA
- −$17
- Vacancy / Maint / Mgmt
- −$426
- Net cashflow
- $188
Break-even live
Sensitivity live
| Price | -10% $323 | -5% $255 | +0% $188 | +5% $121 | +10% $54 |
|---|---|---|---|---|---|
| Rent | -10% $28 | -5% $108 | +0% $188 | +5% $269 | +10% $349 |
| Rate | -1.0pp $308 | -0.5pp $249 | base $188 | +0.5pp $127 | +1.0pp $64 |
UW: 25.0% down · 7.5% · 30yr · 1.5% tax · 5.0% vac · 8.0% maint · 8.0% mgmt
Financing live
Cash to close
- Down payment
- $59,250
- Closing costs
- $7,110
- Reserves months
- —
- Total cash needed
- —
Loan-product check · same deal, 3 products live
Conventional
25% down · 7.5% · 30yr
- Down + closing
- —
- Monthly P&I
- —
- Monthly cashflow
- —
- DSCR
- —
- Eligible?
- —
Personal DTI + credit; lowest rate.
DSCR
20% down · 8.5% · 30yr
- Down + closing
- —
- Monthly P&I
- —
- Monthly cashflow
- —
- DSCR
- —
- Eligible?
- —
No personal income docs; deal must DSCR.
Hard money
10% down · 12.0% · 12mo
- Down + closing
- —
- Monthly P&I
- —
- Monthly cashflow
- —
- DSCR
- —
- Eligible?
- —
Short-term bridge; refi at stabilization.
Rent comps 3 comps
| Address | Beds | Baths | Sqft | Rent | $/sqft | DOM | Units | Dist |
|---|---|---|---|---|---|---|---|---|
| 114 Fox Meadow Dr Brandon, MS | 3.0 | 2.0 | 1500 | $2,250 | $1.50 | 15d | 1 | 0.80mi |
| 1500 Chapelridge Way Brandon, MS | 3.0 | 2.0 | 1081 | $1,609 | $1.49 | 25d | 1 | 1.01mi |
| 202 Overby St Brandon, MS | 3.0 | 2.0 | 1394 | $1,786 | $1.28 | 45d | 1 | 1.31mi |
HOA detail
- Monthly dues
- $17 · $204/yr
Listing history 2 events
-
2026-06-22remarks 699-char remark
-
2026-06-22$237,000 Active 1 DOM
ⓘ Source: listings_history table (triggers on properties + properties_extension) + one-shot
backfill from property_details.listing_events for pre-trigger history.
Tax reassessment forecast MS · Resets to sale price
- Current annual tax
- $679 · $57/mo
- Projected year-2 tax
- $1,872 · $156/mo
- Expected delta
- +$1,194/yr (+$99/mo · 175.8%)
ⓘ Screening estimate from a state-policy table — verify with the county assessor before closing.
Climate risk First Street
- Flood 1/10 Low FEMA zone X (unshaded) · 0% chance over 30 yrs
- Wildfire 4/10 Moderate
- Heat 7/10 Severe 7 d/yr ≥108°F today · 21 d/yr by 30 yrs out
- Wind 8/10 Severe 80% chance of damaging wind over 30 yrs
- Air quality 2/10 Low 1 unhealthy d/yr today · 1 by 30 yrs out
Nearby sold comps map
Loading sold comps map…
Walkable amenities ~0.75 mi
Loading nearby amenities…
Taxation est. · year 1
- Rental income
- $24,357
- − Mortgage interest
- −$13,276
- − Property taxes
- −$679
- − Insurance
- −$1,185
- − Repairs & maintenance
- −$1,949
- − Management
- −$1,949
- − HOA
- −$204
- − Depreciation
- −$6,895
- Taxable loss
- −$1,778
- Est. tax savings @ 24.0%
- +$427
- After-tax cash flow
- $2,687/yr
For passive investors: Depreciation is non-cash, so a rental often shows a tax loss while cash-flowing — sheltering income. Rental losses are passive: they offset passive income freely, and up to $25,000/yr can offset ordinary (W-2) income if you actively participate and your MAGI is under $100k (phasing out to $0 by $150k); unused losses carry forward. On sale, claimed depreciation is recaptured at up to 25%, and gains may owe capital-gains tax (a 1031 exchange can defer both). Figures are a year-1 estimate at your 24.0% rate — not tax advice; consult a CPA.
Schools (NCES district)
- District
- Rankin County School District
- NCES district ID
- 2803830
- Math proficiency
- 56% ▼ -4.00%
- Reading proficiency
- 48% ▼ -6.00%
- Median HH income
- $61,867
- Composite
- 45.62/100
- National rank
- #2587
- State rank
- #6 of 130 in MS
Livability — Brandon
- Score
- 81/100
- State rank
- #3
- US rank
- #1514
Category grades
Schools grade is shown separately in the Schools card above.
Census & demographics
- Census place
- Brandon, MS
- County
- Rankin County · 123,614 people
- City population
- 79,950
- Metro
- Jackson, MS
- Population (ZIP)
- 39,142
- Household income
- $88,597
- Rent vs Own
- Severe rent burden
- 474.0
Population outlook (Rankin County) Hauer SSP2
- Today (2025)
- 164,317 people
- By 2030
- 171,013 · +4.1%
- By 2040
- 182,723 · +11.2%
- By 2050
- 192,376 · +17.1%
- By 2075
- 209,535 · +27.5%
- By 2100
- 209,534 · +27.5%
Race, ethnicity, and origin ACS 2023
- Neighborhood character
- Predominantly White (75%)
- Race & ethnicity
- White 75% Black 21% Hispanic / Latino 2% Two or more races 2%
- Common ancestry
- Italian 5% Slovak 2% Iranian 2%
- Foreign-born
- 2% · Canada
- Languages at home
- 97% English-only · Spanish 2%
Political lean MEDSL · Rankin
- 2024 margin
- Solid R (+47.1) · D 25.9% · R 73.0% · Other 1.0%
- 2008→2024 swing
- +6.4pp toward D · 2008: -53.5pp · 2024: -47.1pp
- All cycles
- 2024: R+47.1 2020: R+45.4 2016: R+52.9 2012: R+51.9 2008: R+53.5
Not yet ingested
- Civics
- —
Market trends
- HPI YoY
- ▼ -90.04%
- Current HPI
- 172.5248
- Rent YoY
- ▲ 7.13%
- Metro
- Jackson, MS
- State GDP YoY
- —
- F500 in state
- 0
Price history
+60.7% since first listed8 events — show timeline
- 2026-06-20 Listed $237,000 MLSU
- 2025-02-01 Listing Removed — MLSU
- 2025-01-25 Listed $230,000 MLSU
- 2021-10-02 Listing Removed — MLSU
- 2012-11-02 Sold (MLS) — MLSU
- 2012-08-17 Listed $115,000 MLSU
- 2012-05-27 Listed $147,500 MLSU
- 2005-06-10 Sold (Public Records) — Public Records
Property tax history
+1.3%/yrLatest (2025): $679 · +1.4% YoY. Source: county tax records.
Cash-flow waterfall
monthlySold comps — $/sqft
last 12 mo · ≤1 miLoading sold comps…