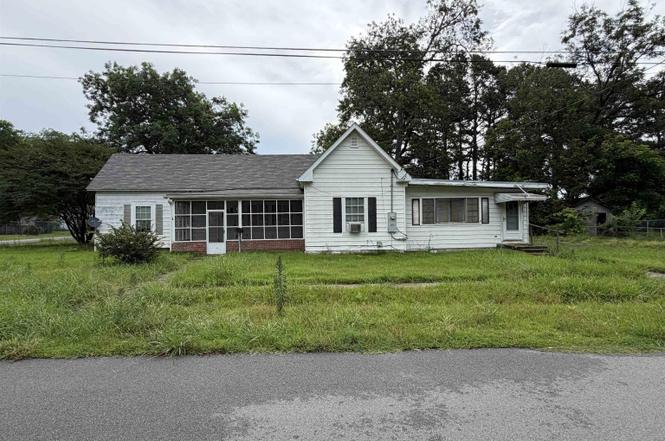
303 Reynolds · Lonoke, AR
Flood risk 1/10 · Minimal
- FEMA flood zone
- X (unshaded)
- Chance of flooding over 30 yrs
- 0.0%
- Est. flood insurance / yr
- $507 – $1,088
Fire risk 1/10 · Minimal
- Est. fire insurance / yr
- $1,499 – $2,785
Heat risk 7/10 · Major
- Hot days now (above 110°F)
- 7 days/yr
- Hot days in 30 yrs
- 20 days/yr
Wind risk 4/10 · Minor
- Chance of severe wind over 30 yrs
- 10.0%
Air-quality risk 2/10 · Minimal
- Unhealthy air days now
- 1 days/yr
- Unhealthy air days in 30 yrs
- 1 days/yr
Risk factors via First Street. Map © Google.
Why this score? — see what drove the B- grade
The composite is a weighted blend of 9 inputs, each scored 0–100. Each bar is that input's sub-score; the figure is the points it added to the 100-point composite (weight × sub-score).
- Cash flow +30.0/30.0
- 1% rule +10.0/10.0
- DSCR +10.0/10.0
- ARV discount +7.5/15.0
- Livability +3.2/5.0
- Schools +2.6/10.0
- Rent growth +2.5/5.0
- Condition / age +1.0/5.0
- Appreciation +0.0/10.0
$70,000
🖨 Deal sheet 📄 Offer letter ✓ Due diligence
Listing remarks
Great investment opportunity on a large corner lot
Key facts
- Large corner lot
- 0.35 acre lot
- Listed 10 days
Tags
Property features AI
Finance
- Other: Approximately 0.35 acre lot; Approximately 125' front footage
Exterior
- Utilities: Septic system
- Home design: Frame exterior
- Construction: Composition roof; Crawl space foundation
- Exterior features: Level lot; Paved road access
Interior
- Flooring: Carpet; Wood
- Bathrooms: 3 full bathrooms
- Heating & cooling: Window units
- Interior features: Formal living room; Carpet and wood floors; Window air conditioning units
Neighborhood map
What this means for you Summary
Snapshot
- This is a 3-bed/3.0-bath single-family listed at $70k. Condition is rated poor.
Deal economics
- At list price, monthly cash flow is $583 ($7k/yr) — positive.
- The deal already cash-flows at list — no discount required.
- Meets the 1% rule at list price ($1k rent vs $70k).
- Cap rate 16.3% vs local median 5.7% in Lonoke — top-decile yield for the area; either an underpriced asset or a hidden risk that comps aren't pricing in. Stress-test before assuming the spread holds.
Location & tenants
- Location reads 63/100 on livability (#195 in AR) — a middle-class / working-renter tenant base. Strengths: cost of living A+, health & safety A, housing A-; Watch: schools F, crime F, amenities F.
- Lonoke School District (town): math 30% / reading 31% proficiency, ranked #146 of 238 in AR (top 61%) — families likely to look elsewhere, expect single-tenant / working-renter base with shorter leases.
- Market conditions: 61 active listings in the ZIP; 1 comparable units currently listed for rent nearby; 185 units permitted in Lonoke County in 2024 (0 in 5+ unit buildings).
Forward outlook
- Local home prices are declining (-3.0%/yr); year-one equity from $484 of loan paydown is wiped out by about $2k of value loss. Plan a longer hold.
- Lonoke County population projected at +12% by 2050 — modest demand growth; plan on rents tracking national, not racing it.
- At projected returns (-3.0% appreciation + 3.0% rent growth), your $20k cash investment doubles in ~4 years — after that, you're playing with house money.
Negotiation context
- Only 10 days on market — expect competitive offers; lowballing is unlikely to land.
- 3 sale attempts since 7y ago with the ask held roughly flat each time — persistent listings suggest the price (not the market) is what's stuck; bring a comps-based counter.
Risks & watch-outs
- Climate carrying-cost: extreme-heat days projected 7→20/yr by 2055 (HVAC capex compounding) — expect insurance premiums to compound above CPI over the hold.
Questions for the listing agent
- Have any recent inspections been done? Can we get a copy of the seller's disclosures and any deferred-maintenance estimates?
- Is there a deadline driving the sale (1031 exchange, divorce, estate, relocation)? That informs how much negotiation room exists.
- Schools are F-rated, which usually means shorter tenancies and higher turnover. Who's the typical renter profile here, and what's been the actual vacancy rate?
- Crime grade is F in this area — have there been break-ins, vandalism, or insurance claims at this property in the last 3 years? What carrier currently insures it and at what premium?
- What's the average days-on-market for RENTAL listings here right now (not sales)? A rising rental-DOM trend means longer vacancies and softer asking-rent achievability than the comps imply.
- What's the recent tenant-quality profile in this submarket — average credit score on applications, eviction rate, late-payment / NSF rate, and stable-employment percentage? A property-management company in the area should have these aggregated.
- How much new for-sale + rental construction is in the pipeline within 1–3 miles? Heavy new supply typically softens prices + rents 12–24 months out; constrained supply supports both.
Investment metrics
- 1% rule
- 1.93% ✓
- Cap rate
- 16.28%
- Cash-on-cash
- 35.68%
- DSCR
- 2.59
- GRM
- 4.3
CMA / ARV
- ARV (on-the-fly)
- $198,525
- Comps found
- 4
Show comp detail 4 sales within ~0.75 mi
| Address | Dist | Beds/Ba | Sqft | Sold | Price | $/sf | Match |
|---|---|---|---|---|---|---|---|
| 503 Jefferson St | 0.30mi | 2/2.0 (-1) | 2,476 (-6%) | 4mo | $195,900 | $79 | 63 |
| 703 W 4th St | 0.63mi | 3/2.5 | 2,312 (-13%) | 0mo | $69,900 | $30 | 47 |
| 718 N Barnes St | 0.58mi | 3/2.0 | 2,300 (-13%) | 1mo | $155,000 | $67 | 46 |
| 819 W Front St | 0.69mi | 3/1.0 | 2,400 (-9%) | 6mo | $179,000 | $75 | 39 |
Match score weights: distance 35% · size 25% · config 20% · recency 20%. Top-matched comps best support the ARV.
Projected returns pro-forma
-3.0% appreciation · 3.0% rent growth · sell at horizon
- IRR
- 31.3%
- Equity multiple
- 2.32×
- Total profit
- $25,793
- Equity at exit
- $10,437
- IRR
- 38.5%
- Equity multiple
- 4.59×
- Total profit
- $70,335
- Equity at exit
- $6,052
Cash invested: $19,600 (down + closing). Projections, not guarantees.
Landlord ↔ Tenant lean methodology
- Overall (STATE)
- 92 Strongly Landlord-Friendly
- State Arkansas
- 92 Strongly Landlord-Friendly · R+14
- County
- — inherits STATE
- City
- — inherits STATE
ZIP-level market 72086
- Home prices YoY
- -18.4%
- Active inventory
- 61
- Price-to-rent
- 4.3×
Monthly cashflow live
- Estimated rent
- $1,350 medium interval (Pro) →
- Mortgage (P&I)
- −$367
- Tax est. 1.5%
- −$88 /mo · $1,050/yr
- Insurance
- −$29
- HOA
- −$0
- Vacancy / Maint / Mgmt
- −$284
- Net cashflow
- $583
Break-even live
UW: 25.0% down · 7.5% · 30yr · 1.5% tax · 5.0% vac · 8.0% maint · 8.0% mgmt
Financing live
Cash to close
- Down payment
- $17,500
- Closing costs
- $2,100
- Reserves months
- —
- Total cash needed
- —
Loan-product check · same deal, 3 products live
Conventional
25% down · 7.5% · 30yr
- Down + closing
- —
- Monthly P&I
- —
- Monthly cashflow
- —
- DSCR
- —
- Eligible?
- —
Personal DTI + credit; lowest rate.
DSCR
20% down · 8.5% · 30yr
- Down + closing
- —
- Monthly P&I
- —
- Monthly cashflow
- —
- DSCR
- —
- Eligible?
- —
No personal income docs; deal must DSCR.
Hard money
10% down · 12.0% · 12mo
- Down + closing
- —
- Monthly P&I
- —
- Monthly cashflow
- —
- DSCR
- —
- Eligible?
- —
Short-term bridge; refi at stabilization.
Rent comps 1 comps
| Address | Beds | Baths | Sqft | Rent | $/sqft | DOM | Units | Dist |
|---|---|---|---|---|---|---|---|---|
| 202 Rosemary Ln Lonoke, AR | 3.0 | 2.0 | 1780 | $1,350 | $0.76 | 43d | 1 | 0.76mi |
Listing history 9 events
-
2026-06-18days on market $70,000 Active 10 DOM
-
2026-06-17days on market $70,000 Active 9 DOM
-
2026-06-16days on market $70,000 Active 8 DOM
-
2026-06-15statusdays on market $70,000 Active 7 DOM
-
2026-06-14days on market $70,000 New Listing 5 DOM
-
2026-06-13days on market $70,000 New Listing 4 DOM
-
2026-06-10days on market $70,000 New Listing 2 DOM
-
2026-06-09remarks 50-char remark
-
2026-06-09$70,000 New Listing 1 DOM
ⓘ Source: listings_history table (triggers on properties + properties_extension) + one-shot
backfill from property_details.listing_events for pre-trigger history.
Climate risk First Street
- Flood 1/10 Low FEMA zone X (unshaded) · 0% chance over 30 yrs
- Wildfire 1/10 Low
- Heat 7/10 Severe 7 d/yr ≥110°F today · 20 d/yr by 30 yrs out
- Wind 4/10 Moderate 10% chance of damaging wind over 30 yrs
- Air quality 2/10 Low 1 unhealthy d/yr today · 1 by 30 yrs out
Nearby sold comps map
Loading sold comps map…
Walkable amenities ~0.75 mi
Loading nearby amenities…
Taxation est. · year 1
- Rental income
- $16,200
- − Mortgage interest
- −$3,921
- − Property taxes
- −$1,050
- − Insurance
- −$350
- − Repairs & maintenance
- −$1,296
- − Management
- −$1,296
- − Depreciation
- −$2,036
- Taxable income
- $6,251
- Est. tax owed @ 24.0%
- −$1,500
- After-tax cash flow
- $5,493/yr
For passive investors: Depreciation is non-cash, so a rental often shows a tax loss while cash-flowing — sheltering income. Rental losses are passive: they offset passive income freely, and up to $25,000/yr can offset ordinary (W-2) income if you actively participate and your MAGI is under $100k (phasing out to $0 by $150k); unused losses carry forward. On sale, claimed depreciation is recaptured at up to 25%, and gains may owe capital-gains tax (a 1031 exchange can defer both). Figures are a year-1 estimate at your 24.0% rate — not tax advice; consult a CPA.
Condition & rehab AI · 2 photos
This property requires extensive repairs and improvements to become a move-in-ready investment opportunity.
Repairs flagged
- Major Exterior paint — Peeling paint indicates significant wear
- Major Landscaping — Overgrown vegetation needs trimming
- Major Roof inspection — Aged roof may need replacement
- Major Foundation inspection — Older structure may have structural issues
- Major HVAC/mechanicals — Older systems may need replacement
Value-add opportunities
- Both Landscaping and curb appeal improvements — Enhances curb appeal and property value
- Both Exterior painting — Improves appearance and property value
- Both HVAC/mechanical upgrades — Improves comfort and energy efficiency
- Both Roof replacement — Ensures structural integrity and longevity
Renovation cost estimate screening
| Repair item | Severity | Est. cost |
|---|---|---|
| Exterior paint · Peeling paint indicates significant wear | Major | $15,000–50,000 |
| Landscaping · Overgrown vegetation needs trimming | Major | $15,000–50,000 |
| Roof inspection · Aged roof may need replacement | Major | $15,000–50,000 |
| Foundation inspection · Older structure may have structural issues | Major | $15,000–50,000 |
| HVAC/mechanicals · Older systems may need replacement | Major | $15,000–50,000 |
| Total estimated repair cost · 5 items | $75,000–250,000 |
Value-add ROI direction
- Both Landscaping and curb appeal improvements — Enhances curb appeal and property value ↑
- Both Exterior painting — Improves appearance and property value ↑
- Both HVAC/mechanical upgrades — Improves comfort and energy efficiency ↑
- Both Roof replacement — Ensures structural integrity and longevity ↑
ⓘ Cost ranges are severity-bucket heuristics (US national rule-of-thumb). Get contractor quotes + a written scope before underwriting a rehab budget.
Schools (NCES district)
- District
- Lonoke School District
- NCES district ID
- 0509060
- Math proficiency
- 30% ▼ -10.00%
- Reading proficiency
- 31% ▼ -2.00%
- Median HH income
- $46,440
- Composite
- 26.28/100
- National rank
- #7247
- State rank
- #146 of 238 in AR
Livability — Lonoke
- Score
- 63/100
- State rank
- #195
- US rank
- #15446
Category grades
Schools grade is shown separately in the Schools card above.
Census & demographics
- Census place
- Lonoke, AR
- Population (ZIP)
- 12,250
Population outlook (Lonoke County) Hauer SSP2
- Today (2025)
- 78,072 people
- By 2030
- 80,673 · +3.3%
- By 2040
- 84,977 · +8.8%
- By 2050
- 87,778 · +12.4%
- By 2075
- 91,398 · +17.1%
- By 2100
- 87,858 · +12.5%
Race, ethnicity, and origin ACS 2023
- Neighborhood character
- Predominantly White (79%)
- Race & ethnicity
- White 79% Black 10% Hispanic / Latino 6% Two or more races 5%
- Hispanic origin (detail)
- Mexican 6%
- Common ancestry
- Lithuanian 1% Portuguese 1% Slovak 1%
- Foreign-born
- 4% · Canada
- Languages at home
- 94% English-only · Spanish 5% Other Asian/Pacific 1%
Political lean MEDSL · Lonoke
- 2024 margin
- Solid R (+53.7) · D 22.2% · R 75.8% · Other 2.0%
- 2008→2024 swing
- -6.2pp toward R · 2008: -47.5pp · 2024: -53.7pp
- All cycles
- 2024: R+53.7 2020: R+52.8 2016: R+53.3 2012: R+50.9 2008: R+47.5
Not yet ingested
- Civics
- —
Market trends
- HPI YoY
- ▼ -44.46%
- Current HPI
- 197.6009
- Rent YoY
- —
- Metro
- —
- State GDP YoY
- ▲ 3.80%
- F500 in state
- 10
Industry mix (Fortune 500 HQ in AR)
| Industry | F500 HQs | Revenue |
|---|---|---|
| Retail | 1 | $681B |
|
||
| Food / Agriculture | 1 | $53B |
|
||
| Retail / Energy | 1 | $22B |
|
||
| Transportation / Logistics | 1 | $12B |
|
||
| Energy | 1 | $4B |
|
||
Price history
-6.7% since first listed7 events — show timeline
- 2026-06-08 Listed $70,000 CARMLS
- 2021-01-26 Listing Removed — CARMLS
- 2020-07-16 Relisted — CARMLS
- 2020-07-16 Listing Removed — CARMLS
- 2020-06-30 Price Changed $70,500 CARMLS
- 2019-08-23 Price Changed $72,500 CARMLS
- 2019-07-15 Listed $75,000 CARMLS
Cash-flow waterfall
monthlySold comps — $/sqft
last 12 mo · ≤1 miLoading sold comps…