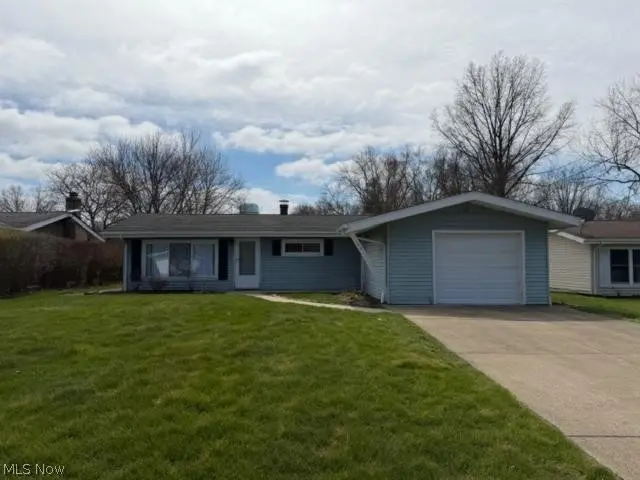
166 Huntington Dr · Northfield, OH
Flood risk 1/10 · Minimal
- FEMA flood zone
- X (unshaded)
- Chance of flooding over 30 yrs
- 0.0%
- Est. flood insurance / yr
- $507 – $1,088
Fire risk 1/10 · Minimal
- Est. fire insurance / yr
- $713 – $1,323
Heat risk 3/10 · Minor
- Hot days now (above 96°F)
- 7 days/yr
- Hot days in 30 yrs
- 17 days/yr
Wind risk 1/10 · Minimal
- Chance of severe wind over 30 yrs
- —
Air-quality risk 2/10 · Minimal
- Unhealthy air days now
- 1 days/yr
- Unhealthy air days in 30 yrs
- 3 days/yr
Risk factors via First Street. Map © Google.
Why this score? — see what drove the D- grade
The composite is a weighted blend of 9 inputs, each scored 0–100. Each bar is that input's sub-score; the figure is the points it added to the 100-point composite (weight × sub-score).
- Cash flow +11.5/30.0
- Schools +6.6/10.0
- ARV discount +4.3/15.0
- Livability +4.0/5.0
- DSCR +3.4/10.0
- 1% rule +2.6/10.0
- Rent growth +2.5/5.0
- Condition / age +2.5/5.0
- Appreciation +0.0/10.0
$219,900
🖨 Deal sheet 📄 Offer letter ✓ Due diligence
Listing remarks
Come see this refreshed 3-bedroom, 1-bath ranch in Northfield Village. This home features fresh paint and new flooring throughout, giving it a clean, updated feel. Completely refreshed and move-in ready, it is ready for its new owner. Schedule your showing today.
Key facts
- 7,801 sq ft lot
- Garage
- Built 1960
Property features AI
Exterior
- Parking: Attached garage with 1 garage space
- Utilities: Public water; Public sewer
- Home design: Single-story home
- Construction: Vinyl siding; Asphalt/fiberglass roof; Slab foundation; Built per public records
- Exterior features: Lot recorded at approximately 0.179 acres
Interior
- Kitchen: Kitchen (first floor)
- Bedrooms: Three main-level bedrooms
- Bathrooms: One full main-level bathroom
- Heating & cooling: Central air conditioning; Forced-air gas heating
- Interior features: Total of 5 rooms
Neighborhood map
What this means for you Summary
Snapshot
- This is a 3-bed/1.0-bath single-family listed at $220k.
Deal economics
- At list price, monthly cash flow is $-71 ($-847/yr) — negative.
- To cash-flow at today's rent, offer at most $207k (5.7% below list).
- To meet the 1% rule (rent ≥ 1% of price), the offer needs to be $168k (23.6% below list).
- Recommended offer: $168k (23.6% below list) — sets the bar for 1% rule.
Location & tenants
- Location reads 79/100 on livability (#143 in OH, #2,208 nationally) — a middle-class / working-renter tenant base. Strengths: schools A+, crime A+, cost of living A+; Watch: amenities F, commute F.
- Nordonia Hills City (suburban): math 72% / reading 79% proficiency, ranked #71 of 656 in OH (top 11%) — strong family-tenant draw, lease renewals of 3-5y typical; only 17% free/reduced lunch — higher-income household profile.
- Market conditions: 69 active listings in the ZIP; 1 comparable units currently listed for rent nearby; solid renter incomes; 1,114 units permitted in Summit County in 2024 (397 in 5+ unit buildings).
Forward outlook
- Local home prices are declining (-3.0%/yr); year-one equity from $2k of loan paydown is wiped out by about $7k of value loss. Plan a longer hold.
- Summit County population projected to shrink 6% by 2050 — rents likely to lag national; underwrite the cash flow, not the appreciation.
Negotiation context
- It's been on market 56 days — a 3% lower offer ($213k) is reasonable based on typical stale-listing flexibility.
- Current owner paid $160k; 37% above their basis — modest negotiation headroom, anchor on the comps not their cost.
Questions for the listing agent
- What do current leases actually rent for vs. the listed asking? Can we see a recent rent roll and the last 12 months of T-12 income?
- It's been on market 56 days. Have you received any prior offers? Is the seller open to a 24% concession, seller financing, or rate buy-down credit?
- Built in 1960 — when were the roof, HVAC, electrical panel, plumbing, and water heater last replaced?
- Is there a deadline driving the sale (1031 exchange, divorce, estate, relocation)? That informs how much negotiation room exists.
- Schools are A-rated — typically a magnet for longer-tenancy family renters. What's the average tenant stay here, and is there a school-zone premium baked into asking?
- The area grade is low — what's the realistic commute time and amenity access for the typical tenant pool here? Any planned neighborhood developments (good or bad) we should know about?
- What's the average days-on-market for RENTAL listings here right now (not sales)? A rising rental-DOM trend means longer vacancies and softer asking-rent achievability than the comps imply.
- What's the recent tenant-quality profile in this submarket — average credit score on applications, eviction rate, late-payment / NSF rate, and stable-employment percentage? A property-management company in the area should have these aggregated.
- How much new for-sale + rental construction is in the pipeline within 1–3 miles? Heavy new supply typically softens prices + rents 12–24 months out; constrained supply supports both.
Investment metrics
- 1% rule
- 0.76% ✗
- Cap rate
- 5.91%
- Cash-on-cash
- -1.38%
- DSCR
- 0.94
- GRM
- 10.9
CMA / ARV
- ARV (on-the-fly)
- $205,440
- Comps found
- 5
Show comp detail 5 sales within ~0.75 mi
| Address | Dist | Beds/Ba | Sqft | Sold | Price | $/sf | Match |
|---|---|---|---|---|---|---|---|
| 166 Huntington Dr | 0.00mi | 3/1.0 | 960 (0%) | 1mo | $219,900 | $229 | 99 |
| 151 Kennedy Blvd | 0.66mi | 3/1.0 | 960 (0%) | 13mo | $258,000 | $269 | 58 |
| 106 Maple Ave | 0.50mi | 3/1.0 | 1,092 (+14%) | 4mo | $185,000 | $169 | 50 |
| 221 Magnolia Ave | 0.31mi | 3/2.5 | 1,056 (+10%) | 15mo | $226,500 | $214 | 50 |
| 48 Birch Ave | 0.41mi | 2/2.0 (-1) | 924 (-4%) | 20mo | $96,000 | $104 | 49 |
Match score weights: distance 35% · size 25% · config 20% · recency 20%. Top-matched comps best support the ARV.
Projected returns pro-forma
-3.0% appreciation · 3.0% rent growth · sell at horizon
- IRR
- -18.6%
- Equity multiple
- 0.35×
- Total profit
- $-40,178
- Equity at exit
- $32,788
- IRR
- -11.1%
- Equity multiple
- 0.33×
- Total profit
- $-40,977
- Equity at exit
- $19,013
Cash invested: $61,572 (down + closing). Projections, not guarantees.
Landlord ↔ Tenant lean methodology
- Overall (STATE)
- 73 Landlord-Friendly
- State Ohio
- 73 Landlord-Friendly · R+6
- County
- — inherits STATE
- City
- — inherits STATE
ZIP-level market 44067
- Active inventory
- 69
- Price-to-rent
- 10.9×
Monthly cashflow live
- Estimated rent
- $1,679 medium interval (Pro) →
- Mortgage (P&I)
- −$1,153
- Tax from tax record
- −$152 /mo · $1,826/yr
- Insurance
- −$92
- HOA
- −$0
- Vacancy / Maint / Mgmt
- −$353
- Net cashflow
- $-71
Break-even live
UW: 25.0% down · 7.5% · 30yr · 1.5% tax · 5.0% vac · 8.0% maint · 8.0% mgmt
Financing live
Cash to close
- Down payment
- $54,975
- Closing costs
- $6,597
- Reserves months
- —
- Total cash needed
- —
Loan-product check · same deal, 3 products live
Conventional
25% down · 7.5% · 30yr
- Down + closing
- —
- Monthly P&I
- —
- Monthly cashflow
- —
- DSCR
- —
- Eligible?
- —
Personal DTI + credit; lowest rate.
DSCR
20% down · 8.5% · 30yr
- Down + closing
- —
- Monthly P&I
- —
- Monthly cashflow
- —
- DSCR
- —
- Eligible?
- —
No personal income docs; deal must DSCR.
Hard money
10% down · 12.0% · 12mo
- Down + closing
- —
- Monthly P&I
- —
- Monthly cashflow
- —
- DSCR
- —
- Eligible?
- —
Short-term bridge; refi at stabilization.
Rent comps 1 comps
| Address | Beds | Baths | Sqft | Rent | $/sqft | DOM | Units | Dist |
|---|---|---|---|---|---|---|---|---|
| 201 Eaton Ridge Dr Northfield, OH | 1.0–2.0 | 1.0–2.0 | 956 | $1,679 | $1.76 | 2d | 6 | 0.57mi |
Listing history 5 events
-
2026-05-22status Pending
-
2026-04-10historical Contingent
-
2026-03-27$219,900 Active
-
2026-03-17soldstatus $160,000
-
1991-11-06soldstatus $68,200
ⓘ Source: listings_history table (triggers on properties + properties_extension) + one-shot
backfill from property_details.listing_events for pre-trigger history.
Tax reassessment forecast OH · Partial reset (capped growth)
- Current annual tax
- $1,826 · $152/mo
- Projected year-2 tax
- $2,628 · $219/mo
- Expected delta
- +$802/yr (+$67/mo · 43.9%)
ⓘ Screening estimate from a state-policy table — verify with the county assessor before closing.
Climate risk First Street
- Flood 1/10 Low FEMA zone X (unshaded) · 0% chance over 30 yrs
- Wildfire 1/10 Low
- Heat 3/10 Moderate 7 d/yr ≥96°F today · 17 d/yr by 30 yrs out
- Wind 1/10 Low
- Air quality 2/10 Low 1 unhealthy d/yr today · 3 by 30 yrs out
Nearby sold comps map
Loading sold comps map…
Walkable amenities ~0.75 mi
Loading nearby amenities…
Taxation est. · year 1
- Rental income
- $20,148
- − Mortgage interest
- −$12,318
- − Property taxes
- −$1,826
- − Insurance
- −$1,100
- − Repairs & maintenance
- −$1,612
- − Management
- −$1,612
- − Depreciation
- −$6,397
- Taxable loss
- −$4,716
- Est. tax savings @ 24.0%
- +$1,132
- After-tax cash flow
- $285/yr
For passive investors: Depreciation is non-cash, so a rental often shows a tax loss while cash-flowing — sheltering income. Rental losses are passive: they offset passive income freely, and up to $25,000/yr can offset ordinary (W-2) income if you actively participate and your MAGI is under $100k (phasing out to $0 by $150k); unused losses carry forward. On sale, claimed depreciation is recaptured at up to 25%, and gains may owe capital-gains tax (a 1031 exchange can defer both). Figures are a year-1 estimate at your 24.0% rate — not tax advice; consult a CPA.
Schools (NCES district)
- District
- Nordonia Hills City
- NCES district ID
- 3905004
- Math proficiency
- 72% ▼ -9.00%
- Reading proficiency
- 79% ▼ -3.00%
- Median HH income
- $74,658
- Composite
- 66.26/100
- National rank
- #428
- State rank
- #71 of 656 in OH
Livability — Northfield
- Score
- 79/100
- State rank
- #143
- US rank
- #2208
Category grades
Schools grade is shown separately in the Schools card above.
Census & demographics
- Census place
- Northfield, OH
- County
- Summit · 539,389 people
- Metro
- Akron, OH
- Population (ZIP)
- 19,917
- Household income
- $89,082
- Rent vs Own
- Severe rent burden
- 13.4
Population outlook (Summit County) Hauer SSP2
- Today (2025)
- 546,583 people
- By 2030
- 544,028 · -0.5%
- By 2040
- 531,363 · -2.8%
- By 2050
- 514,923 · -5.8%
- By 2075
- 481,765 · -11.9%
- By 2100
- 432,265 · -20.9%
Race, ethnicity, and origin ACS 2023
- Neighborhood character
- Predominantly White (85%)
- Race & ethnicity
- White 85% Black 6% Two or more races 4% Asian 3% Hispanic / Latino 2%
- Common ancestry
- Romanian 14% Slovak 3% Lithuanian 1%
- Foreign-born
- 6% · Canada, China
- Languages at home
- 94% English-only · Other Indo-European 2% Chinese 1% Spanish 1%
Political lean MEDSL · Summit
- 2024 margin
- Lean D (+7.0) · D 53.0% · R 46.0%
- 2008→2024 swing
- -9.6pp toward R · 2008: 16.6pp · 2024: 7.0pp
- All cycles
- 2024: D+7.0 2020: D+9.6 2016: D+8.2 2012: D+14.8 2008: D+16.6
Not yet ingested
- Civics
- —
Market trends
- HPI YoY
- ▼ -112.75%
- Current HPI
- 198.7729
- Rent YoY
- —
- Metro
- —
- State GDP YoY
- ▲ 1.98%
- F500 in state
- 48
Industry mix (Fortune 500 HQ in OH)
| Industry | F500 HQs | Revenue |
|---|---|---|
| Insurance | 3 | $145B |
|
||
| Industrial Machinery | 3 | $49B |
|
||
| Financial Services | 3 | $24B |
|
||
| Consumer Goods | 2 | $93B |
|
||
| Aerospace / Defense | 2 | $47B |
|
||
| Utilities | 2 | $33B |
|
||
Price history
+222.4% since first listed5 events — show timeline
- 2026-05-22 Pending — MLSNOW
- 2026-04-10 Contingent — MLSNOW
- 2026-03-27 Listed $219,900 MLSNOW
- 2026-03-17 Sold (Public Records) $160,000 Public Records
- 1991-11-06 Sold (Public Records) $68,200 Public Records
Property tax history
+2.6%/yrLatest (2025): $1,826 · +8.9% YoY. Source: county tax records.
Cash-flow waterfall
monthlySold comps — $/sqft
last 12 mo · ≤1 miLoading sold comps…