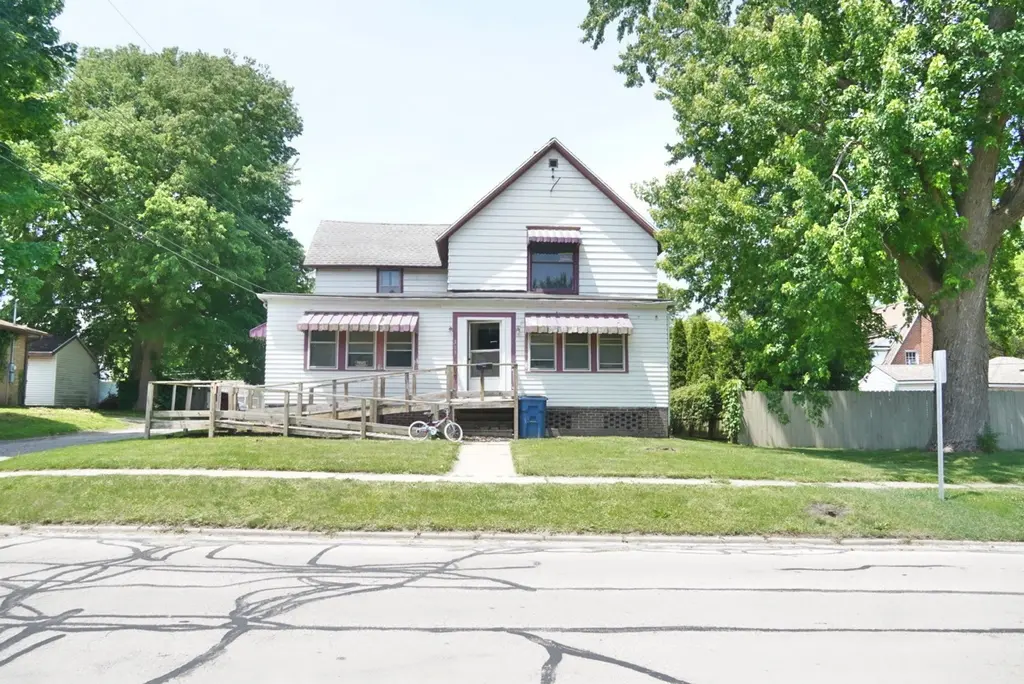
313 N 5th St · Watseka, IL
Flood risk 1/10 · Minimal
- FEMA flood zone
- AE
- Chance of flooding over 30 yrs
- 0.0%
- Est. flood insurance / yr
- $2,026 – $9,024
Fire risk 3/10 · Minor
- Est. fire insurance / yr
- $804 – $1,492
Heat risk 3/10 · Minor
- Hot days now (above 103°F)
- 7 days/yr
- Hot days in 30 yrs
- 17 days/yr
Wind risk 2/10 · Minimal
- Chance of severe wind over 30 yrs
- 1.0%
Air-quality risk 2/10 · Minimal
- Unhealthy air days now
- 1 days/yr
- Unhealthy air days in 30 yrs
- 1 days/yr
Risk factors via First Street. Map © Google.
Why this score? — see what drove the B grade
The composite is a weighted blend of 9 inputs, each scored 0–100. Each bar is that input's sub-score; the figure is the points it added to the 100-point composite (weight × sub-score).
- Cash flow +30.0/30.0
- 1% rule +10.0/10.0
- DSCR +10.0/10.0
- ARV discount +7.5/15.0
- Appreciation +5.7/10.0
- Livability +3.2/5.0
- Rent growth +2.5/5.0
- Condition / age +2.5/5.0
- Schools +2.2/10.0
$34,999
🖨 Deal sheet 📄 Offer letter ✓ Due diligence
Listing remarks MLS
2 enclosed front porches, back porch, and back porch entry. Franklin stove in the living room. Features original to the home include a breakfront w/ pass throught in the dining room, built-in wardrobe in the den, french doors, oak staircase, woodwork, hardwood floors iron register covers. Furnace is 6 years old.
Key facts
- 7,405 sq ft lot
- 2 garage spots
- Built 1900
Property features AI
Finance
- Other: Living area source: assessor; Parcel number available
- HOA & community: No master association fees required
Exterior
- Parking: Detached garage; 2 garage spaces; Total parking for 4 vehicles
- Utilities: Public water; Public sewer
- Home design: Detached single-family home; 2-story; Owned as fee simple; Built over 100 years ago; Vinyl siding; Built before 1978
- Construction: Vinyl siding exterior
- Exterior features: 50 x 150 lot; Lot smaller than 0.25 acre
Interior
- Kitchen: Kitchen on main level (16 x 20)
- Bedrooms: 4 bedrooms; Master bedroom on main level (14 x 12); Three additional bedrooms on second level (14 x 15; 14 x 14; 15 x 15)
- Bathrooms: 1 full bath; 1 half bath
- Heating & cooling: Natural gas heating
- Interior features: 8 total rooms; Unfinished full basement; Disability access available; Flood zone
- Laundry & utility: Laundry room
Neighborhood map
What this means for you Summary
Snapshot
- This is a 4-bed/1.5-bath single-family listed at $35k.
Deal economics
- At list price, monthly cash flow is $388 ($5k/yr) — positive.
- The deal already cash-flows at list — no discount required.
- Meets the 1% rule at list price ($1k rent vs $35k).
- Cap rate 35.4% vs local median 3.5% in Watseka — top-decile yield for the area; either an underpriced asset or a hidden risk that comps aren't pricing in. Stress-test before assuming the spread holds.
Location & tenants
- Location reads 63/100 on livability (#811 in IL) — a middle-class / working-renter tenant base. Strengths: cost of living A+, housing A+, crime B+; Watch: schools D, amenities F, commute F.
- Iroquois County CUSD 9 (rural): math 18% / reading 35% proficiency, ranked #316 of 620 in IL (top 51%) — low school quality limits family demand, transient renter base, plan for 1-2y turnover.
- Market conditions: 39 active listings in the ZIP; 14 units permitted in Iroquois County in 2024 (0 in 5+ unit buildings).
Forward outlook
- In year one you build about $707 of equity ($242 loan paydown + $465 appreciation (1.3% local appreciation)).
- Iroquois County population projected at -20% by 2050 — secular population decline; favor cash flow + early exit over multi-decade hold.
- At projected returns (1.3% appreciation + 3.0% rent growth), your $10k cash investment doubles in ~2 years — after that, you're playing with house money.
Negotiation context
- Only 10 days on market — expect competitive offers; lowballing is unlikely to land.
- 2 sale attempts since 20y ago with the ask held roughly flat each time — persistent listings suggest the price (not the market) is what's stuck; bring a comps-based counter.
Risks & watch-outs
- Watch-outs: flood insurance adds $460/mo; built in 1900 — expect roof / HVAC / electrical / plumbing capex.
- Climate carrying-cost: in FEMA flood zone AE (mandatory federal flood insurance) — expect insurance premiums to compound above CPI over the hold.
Questions for the listing agent
- Built in 1900 — when were the roof, HVAC, electrical panel, plumbing, and water heater last replaced?
- What's the actual annual flood-insurance premium (NFIP or private), and is the property in a SFHA with mandatory coverage?
- Is there a deadline driving the sale (1031 exchange, divorce, estate, relocation)? That informs how much negotiation room exists.
- Schools are D-rated, which usually means shorter tenancies and higher turnover. Who's the typical renter profile here, and what's been the actual vacancy rate?
- What's the average days-on-market for RENTAL listings here right now (not sales)? A rising rental-DOM trend means longer vacancies and softer asking-rent achievability than the comps imply.
- What's the recent tenant-quality profile in this submarket — average credit score on applications, eviction rate, late-payment / NSF rate, and stable-employment percentage? A property-management company in the area should have these aggregated.
- How much new for-sale + rental construction is in the pipeline within 1–3 miles? Heavy new supply typically softens prices + rents 12–24 months out; constrained supply supports both.
Investment metrics
- 1% rule
- 3.86% ✓
- Cap rate
- 35.40%
- Cash-on-cash
- 103.94%
- DSCR
- 5.62
- GRM
- 2.2
CMA / ARV
- ARV (on-the-fly)
- $202,950
- Comps found
- 12
Show comp detail 12 sales within ~0.75 mi
| Address | Dist | Beds/Ba | Sqft | Sold | Price | $/sf | Match |
|---|---|---|---|---|---|---|---|
| 551 N 6th St | 0.23mi | 4/2.5 | 1,960 (-4%) | 14mo | $150,000 | $77 | 66 |
| 460 S Ralph St | 0.59mi | 3/2.0 (-1) | 2,014 (-2%) | 1mo | $169,000 | $84 | 62 |
| 319 S 3rd St | 0.42mi | 4/2.0 | 1,904 (-7%) | 9mo | $189,900 | $100 | 59 |
| 426 E Locust St | 0.35mi | 3/2.0 (-1) | 1,911 (-7%) | 11mo | $190,000 | $99 | 56 |
| 109 W Oak St | 0.24mi | 4/1.0 | 1,809 (-12%) | 21mo | $30,000 | $17 | 50 |
| 704 E Ash St | 0.47mi | 3/2.0 (-1) | 1,820 (-11%) | 7mo | $149,950 | $82 | 47 |
| 447 S Ralph St | 0.56mi | 3/1.5 (-1) | 1,774 (-14%) | 3mo | $189,500 | $107 | 44 |
| 704 E Sycamore St | 0.48mi | 3/1.0 (-1) | 1,795 (-12%) | 10mo | $125,000 | $70 | 42 |
| 550 E Mulberry St | 0.48mi | 3/2.0 (-1) | 1,824 (-11%) | 14mo | $190,500 | $104 | 41 |
| 911 E Locust St | 0.73mi | 4/2.0 | 1,754 (-14%) | 2mo | $175,000 | $100 | 38 |
| 422 S 6th St | 0.48mi | 3/2.0 (-1) | 1,859 (-9%) | 22mo | $188,000 | $101 | 37 |
| 321 E Jefferson Ave | 0.70mi | 3/1.5 (-1) | 2,163 (+6%) | 21mo | $69,000 | $32 | 36 |
Match score weights: distance 35% · size 25% · config 20% · recency 20%. Top-matched comps best support the ARV.
Projected returns pro-forma
1.33% appreciation · 3.0% rent growth · sell at horizon
- IRR
- 51.0%
- Equity multiple
- 3.68×
- Total profit
- $26,249
- Equity at exit
- $12,553
- IRR
- 52.4%
- Equity multiple
- 7.45×
- Total profit
- $63,165
- Equity at exit
- $17,160
Cash invested: $9,800 (down + closing). Projections, not guarantees.
Landlord ↔ Tenant lean methodology
- Overall (STATE)
- 43 Moderately Tenant-Leaning
- State Illinois
- 43 Moderately Tenant-Leaning · D+7
- County
- — inherits STATE
- City
- — inherits STATE
ZIP-level market 60970
- Home prices YoY
- 0.9%
- Active inventory
- 39
- Price-to-rent
- 2.2×
Monthly cashflow live
- Estimated rent
- $1,351 medium interval (Pro) →
- Mortgage (P&I)
- −$184
- Tax from tax record
- −$20 /mo · $242/yr
- Insurance
- −$15
- Flood insurance flood zone
- −$460 /mo · $5,525/yr
- HOA
- −$0
- Vacancy / Maint / Mgmt
- −$284
- Net cashflow
- $388
Break-even live
UW: 25.0% down · 7.5% · 30yr · 1.5% tax · 5.0% vac · 8.0% maint · 8.0% mgmt
Financing live
Cash to close
- Down payment
- $8,750
- Closing costs
- $1,050
- Reserves months
- —
- Total cash needed
- —
Loan-product check · same deal, 3 products live
Conventional
25% down · 7.5% · 30yr
- Down + closing
- —
- Monthly P&I
- —
- Monthly cashflow
- —
- DSCR
- —
- Eligible?
- —
Personal DTI + credit; lowest rate.
DSCR
20% down · 8.5% · 30yr
- Down + closing
- —
- Monthly P&I
- —
- Monthly cashflow
- —
- DSCR
- —
- Eligible?
- —
No personal income docs; deal must DSCR.
Hard money
10% down · 12.0% · 12mo
- Down + closing
- —
- Monthly P&I
- —
- Monthly cashflow
- —
- DSCR
- —
- Eligible?
- —
Short-term bridge; refi at stabilization.
Listing history 11 events
-
2026-06-07statusdays on market $34,999 Pending 10 DOM
-
2026-06-03days on market $34,999 Active 8 DOM
-
2026-06-02days on market $34,999 Active 7 DOM
-
2026-06-01days on market $34,999 Active 6 DOM
-
2026-05-31days on market $34,999 Active 5 DOM
-
2026-05-30days on market $34,999 Active 4 DOM
-
2026-05-26$34,999 Active
-
2006-10-30soldstatus $43,500 313-char remark
Show marketing remark (313 chars)
2 enclosed front porches, back porch, and back porch entry. Franklin stove in the living room. Features original to the home include a breakfront w/ pass throught in the dining room, built-in wardrobe in the den, french doors, oak staircase, woodwork, hardwood floors iron register covers. Furnace is 6 years old.
-
2006-10-11historical 313-char remark
Show marketing remark (313 chars)
2 enclosed front porches, back porch, and back porch entry. Franklin stove in the living room. Features original to the home include a breakfront w/ pass throught in the dining room, built-in wardrobe in the den, french doors, oak staircase, woodwork, hardwood floors iron register covers. Furnace is 6 years old.
-
2006-10-01soldstatus $43,500
-
2006-09-19$49,900 313-char remark
Show marketing remark (313 chars)
2 enclosed front porches, back porch, and back porch entry. Franklin stove in the living room. Features original to the home include a breakfront w/ pass throught in the dining room, built-in wardrobe in the den, french doors, oak staircase, woodwork, hardwood floors iron register covers. Furnace is 6 years old.
ⓘ Source: listings_history table (triggers on properties + properties_extension) + one-shot
backfill from property_details.listing_events for pre-trigger history.
Tax reassessment forecast IL · Partial reset (capped growth)
- Current annual tax
- $242 · $20/mo
- Projected year-2 tax
- $518 · $43/mo
- Expected delta
- +$276/yr (+$23/mo · 114.2%)
ⓘ Screening estimate from a state-policy table — verify with the county assessor before closing.
Climate risk First Street
- Flood 1/10 Low FEMA zone AE · 0% chance over 30 yrs
- Wildfire 3/10 Moderate
- Heat 3/10 Moderate 7 d/yr ≥103°F today · 17 d/yr by 30 yrs out
- Wind 2/10 Low 100% chance of damaging wind over 30 yrs
- Air quality 2/10 Low 1 unhealthy d/yr today · 1 by 30 yrs out
Nearby sold comps map
Loading sold comps map…
Walkable amenities ~0.75 mi
Loading nearby amenities…
Taxation est. · year 1
- Rental income
- $16,209
- − Mortgage interest
- −$1,960
- − Property taxes
- −$242
- − Insurance
- −$5,700
- − Repairs & maintenance
- −$1,297
- − Management
- −$1,297
- − Depreciation
- −$1,018
- Taxable income
- $4,695
- Est. tax owed @ 24.0%
- −$1,127
- After-tax cash flow
- $3,534/yr
For passive investors: Depreciation is non-cash, so a rental often shows a tax loss while cash-flowing — sheltering income. Rental losses are passive: they offset passive income freely, and up to $25,000/yr can offset ordinary (W-2) income if you actively participate and your MAGI is under $100k (phasing out to $0 by $150k); unused losses carry forward. On sale, claimed depreciation is recaptured at up to 25%, and gains may owe capital-gains tax (a 1031 exchange can defer both). Figures are a year-1 estimate at your 24.0% rate — not tax advice; consult a CPA.
Schools (NCES district)
- District
- Iroquois County CUSD 9
- NCES district ID
- 1720170
- Math proficiency
- 18% ▼ -12.00%
- Reading proficiency
- 35% ▼ -8.00%
- Median HH income
- $38,590
- Composite
- 22.14/100
- National rank
- #8171
- State rank
- #316 of 620 in IL
Livability — Watseka
- Score
- 63/100
- State rank
- #811
- US rank
- #15998
Category grades
Schools grade is shown separately in the Schools card above.
Census & demographics
- Census place
- Watseka, IL
- Population (ZIP)
- 5,965
Population outlook (Iroquois County) Hauer SSP2
- Today (2025)
- 26,826 people
- By 2030
- 25,771 · -3.9%
- By 2040
- 23,589 · -12.1%
- By 2050
- 21,523 · -19.8%
- By 2075
- 17,998 · -32.9%
- By 2100
- 14,979 · -44.2%
Race, ethnicity, and origin ACS 2023
- Neighborhood character
- Predominantly White (88%)
- Race & ethnicity
- White 88% Two or more races 5% Hispanic / Latino 5% Asian 1%
- Common ancestry
- Lithuanian 6% Iranian 3% Romanian 3%
- Foreign-born
- 3% · Canada
- Languages at home
- 96% English-only · Spanish 2% Tagalog/Filipino 1%
Political lean MEDSL · Iroquois
- 2024 margin
- Solid R (+57.3) · D 20.6% · R 78.0% · Other 1.4%
- 2008→2024 swing
- -27.5pp toward R · 2008: -29.8pp · 2024: -57.3pp
- All cycles
- 2024: R+57.3 2020: R+56.7 2016: R+56.0 2012: R+44.7 2008: R+29.8
Not yet ingested
- Civics
- —
Market trends
- HPI YoY
- ▲ 1.33%
- Current HPI
- 156.8
- Rent YoY
- —
- Metro
- —
- State GDP YoY
- ▲ 1.59%
- F500 in state
- 60
Industry mix (Fortune 500 HQ in IL)
| Industry | F500 HQs | Revenue |
|---|---|---|
| Insurance | 4 | $201B |
|
||
| Consumer Goods | 4 | $87B |
|
||
| Industrial Machinery | 3 | $64B |
|
||
| Healthcare | 2 | $55B |
|
||
| Retail / Pharmacy | 1 | $148B |
|
||
| Agriculture / Food | 1 | $86B |
|
||
Price history
-29.9% since first listed5 events — show timeline
- 2026-05-26 Listed $34,999 MRED as Distributed by MLS Grid
- 2006-10-30 Sold (MLS) $43,500 MRED as Distributed by MLS Grid
- 2006-10-11 Listing Removed — MRED as Distributed by MLS Grid
- 2006-10-01 Sold (Public Records) $43,500 Public Records
- 2006-09-19 Listed $49,900 MRED as Distributed by MLS Grid
Property tax history
-10.7%/yrLatest (2024): $242 · -3.8% YoY. Source: county tax records.
Cash-flow waterfall
monthlySold comps — $/sqft
last 12 mo · ≤1 miLoading sold comps…