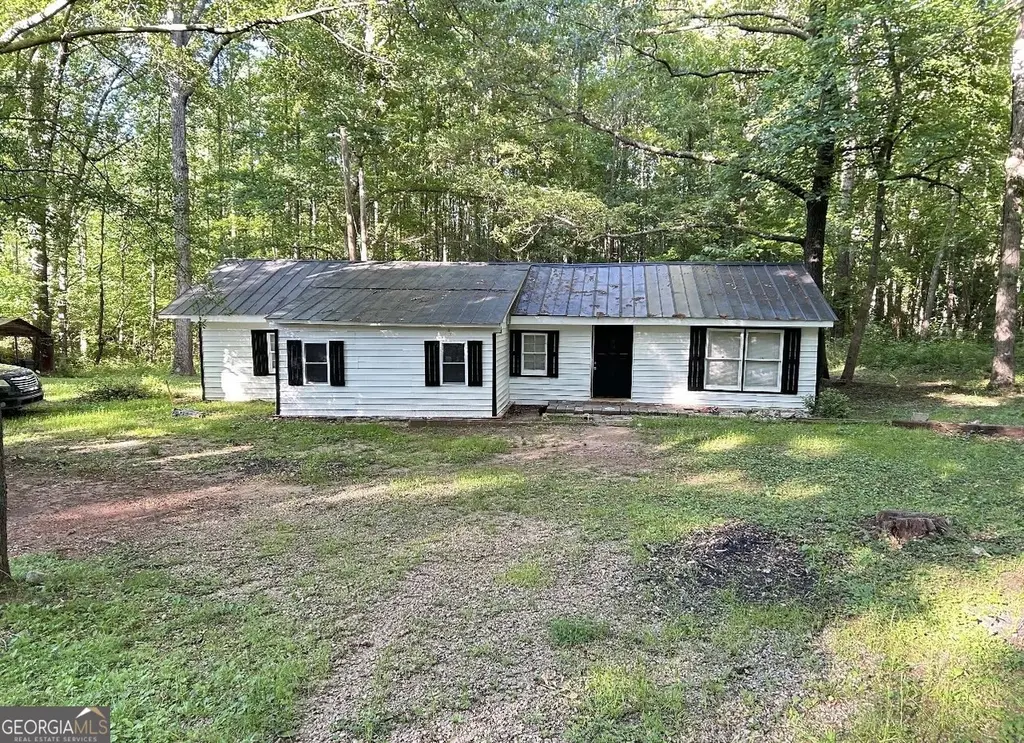
111 Kathy Ln · East Griffin, GA
Flood risk 6/10 · Moderate
- FEMA flood zone
- X (unshaded)
- Chance of flooding over 30 yrs
- 0.95%
- Est. flood insurance / yr
- $507 – $1,088
Fire risk 4/10 · Minor
- Est. fire insurance / yr
- $963 – $1,789
Heat risk 6/10 · Moderate
- Hot days now (above 106°F)
- 7 days/yr
- Hot days in 30 yrs
- 16 days/yr
Wind risk 6/10 · Moderate
- Chance of severe wind over 30 yrs
- 38.0%
Air-quality risk 3/10 · Minor
- Unhealthy air days now
- 4 days/yr
- Unhealthy air days in 30 yrs
- 4 days/yr
Risk factors via First Street. Map © Google.
Why this score? — see what drove the B- grade
The composite is a weighted blend of 9 inputs, each scored 0–100. Each bar is that input's sub-score; the figure is the points it added to the 100-point composite (weight × sub-score).
- Cash flow +30.0/30.0
- DSCR +10.0/10.0
- 1% rule +9.7/10.0
- ARV discount +7.5/15.0
- Rent growth +2.9/5.0
- Livability +2.8/5.0
- Condition / age +2.5/5.0
- Schools +1.4/10.0
- Appreciation +0.0/10.0
$79,900
🖨 Deal sheet (PDF) 📄 Offer letter ✓ Due diligence
Listing remarks
Priced to sell! this manufactured home 4 bedrooms 1 bath on 2 private acres is a rare opportunity for buyers looking to add value and build equity. The home has some updates and it is surrounded by natural trees and tucked away on a peaceful sloped lot, the setting offers privacy, space, and the chance to create your own retreat at an affordable price. Whether you're an investor, handyman, or buyer wanting land without the high price tag, this property delivers incredible upside. With some more updates and vision, this fixer-upper could become a charming country escape, rental property, or affordable full-time residence. Located near Highway 16 and I-75. Opportunities like this are hard t
Key facts
- Private acres
- Natural trees
- Rental property
Tags
Property features AI
Finance
- Financial info: Listing terms: Cash
- HOA & community: No HOA
Exterior
- Parking: Side/rear entrance
- Utilities: Well water; Septic tank; Electricity available; High speed internet available; Water available
- Home design: Manufactured house / manufactured single-family residence; Residential property; Built in 1991; Property listed in fixer condition
- Construction: 1991 construction; Concrete and vinyl siding; Metal roof; Crawl space foundation
- Exterior features: Private, sloped lot (2 acres); Metal roof; Concrete and vinyl siding construction
Interior
- Kitchen: Refrigerator included
- Bedrooms: 4 bedrooms on the main level
- Flooring: Vinyl flooring; Other flooring
- Bathrooms: 1 full bathroom on the main level
- Heating & cooling: Electric heating; Other heating; Electric cooling; Window unit(s)
- Interior features: One-level living; Living area reported as 890 (public records); Crawl space basement
- Laundry & utility: Laundry features listed as 'Other'
Neighborhood map
What this means for you Summary
Snapshot
- This is a 2-bed/1.0-bath manufactured listed at $80k.
Deal economics
- At list price, monthly cash flow is $402 ($5k/yr) — positive.
- The deal already cash-flows at list — no discount required.
- Meets the 1% rule at list price ($1k rent vs $80k).
- Recommended offer: $79k (1.5% below list) — sets the bar for market timing.
- Cap rate 12.3% vs local median 4.2% in East Griffin — top-decile yield for the area; either an underpriced asset or a hidden risk that comps aren't pricing in. Stress-test before assuming the spread holds.
Location & tenants
- Location reads 55/100 on livability (#511 in GA) — a working-class tenant base; expect higher turnover. Strengths: cost of living A+, crime A, housing B; Watch: amenities F, commute F, employment F.
- Griffin-Spalding County (suburban): math 13% / reading 19% proficiency, ranked #151 of 174 in GA (top 87%) — low school quality limits family demand, transient renter base, plan for 1-2y turnover; 68% free/reduced lunch — lower-income household profile, screen leases tightly.
- Zoned schools: Jackson Road Elementary School (math 22% / reading 17%, grade F, #878 of 1,228 statewide, top 75%, 363 students, 98% FRL); Kennedy Road Middle School (math 11% / reading 20%, grade F, #392 of 470 statewide, top 84%, 477 students, 98% FRL); Spalding High School (math 11% / reading 25%, grade F, #258 of 424 statewide, top 62%, 1,252 students, 67% FRL) — zoned schools average 88% FRL vs 68% district-wide (20 pts higher); higher-poverty schools than district average — tighter screening recommended.
- Market conditions: Rents rising (+1.4%/yr); 236 active listings in the ZIP; 342 units permitted in Spalding County in 2024 (0 in 5+ unit buildings).
Forward outlook
- Local home prices are declining (-3.0%/yr); year-one equity from $552 of loan paydown is wiped out by about $2k of value loss. Plan a longer hold.
- Spalding County population projected at -15% by 2050 — secular population decline; favor cash flow + early exit over multi-decade hold.
- At projected returns (-3.0% appreciation + 1.4% rent growth), your $22k cash investment doubles in ~7 years — after that, you're playing with house money.
Negotiation context
- It's been on market 24 days — a 2% lower offer ($79k) is reasonable based on typical stale-listing flexibility.
- 3 sale attempts since 2y ago with the ask held roughly flat each time — persistent listings suggest the price (not the market) is what's stuck; bring a comps-based counter.
- Current owner paid $50k; list at $80k implies a 61% gain — meaningful room to come down on a strong offer.
Risks & watch-outs
- Climate carrying-cost: major flood risk; major wind risk, 38% chance of damaging wind over 30y; extreme-heat days projected 7→16/yr by 2055 (HVAC capex compounding) — expect insurance premiums to compound above CPI over the hold.
Questions for the listing agent
- Is there a deadline driving the sale (1031 exchange, divorce, estate, relocation)? That informs how much negotiation room exists.
- Schools are F-rated, which usually means shorter tenancies and higher turnover. Who's the typical renter profile here, and what's been the actual vacancy rate?
- What's the average days-on-market for RENTAL listings here right now (not sales)? A rising rental-DOM trend means longer vacancies and softer asking-rent achievability than the comps imply.
- What's the recent tenant-quality profile in this submarket — average credit score on applications, eviction rate, late-payment / NSF rate, and stable-employment percentage? A property-management company in the area should have these aggregated.
- How much new for-sale + rental construction is in the pipeline within 1–3 miles? Heavy new supply typically softens prices + rents 12–24 months out; constrained supply supports both.
Investment metrics
- 1% rule
- 1.47% ✓
- Cap rate
- 12.33%
- Cash-on-cash
- 21.56%
- DSCR
- 1.96
- GRM
- 5.7
CMA / ARV
No comps found within radius.
Projected returns pro-forma
-3.0% appreciation · 1.42% rent growth · sell at horizon
- IRR
- 12.4%
- Equity multiple
- 1.48×
- Total profit
- $10,814
- Equity at exit
- $11,913
- IRR
- 20.1%
- Equity multiple
- 2.57×
- Total profit
- $35,073
- Equity at exit
- $6,908
Cash invested: $22,372 (down + closing). Projections, not guarantees.
Landlord ↔ Tenant lean methodology
- Overall (STATE)
- 90 Strongly Landlord-Friendly
- State Georgia
- 90 Strongly Landlord-Friendly · R+3
- County
- — inherits STATE
- City
- — inherits STATE
ZIP-level market 30224
- Rents YoY
- 1.4%
- Active inventory
- 236
- Price-to-rent
- 5.7×
Monthly cashflow live
- Estimated rent
- $1,176 medium interval (Pro) →
- Mortgage (P&I)
- −$419
- Tax from tax record
- −$75 /mo · $897/yr
- Insurance
- −$33
- HOA
- −$0
- Vacancy / Maint / Mgmt
- −$247
- Net cashflow
- $402
Break-even live
Sensitivity live
| Price | -10% $447 | -5% $425 | +0% $402 | +5% $379 | +10% $357 |
|---|---|---|---|---|---|
| Rent | -10% $309 | -5% $355 | +0% $402 | +5% $448 | +10% $495 |
| Rate | -1.0pp $442 | -0.5pp $422 | base $402 | +0.5pp $381 | +1.0pp $360 |
UW: 25.0% down · 7.5% · 30yr · 1.5% tax · 5.0% vac · 8.0% maint · 8.0% mgmt
Financing live
Cash to close
- Down payment
- $19,975
- Closing costs
- $2,397
- Reserves months
- —
- Total cash needed
- —
Loan-product check · same deal, 3 products live
Conventional
25% down · 7.5% · 30yr
- Down + closing
- —
- Monthly P&I
- —
- Monthly cashflow
- —
- DSCR
- —
- Eligible?
- —
Personal DTI + credit; lowest rate.
DSCR
20% down · 8.5% · 30yr
- Down + closing
- —
- Monthly P&I
- —
- Monthly cashflow
- —
- DSCR
- —
- Eligible?
- —
No personal income docs; deal must DSCR.
Hard money
10% down · 12.0% · 12mo
- Down + closing
- —
- Monthly P&I
- —
- Monthly cashflow
- —
- DSCR
- —
- Eligible?
- —
Short-term bridge; refi at stabilization.
Listing history 20 events
-
2026-06-21days on market $79,900 Active 24 DOM
-
2026-06-18days on market $79,900 Active 21 DOM
-
2026-06-17days on market $79,900 Active 20 DOM
-
2026-06-16days on market $79,900 Active 19 DOM
-
2026-06-15days on market $79,900 Active 18 DOM
-
2026-06-13statusdays on market $79,900 Active 16 DOM
-
2026-06-09days on market $79,900 New 12 DOM
-
2026-06-08days on market $79,900 New 11 DOM
-
2026-06-07days on market $79,900 New 10 DOM
-
2026-06-04days on market $79,900 New 7 DOM
-
2026-06-03days on market $79,900 New 6 DOM
-
2026-06-02days on market $79,900 New 5 DOM
-
2026-06-01days on market $79,900 New 4 DOM
-
2026-05-31days on market $79,900 New 3 DOM
-
2026-05-27$79,900 New
-
2024-03-22historical
-
2024-03-08status Back On Market
-
2024-03-01status Under Contract
-
2024-02-14$215,000 New
-
2023-11-13soldstatus $49,500
ⓘ Source: listings_history table (triggers on properties + properties_extension) + one-shot
backfill from property_details.listing_events for pre-trigger history.
Tax reassessment forecast GA · Resets to sale price
- Current annual tax
- $897 · $75/mo
- Projected year-2 tax
- $897 · $75/mo
- Expected delta
- $0/yr ($0/mo · 0.0%)
ⓘ Screening estimate from a state-policy table — verify with the county assessor before closing.
Climate risk First Street
- Flood 6/10 Major FEMA zone X (unshaded) · 95% chance over 30 yrs
- Wildfire 4/10 Moderate
- Heat 6/10 Major 7 d/yr ≥106°F today · 16 d/yr by 30 yrs out
- Wind 6/10 Major 38% chance of damaging wind over 30 yrs
- Air quality 3/10 Moderate 4 unhealthy d/yr today · 4 by 30 yrs out
Nearby sold comps map
Loading sold comps map…
Walkable amenities ~0.75 mi
Loading nearby amenities…
Taxation est. · year 1
- Rental income
- $14,111
- − Mortgage interest
- −$4,476
- − Property taxes
- −$897
- − Insurance
- −$400
- − Repairs & maintenance
- −$1,129
- − Management
- −$1,129
- − Depreciation
- −$2,324
- Taxable income
- $3,757
- Est. tax owed @ 24.0%
- −$902
- After-tax cash flow
- $3,922/yr
For passive investors: Depreciation is non-cash, so a rental often shows a tax loss while cash-flowing — sheltering income. Rental losses are passive: they offset passive income freely, and up to $25,000/yr can offset ordinary (W-2) income if you actively participate and your MAGI is under $100k (phasing out to $0 by $150k); unused losses carry forward. On sale, claimed depreciation is recaptured at up to 25%, and gains may owe capital-gains tax (a 1031 exchange can defer both). Figures are a year-1 estimate at your 24.0% rate — not tax advice; consult a CPA.
Schools (NCES district)
- District
- Griffin-Spalding County
- NCES district ID
- 1302520
- Math proficiency
- 13% ▼ -13.00%
- Reading proficiency
- 19% ▼ -12.00%
- Median HH income
- $40,895
- Composite
- 13.71/100
- National rank
- #9496
- State rank
- #151 of 174 in GA
Livability — East Griffin
- Score
- 55/100
- State rank
- #511
- US rank
- #23233
Category grades
Schools grade is shown separately in the Schools card above.
Census & demographics
- County
- Spalding County · 66,676 people
- Metro
- Atlanta-Sandy Springs-Alpharetta, GA
- Population (ZIP)
- 28,414
- Household income
- $70,216
- Rent vs Own
- Severe rent burden
- 735.0
Population outlook (Spalding County) Hauer SSP2
- Today (2025)
- 63,015 people
- By 2030
- 61,689 · -2.1%
- By 2040
- 57,932 · -8.1%
- By 2050
- 53,474 · -15.1%
- By 2075
- 43,228 · -31.4%
- By 2100
- 32,290 · -48.8%
Race, ethnicity, and origin ACS 2023
- Neighborhood character
- Majority White (60%)
- Race & ethnicity
- White 60% Black 31% Two or more races 4% Hispanic / Latino 4%
- Common ancestry
- Serbian 1% Slovak 1% Portuguese 1%
- Foreign-born
- 3% · Canada
- Languages at home
- 96% English-only · Spanish 3%
Political lean MEDSL · Spalding
- 2024 margin
- R (+16.7) · D 41.4% · R 58.1%
- 2008→2024 swing
- +2.1pp toward D · 2008: -18.8pp · 2024: -16.7pp
- All cycles
- 2024: R+16.7 2020: R+20.8 2016: R+24.2 2012: R+20.0 2008: R+18.8
Not yet ingested
- Civics
- —
Market trends
- HPI YoY
- ▼ -181.83%
- Current HPI
- 232.3039
- Rent YoY
- ▲ 1.42%
- Metro
- Atlanta-Sandy Springs-Alpharetta, GA
- State GDP YoY
- ▲ 2.66%
- F500 in state
- 28
Industry mix (Fortune 500 HQ in GA)
| Industry | F500 HQs | Revenue |
|---|---|---|
| Paper / Packaging | 2 | $29B |
|
||
| Retail | 1 | $160B |
|
||
| Transportation / Logistics | 1 | $91B |
|
||
| Airlines | 1 | $62B |
|
||
| Consumer Goods | 1 | $47B |
|
||
| Utilities | 1 | $25B |
|
||
Price history
+61.4% since first listed6 events — show timeline
- 2026-05-27 Listed $79,900 GAMLS
- 2024-03-22 Listing Removed — GAMLS
- 2024-03-08 Relisted — GAMLS
- 2024-03-01 Pending — GAMLS
- 2024-02-14 Listed $215,000 GAMLS
- 2023-11-13 Sold (Public Records) $49,500 Public Records
Property tax history
+19.9%/yrLatest (2025): $897 · -1.1% YoY. Source: county tax records.
Cash-flow waterfall
monthlySold comps — $/sqft
last 12 mo · ≤1 miLoading sold comps…