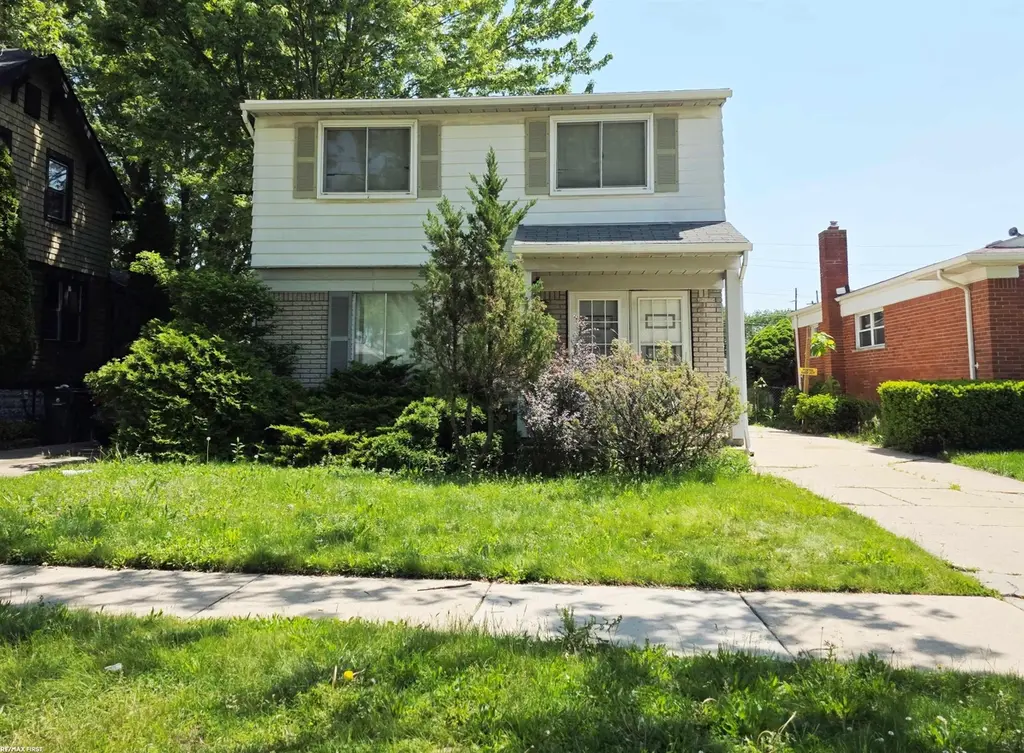
28208 Rockwood St · St. Clair Shores, MI
Flood risk 1/10 · Minimal
- FEMA flood zone
- X (unshaded)
- Chance of flooding over 30 yrs
- 0.0%
- Est. flood insurance / yr
- $473 – $860
Fire risk 1/10 · Minimal
- Est. fire insurance / yr
- $784 – $1,456
Heat risk 3/10 · Minor
- Hot days now (above 96°F)
- 7 days/yr
- Hot days in 30 yrs
- 15 days/yr
Wind risk 1/10 · Minimal
- Chance of severe wind over 30 yrs
- —
Air-quality risk 4/10 · Minor
- Unhealthy air days now
- 4 days/yr
- Unhealthy air days in 30 yrs
- 5 days/yr
Risk factors via First Street. Map © Google.
Why this score? — see what drove the C- grade
The composite is a weighted blend of 9 inputs, each scored 0–100. Each bar is that input's sub-score; the figure is the points it added to the 100-point composite (weight × sub-score).
- Cash flow +16.2/30.0
- ARV discount +15.0/15.0
- 1% rule +6.0/10.0
- DSCR +5.0/10.0
- Schools +3.6/10.0
- Rent growth +2.5/5.0
- Livability +2.5/5.0
- Condition / age +2.5/5.0
- Appreciation +0.0/10.0
$130,000
🖨 Deal sheet (PDF) 📄 Offer letter ✓ Due diligence
Listing remarks MLS
Don't miss out on this great 3 bedroom colonial in the great city of St. Clair Shores. This home has a large back yard with a 2 car attached garage. The location of this home is walking distance to Lakeview Schools. This home will need some love but has tons of potential to be great again. Better hurry before it is gone.
Key facts
- 4,792 sq ft lot
- 2 garage spots
- Built 1975
Neighborhood map
What this means for you Summary
Snapshot
- This is a 3-bed/1.5-bath single-family listed at $130k.
Deal economics
- At list price, monthly cash flow is $70 ($837/yr) — positive.
- The deal already cash-flows at list — no discount required.
- Meets the 1% rule at list price ($1k rent vs $130k).
- Cap rate 6.9% vs local median 4.0% in St. Clair Shores — top-decile yield for the area; either an underpriced asset or a hidden risk that comps aren't pricing in. Stress-test before assuming the spread holds.
Location & tenants
- Location reads: area grade C — affects rentability + tenant quality, not the cash-flow math above.
- Lakeview Public Schools (Macomb) (suburban): math 32% / reading 51% proficiency, ranked #180 of 540 in MI (top 33%) — families likely to look elsewhere, expect single-tenant / working-renter base with shorter leases.
- Zoned schools: Greenwood Elementary School (math 37% / reading 52%, grade F, #484 of 1,397 statewide, top 38%, 405 students, 55% FRL); Jefferson Middle School (math 33% / reading 52%, grade D-, #183 of 493 statewide, top 37%, 956 students, 50% FRL); Lakeview High School (math 30% / reading 64%, grade D-, #187 of 713 statewide, top 29%, 1,465 students, 42% FRL) — zoned schools average 49% FRL vs 31% district-wide (18 pts higher); higher-poverty schools than district average — tighter screening recommended.
- Market conditions: 118 active listings in the ZIP; 14 comparable units currently listed for rent nearby; rentals at typical pace (median 26d on market — plan ~3-4 weeks tenant-placement turnaround); 1,321 units permitted in Macomb County in 2024 (86 in 5+ unit buildings).
Forward outlook
- Local home prices are declining (-3.0%/yr); year-one equity from $899 of loan paydown is wiped out by about $4k of value loss. Plan a longer hold.
- Macomb County population projected at +9% by 2050 — modest demand growth; plan on rents tracking national, not racing it.
Negotiation context
- Only 0 days on market — expect competitive offers; lowballing is unlikely to land.
- 2 sale attempts since 28y ago with the ask held roughly flat each time — persistent listings suggest the price (not the market) is what's stuck; bring a comps-based counter.
- Current owner paid $109k; 19% above their basis — modest negotiation headroom, anchor on the comps not their cost.
Risks & watch-outs
- Watch-outs: property tax is 3.0% of price.
Questions for the listing agent
- Built in 1975 — when were the roof, HVAC, electrical panel, plumbing, and water heater last replaced?
- Property tax is high relative to price — has the assessment been appealed recently, and will the sale trigger a re-assessment?
- Is there a deadline driving the sale (1031 exchange, divorce, estate, relocation)? That informs how much negotiation room exists.
- What's the average days-on-market for RENTAL listings here right now (not sales)? A rising rental-DOM trend means longer vacancies and softer asking-rent achievability than the comps imply.
- What's the recent tenant-quality profile in this submarket — average credit score on applications, eviction rate, late-payment / NSF rate, and stable-employment percentage? A property-management company in the area should have these aggregated.
- How much new for-sale + rental construction is in the pipeline within 1–3 miles? Heavy new supply typically softens prices + rents 12–24 months out; constrained supply supports both.
Investment metrics
- 1% rule
- 1.10% ✓
- Cap rate
- 6.94%
- Cash-on-cash
- 2.30%
- DSCR
- 1.10
- GRM
- 7.6
CMA / ARV
- ARV (on-the-fly)
- $224,264
- Comps found
- 12
Show comp detail 12 sales within ~0.75 mi
| Address | Dist | Beds/Ba | Sqft | Sold | Price | $/sf | Match |
|---|---|---|---|---|---|---|---|
| 20312 Yale St | 0.54mi | 3/1.5 | 1,188 (+3%) | 2mo | $230,000 | $194 | 69 |
| 20905 11 Mile Rd | 0.40mi | 2/1.0 (-1) | 1,107 (-4%) | 2mo | $225,000 | $203 | 66 |
| 27825 Kaufman St | 0.56mi | 3/1.0 | 1,200 (+4%) | 1mo | $195,000 | $163 | 65 |
| 28900 Ursuline St | 0.44mi | 3/1.5 | 1,256 (+9%) | 2mo | $250,000 | $199 | 64 |
| 27540 Kaufman St | 0.53mi | 3/1.0 | 1,092 (-6%) | 1mo | $160,000 | $147 | 63 |
| 27540 KAUFMAN St | 0.53mi | 3/1.0 | 1,092 (-6%) | 1mo | $160,000 | $147 | 63 |
| 29010 Taylor St | 0.72mi | 3/1.5 | 1,143 (-1%) | 1mo | $197,000 | $172 | 63 |
| 28110 Garfield St | 0.53mi | 3/1.5 | 1,070 (-7%) | 1mo | $245,000 | $229 | 62 |
| 20119 Meier Rd | 0.23mi | 3/1.0 | 990 (-14%) | 2mo | $225,000 | $227 | 62 |
| 20848 Walton St | 0.72mi | 3/1.5 | 1,217 (+5%) | 0mo | $231,000 | $190 | 57 |
| 27750 Glenwood St | 0.62mi | 3/2.0 | 1,261 (+9%) | 0mo | $272,500 | $216 | 54 |
| 27518 Lasslett St | 0.65mi | 3/1.0 | 1,032 (-11%) | 2mo | $163,000 | $158 | 48 |
Match score weights: distance 35% · size 25% · config 20% · recency 20%. Top-matched comps best support the ARV.
Projected returns pro-forma
-3.0% appreciation · 3.0% rent growth · sell at horizon
- IRR
- -12.5%
- Equity multiple
- 0.55×
- Total profit
- $-16,499
- Equity at exit
- $19,383
- IRR
- -3.3%
- Equity multiple
- 0.78×
- Total profit
- $-8,145
- Equity at exit
- $11,240
Cash invested: $36,400 (down + closing). Projections, not guarantees.
Landlord ↔ Tenant lean methodology
- Overall (STATE)
- 62 Landlord-Friendly
- State Michigan
- 62 Landlord-Friendly · EVEN
- County
- — inherits STATE
- City
- — inherits STATE
ZIP-level market 48081
- Active inventory
- 118
- Price-to-rent
- 7.6×
Monthly cashflow live
- Estimated rent
- $1,435 high interval (Pro) →
- Mortgage (P&I)
- −$682
- Tax from tax record
- −$328 /mo · $3,933/yr
- Insurance
- −$54
- HOA
- −$0
- Vacancy / Maint / Mgmt
- −$301
- Net cashflow
- $70
Break-even live
Sensitivity live
| Price | -10% $143 | -5% $107 | +0% $70 | +5% $33 | +10% $-4 |
|---|---|---|---|---|---|
| Rent | -10% $-44 | -5% $13 | +0% $70 | +5% $126 | +10% $183 |
| Rate | -1.0pp $135 | -0.5pp $103 | base $70 | +0.5pp $36 | +1.0pp $2 |
UW: 25.0% down · 7.5% · 30yr · 1.5% tax · 5.0% vac · 8.0% maint · 8.0% mgmt
Financing live
Cash to close
- Down payment
- $32,500
- Closing costs
- $3,900
- Reserves months
- —
- Total cash needed
- —
Loan-product check · same deal, 3 products live
Conventional
25% down · 7.5% · 30yr
- Down + closing
- —
- Monthly P&I
- —
- Monthly cashflow
- —
- DSCR
- —
- Eligible?
- —
Personal DTI + credit; lowest rate.
DSCR
20% down · 8.5% · 30yr
- Down + closing
- —
- Monthly P&I
- —
- Monthly cashflow
- —
- DSCR
- —
- Eligible?
- —
No personal income docs; deal must DSCR.
Hard money
10% down · 12.0% · 12mo
- Down + closing
- —
- Monthly P&I
- —
- Monthly cashflow
- —
- DSCR
- —
- Eligible?
- —
Short-term bridge; refi at stabilization.
Rent comps 14 comps
| Address | Beds | Baths | Sqft | Rent | $/sqft | DOM | Units | Dist |
|---|---|---|---|---|---|---|---|---|
| 27881 O Neil Roseville, MI | 3.0 | 1.0 | 1300 | $1,300 | $1.00 | 0d | 1 | 0.59mi |
| 27881 O Neil Roseville, MI | 3.0 | 1.0 | 1300 | $1,300 | $1.00 | 26d | 1 | 0.59mi |
| 27547 O Neil Roseville, MI | 3.0 | 1.0 | 1014 | $1,350 | $1.33 | 6d | 1 | 0.60mi |
| 21540 Saint Gertrude St #12 Saint Clair Shores, MI | 2.0 | 1.5 | 871 | $1,200 | $1.38 | 26d | 1 | 0.72mi |
| 27067 Lawnwood St Roseville, MI | 3.0 | 1.0 | 960 | $1,500 | $1.56 | 45d | 1 | 0.79mi |
| 18635 Meier St Unit : Back Roseville, MI | 2.0 | 1.0 | 900 | $1,100 | $1.22 | 26d | 1 | 0.94mi |
| 19236 Florida St Roseville, MI | 2.0 | 1.0 | 1160 | $1,700 | $1.47 | 0d | 1 | 1.08mi |
| 26324 Harper Ave Unit 6 St Clair Shores, MI | 3.0 | 1.0 | 1100 | $1,345 | $1.22 | 26d | 1 | 1.12mi |
| 26324 Harper Unit 4 St Clair Shores, MI | 2.0 | 1.0 | 700 | $1,195 | $1.71 | 26d | 1 | 1.12mi |
| 22412 Milner St Saint Clair Shores, MI | 3.0 | 1.0 | 1060 | $2,000 | $1.89 | 3d | 1 | 1.20mi |
| 18410 Tranquil St Roseville, MI | 3.0 | 1.0 | 1140 | $1,800 | $1.58 | 16d | 1 | 1.21mi |
| 18410 Tranquil St Roseville, MI | 3.0 | 1.0 | 1140 | $1,800 | $1.58 | 45d | 1 | 1.21mi |
| 30600 Little Mack Ave Roseville, MI | 1.0–2.0 | 1.0 | 900 | $1,210 | $1.34 | 0d | 6 | 1.38mi |
| 28320 Hillview St Roseville, MI | 3.0 | 1.0 | 1224 | $1,500 | $1.23 | 1d | 1 | 1.50mi |
Listing history 6 events
-
2026-05-27status Pending 322-char remark
Show marketing remark (322 chars)
Don't miss out on this great 3 bedroom colonial in the great city of St. Clair Shores. This home has a large back yard with a 2 car attached garage. The location of this home is walking distance to Lakeview Schools. This home will need some love but has tons of potential to be great again. Better hurry before it is gone.
-
2026-05-25$130,000 Active 322-char remark
Show marketing remark (322 chars)
Don't miss out on this great 3 bedroom colonial in the great city of St. Clair Shores. This home has a large back yard with a 2 car attached garage. The location of this home is walking distance to Lakeview Schools. This home will need some love but has tons of potential to be great again. Better hurry before it is gone.
-
1999-03-20soldstatus $108,900
-
1999-01-18soldstatus $108,900
-
1998-12-03historical
-
1998-12-01$109,900
ⓘ Source: listings_history table (triggers on properties + properties_extension) + one-shot
backfill from property_details.listing_events for pre-trigger history.
Tax reassessment forecast MI · Partial reset (capped growth)
- Current annual tax
- $3,933 · $328/mo
- Projected year-2 tax
- $3,933 · $328/mo
- Expected delta
- $0/yr ($0/mo · 0.0%)
ⓘ Screening estimate from a state-policy table — verify with the county assessor before closing.
Climate risk First Street
- Flood 1/10 Low FEMA zone X (unshaded) · 0% chance over 30 yrs
- Wildfire 1/10 Low
- Heat 3/10 Moderate 7 d/yr ≥96°F today · 15 d/yr by 30 yrs out
- Wind 1/10 Low
- Air quality 4/10 Moderate 4 unhealthy d/yr today · 5 by 30 yrs out
Nearby sold comps map
Loading sold comps map…
Walkable amenities ~0.75 mi
Loading nearby amenities…
Taxation est. · year 1
- Rental income
- $17,217
- − Mortgage interest
- −$7,282
- − Property taxes
- −$3,933
- − Insurance
- −$650
- − Repairs & maintenance
- −$1,377
- − Management
- −$1,377
- − Depreciation
- −$3,782
- Taxable loss
- −$1,185
- Est. tax savings @ 24.0%
- +$284
- After-tax cash flow
- $1,122/yr
For passive investors: Depreciation is non-cash, so a rental often shows a tax loss while cash-flowing — sheltering income. Rental losses are passive: they offset passive income freely, and up to $25,000/yr can offset ordinary (W-2) income if you actively participate and your MAGI is under $100k (phasing out to $0 by $150k); unused losses carry forward. On sale, claimed depreciation is recaptured at up to 25%, and gains may owe capital-gains tax (a 1031 exchange can defer both). Figures are a year-1 estimate at your 24.0% rate — not tax advice; consult a CPA.
Schools (NCES district)
- District
- Lakeview Public Schools (Macomb)
- NCES district ID
- 2620880
- Math proficiency
- 32% ▼ -14.00%
- Reading proficiency
- 51% ▼ -4.00%
- Median HH income
- $54,411
- Composite
- 36.09/100
- National rank
- #4759
- State rank
- #180 of 540 in MI
Livability — St. Clair Shores
No livability data for this city. (Only ~50 U.S. cities are tracked.)
Census & demographics
- Census place
- St. Clair Shores, MI
- City population
- 58,217
- Population (ZIP)
- 20,254
Population outlook (Macomb County) Hauer SSP2
- Today (2025)
- 925,296 people
- By 2030
- 948,226 · +2.5%
- By 2040
- 983,961 · +6.3%
- By 2050
- 1,010,200 · +9.2%
- By 2075
- 1,076,222 · +16.3%
- By 2100
- 1,077,065 · +16.4%
Race, ethnicity, and origin ACS 2023
- Neighborhood character
- Predominantly White (92%)
- Race & ethnicity
- White 92% Two or more races 4% Black 3% Hispanic / Latino 2%
- Common ancestry
- Romanian 17% Lithuanian 6% Iranian 2%
- Foreign-born
- 3% · Canada
- Languages at home
- 96% English-only · Russian/Polish/Slavic 1% Other Indo-European 1% Other Asian/Pacific 1%
Political lean MEDSL · Macomb
- 2024 margin
- R (+13.7) · D 42.2% · R 55.9% · Other 1.9%
- 2008→2024 swing
- -22.3pp toward R · 2008: 8.6pp · 2024: -13.7pp
- All cycles
- 2024: R+13.7 2020: R+8.1 2016: R+11.6 2012: D+4.0 2008: D+8.6
Not yet ingested
- Civics
- —
Market trends
- HPI YoY
- ▼ -271.01%
- Current HPI
- 206.6455
- Rent YoY
- —
- Metro
- —
- State GDP YoY
- ▲ 1.37%
- F500 in state
- 28
Industry mix (Fortune 500 HQ in MI)
| Industry | F500 HQs | Revenue |
|---|---|---|
| Automotive Parts | 3 | $48B |
|
||
| Automotive | 2 | $372B |
|
||
| Chemicals | 1 | $45B |
|
||
| Automotive Retail | 1 | $29B |
|
||
| Healthcare / Medical Devices | 1 | $23B |
|
||
| Automotive Technology | 1 | $20B |
|
||
Price history
+18.3% since first listed6 events — show timeline
- 2026-05-27 Pending — MiRealSource-MiMLS
- 2026-05-25 Listed $130,000 MiRealSource-MiMLS
- 1999-03-20 Sold (Public Records) $108,900 Public Records
- 1999-01-18 Sold (MLS) $108,900 MiRealSource-MiMLS
- 1998-12-03 Listing Removed — MiRealSource-MiMLS
- 1998-12-01 Listed $109,900 MiRealSource-MiMLS
Property tax history
+5.7%/yrLatest (2025): $3,933 · +41.3% YoY. Source: county tax records.
Cash-flow waterfall
monthlySold comps — $/sqft
last 12 mo · ≤1 miLoading sold comps…