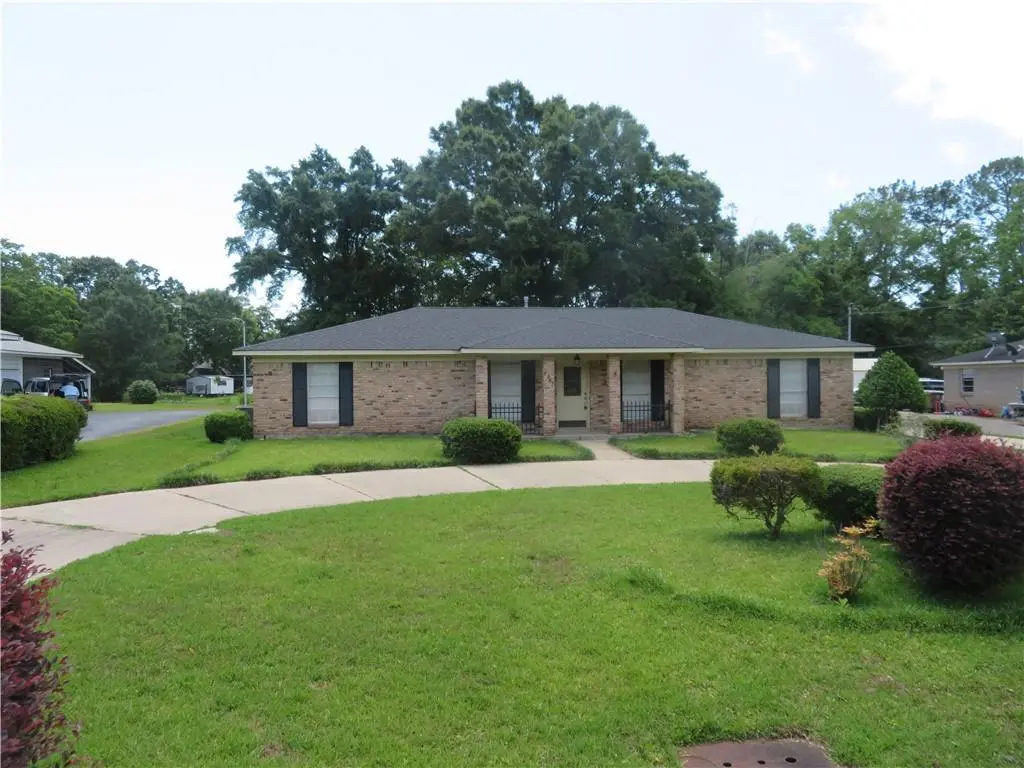
4441 Nicholl Dr · Mobile, AL
Flood risk 9/10 · Severe
- FEMA flood zone
- AE
- Chance of flooding over 30 yrs
- 0.99%
- Est. flood insurance / yr
- $1,737 – $8,500
Fire risk 3/10 · Minor
- Est. fire insurance / yr
- $916 – $1,700
Heat risk 10/10 · Severe
- Hot days now (above 105°F)
- 7 days/yr
- Hot days in 30 yrs
- 22 days/yr
Wind risk 9/10 · Severe
- Chance of severe wind over 30 yrs
- 99.0%
Air-quality risk 2/10 · Minimal
- Unhealthy air days now
- 1 days/yr
- Unhealthy air days in 30 yrs
- 1 days/yr
Risk factors via First Street. Map © Google.
Why this score? — see what drove the C+ grade
The composite is a weighted blend of 9 inputs, each scored 0–100. Each bar is that input's sub-score; the figure is the points it added to the 100-point composite (weight × sub-score).
- Cash flow +26.9/30.0
- ARV discount +10.5/15.0
- DSCR +9.3/10.0
- 1% rule +5.9/10.0
- Livability +3.8/5.0
- Rent growth +2.5/5.0
- Condition / age +2.5/5.0
- Schools +2.3/10.0
- Appreciation +0.0/10.0
$253,900
🖨 Deal sheet (PDF) 📄 Offer letter ✓ Due diligence
Listing remarks
Very nice 2160 Sq. Ft. 3/2 in Cypress Shores . Priced for quick sale . Estate property that does not require Probate Approval prior to sale. Home has split brick in several places including foyer and kitchen. Hardwood throughout except in baths and sun room where ceramic tile is in place. Separate office off kitchen , which is open to the living room. Very cozy covered patio deck with outside sink and built in benches as a surround . Two car Garage Call your realtor or the listing agent to set up an appointment for viewing,
Key facts
- Separate office
- Split brick
- Outside sink
Tags
Property features AI
Finance
- Other: Located in Cypress Shores subdivision; No land lease; Not waterfront
Exterior
- Parking: Garage faces side
- Utilities: Cable available; Electricity available (110V & 220V); Natural gas available; Public sewer; Water available
- Home design: Single-family residence; Residential property
- Construction: Brick veneer construction; Composition roof; Slab foundation
- Exterior features: No special exterior features noted; No fencing; View
Interior
- Kitchen: Dishwasher; Breakfast bar
- Bedrooms: 3 bedrooms
- Flooring: Brick flooring; Hardwood flooring
- Bathrooms: 2 full bathrooms
- Heating & cooling: Central heating; Central air; Ceiling fans
- Interior features: Gas log fireplace; Breakfast bar
Neighborhood map
What this means for you Summary
Snapshot
- This is a 3-bed/2.0-bath single-family listed at $254k.
Deal economics
- At list price, monthly cash flow is $274 ($3k/yr) — positive.
- The deal already cash-flows at list — no discount required.
- Meets the 1% rule at list price ($3k rent vs $254k).
- Recommended offer: $246k (3.0% below list) — sets the bar for market timing.
- Cap rate 9.6% vs local median 4.9% in Mobile — top-decile yield for the area; either an underpriced asset or a hidden risk that comps aren't pricing in. Stress-test before assuming the spread holds.
Location & tenants
- Location reads 75/100 on livability (#20 in AL, #4,262 nationally) — a middle-class / working-renter tenant base. Strengths: commute A+, cost of living A+, housing A+; Watch: crime F, employment D-.
- Mobile County (urban): math 15% / reading 39% proficiency, ranked #81 of 129 in AL (top 63%) — low school quality limits family demand, transient renter base, plan for 1-2y turnover; 67% free/reduced lunch — lower-income household profile, screen leases tightly.
- Zoned schools: Nan Gray Davis Elementary School (math 12% / reading 37%, grade F, #424 of 627 statewide, top 68%, 491 students, 78% FRL); Katherine H Hankins Middle School (math 7% / reading 38%, grade F, #180 of 257 statewide, top 70%, 808 students, 82% FRL); Theodore High School (math 10% / reading 12%, grade F, #247 of 305 statewide, top 81%, 1,280 students, 60% FRL).
- Market conditions: 143 active listings in the ZIP; 3 comparable units currently listed for rent nearby; rentals at typical pace (median 23d on market — plan ~3-4 weeks tenant-placement turnaround); 1,678 units permitted in Mobile County in 2024 (264 in 5+ unit buildings).
Forward outlook
- Local home prices are declining (-3.0%/yr); year-one equity from $2k of loan paydown is wiped out by about $8k of value loss. Plan a longer hold.
- Mobile County population projected to shrink 8% by 2050 — rents likely to lag national; underwrite the cash flow, not the appreciation.
Negotiation context
- It's been on market 33 days — a 3% lower offer ($246k) is reasonable based on typical stale-listing flexibility.
Risks & watch-outs
- Watch-outs: flood insurance adds $427/mo.
- Climate carrying-cost: in FEMA flood zone AE (mandatory federal flood insurance); severe wind risk, 99% chance of damaging wind over 30y; extreme-heat days projected 7→22/yr by 2055 (HVAC capex compounding) — expect insurance premiums to compound above CPI over the hold.
Questions for the listing agent
- It's been on market 33 days. Have you received any prior offers? Is the seller open to a 3% concession, seller financing, or rate buy-down credit?
- What's the actual annual flood-insurance premium (NFIP or private), and is the property in a SFHA with mandatory coverage?
- Is there a deadline driving the sale (1031 exchange, divorce, estate, relocation)? That informs how much negotiation room exists.
- Schools are D-rated, which usually means shorter tenancies and higher turnover. Who's the typical renter profile here, and what's been the actual vacancy rate?
- Crime grade is F in this area — have there been break-ins, vandalism, or insurance claims at this property in the last 3 years? What carrier currently insures it and at what premium?
- What's the average days-on-market for RENTAL listings here right now (not sales)? A rising rental-DOM trend means longer vacancies and softer asking-rent achievability than the comps imply.
- What's the recent tenant-quality profile in this submarket — average credit score on applications, eviction rate, late-payment / NSF rate, and stable-employment percentage? A property-management company in the area should have these aggregated.
- How much new for-sale + rental construction is in the pipeline within 1–3 miles? Heavy new supply typically softens prices + rents 12–24 months out; constrained supply supports both.
Investment metrics
- 1% rule
- 1.09% ✓
- Cap rate
- 9.60%
- Cash-on-cash
- 11.83%
- DSCR
- 1.53
- GRM
- 7.6
CMA / ARV
- ARV (on-the-fly)
- $272,160
- Comps found
- 10
Show comp detail 10 sales within ~0.75 mi
| Address | Dist | Beds/Ba | Sqft | Sold | Price | $/sf | Match |
|---|---|---|---|---|---|---|---|
| 3990 Point Rd | 0.06mi | 4/2.0 (+1) | 2,280 (+6%) | 9mo | $227,000 | $100 | 76 |
| 3933 Cypress Shores Dr N | 0.20mi | 3/2.0 | 1,965 (-9%) | 10mo | $232,000 | $118 | 68 |
| 3823 Higgins Rd | 0.61mi | 3/2.0 | 2,137 (-1%) | 9mo | $400,000 | $187 | 62 |
| 4087 Canal Cir E | 0.31mi | 3/2.0 | 1,848 (-14%) | 2mo | $185,000 | $100 | 60 |
| 4508 Cypress Business Park Dr | 0.58mi | 3/2.0 | 2,094 (-3%) | 10mo | $265,000 | $127 | 60 |
| 4219 Canal Dr | 0.46mi | 4/2.0 (+1) | 2,016 (-7%) | 6mo | $300,000 | $149 | 57 |
| 4715 Benson Rd | 0.47mi | 3/2.0 | 1,956 (-9%) | 18mo | $195,000 | $100 | 47 |
| 4156 Furman Dr | 0.60mi | 4/2.0 (+1) | 1,944 (-10%) | 6mo | $245,000 | $126 | 45 |
| 3815 Riviere Du Chien Rd | 0.52mi | 3/2.0 | 2,443 (+13%) | 18mo | $697,500 | $286 | 38 |
| 3876 Higgins Rd | 0.57mi | 4/2.0 (+1) | 1,846 (-14%) | 14mo | $215,000 | $116 | 33 |
Match score weights: distance 35% · size 25% · config 20% · recency 20%. Top-matched comps best support the ARV.
Projected returns pro-forma
-3.0% appreciation · 3.0% rent growth · sell at horizon
- IRR
- -9.0%
- Equity multiple
- 0.67×
- Total profit
- $-23,545
- Equity at exit
- $37,857
- IRR
- 0.5%
- Equity multiple
- 1.04×
- Total profit
- $2,552
- Equity at exit
- $21,953
Cash invested: $71,092 (down + closing). Projections, not guarantees.
Landlord ↔ Tenant lean methodology
- Overall (STATE)
- 90 Strongly Landlord-Friendly
- State Alabama
- 90 Strongly Landlord-Friendly · R+15
- County
- — inherits STATE
- City
- — inherits STATE
ZIP-level market 36619
- Home prices YoY
- -20.8%
- Active inventory
- 143
- Price-to-rent
- 7.6×
Monthly cashflow live
- Estimated rent
- $2,775 medium interval (Pro) →
- Mortgage (P&I)
- −$1,331
- Tax from tax record
- −$54 /mo · $653/yr
- Insurance
- −$106
- Flood insurance flood zone
- −$427 /mo · $5,118/yr
- HOA
- −$0
- Vacancy / Maint / Mgmt
- −$583
- Net cashflow
- $274
Break-even live
Sensitivity live
| Price | -10% $418 | -5% $346 | +0% $274 | +5% $202 | +10% $130 |
|---|---|---|---|---|---|
| Rent | -10% $55 | -5% $164 | +0% $274 | +5% $384 | +10% $493 |
| Rate | -1.0pp $402 | -0.5pp $339 | base $274 | +0.5pp $208 | +1.0pp $141 |
UW: 25.0% down · 7.5% · 30yr · 1.5% tax · 5.0% vac · 8.0% maint · 8.0% mgmt
Financing live
Cash to close
- Down payment
- $63,475
- Closing costs
- $7,617
- Reserves months
- —
- Total cash needed
- —
Loan-product check · same deal, 3 products live
Conventional
25% down · 7.5% · 30yr
- Down + closing
- —
- Monthly P&I
- —
- Monthly cashflow
- —
- DSCR
- —
- Eligible?
- —
Personal DTI + credit; lowest rate.
DSCR
20% down · 8.5% · 30yr
- Down + closing
- —
- Monthly P&I
- —
- Monthly cashflow
- —
- DSCR
- —
- Eligible?
- —
No personal income docs; deal must DSCR.
Hard money
10% down · 12.0% · 12mo
- Down + closing
- —
- Monthly P&I
- —
- Monthly cashflow
- —
- DSCR
- —
- Eligible?
- —
Short-term bridge; refi at stabilization.
Rent comps 3 comps
| Address | Beds | Baths | Sqft | Rent | $/sqft | DOM | Units | Dist |
|---|---|---|---|---|---|---|---|---|
| 3512 Shadowwood Ct Mobile, AL | 4.0 | 3.5 | 2514 | $3,295 | $1.31 | 22d | 1 | 0.77mi |
| 3813 Saint Andrews Loop N Mobile, AL | 4.0 | 2.0 | 2027 | $2,450 | $1.21 | 45d | 1 | 1.05mi |
| 3813 Saint Andrews Loop N Mobile, AL | 4.0 | 2.0 | 2027 | $2,450 | $1.21 | 22d | 1 | 1.05mi |
Listing history 19 events
-
2026-06-21days on market $253,900 Active 33 DOM
-
2026-06-18days on market $253,900 Active 30 DOM
-
2026-06-17days on market $253,900 Active 29 DOM
-
2026-06-16days on market $253,900 Active 28 DOM
-
2026-06-15days on market $253,900 Active 27 DOM
-
2026-06-14days on market $253,900 Active 25 DOM
-
2026-06-13days on market $253,900 Active 24 DOM
-
2026-06-10days on market $253,900 Active 22 DOM
-
2026-06-09days on market $253,900 Active 21 DOM
-
2026-06-08days on market $253,900 Active 20 DOM
-
2026-06-07days on market $253,900 Active 19 DOM
-
2026-06-05days on market $253,900 Active 16 DOM
-
2026-06-03days on market $253,900 Active 15 DOM
-
2026-06-03price $253,900 Active 14 DOM
-
2026-06-02days on market $260,000 Active 14 DOM
-
2026-06-01days on market $260,000 Active 13 DOM
-
2026-05-31days on market $260,000 Active 12 DOM
-
2026-05-30days on market $260,000 Active 11 DOM
-
2026-05-19$260,000 Active
ⓘ Source: listings_history table (triggers on properties + properties_extension) + one-shot
backfill from property_details.listing_events for pre-trigger history.
Tax reassessment forecast AL · Resets to sale price
- Current annual tax
- $653 · $54/mo
- Projected year-2 tax
- $1,041 · $87/mo
- Expected delta
- +$388/yr (+$32/mo · 59.4%)
ⓘ Screening estimate from a state-policy table — verify with the county assessor before closing.
Climate risk First Street
- Flood 9/10 Extreme FEMA zone AE · 99% chance over 30 yrs
- Wildfire 3/10 Moderate
- Heat 10/10 Extreme 7 d/yr ≥105°F today · 22 d/yr by 30 yrs out
- Wind 9/10 Extreme 99% chance of damaging wind over 30 yrs
- Air quality 2/10 Low 1 unhealthy d/yr today · 1 by 30 yrs out
Nearby sold comps map
Loading sold comps map…
Walkable amenities ~0.75 mi
Loading nearby amenities…
Taxation est. · year 1
- Rental income
- $33,300
- − Mortgage interest
- −$14,222
- − Property taxes
- −$653
- − Insurance
- −$6,388
- − Repairs & maintenance
- −$2,664
- − Management
- −$2,664
- − Depreciation
- −$7,386
- Taxable loss
- −$677
- Est. tax savings @ 24.0%
- +$162
- After-tax cash flow
- $3,451/yr
For passive investors: Depreciation is non-cash, so a rental often shows a tax loss while cash-flowing — sheltering income. Rental losses are passive: they offset passive income freely, and up to $25,000/yr can offset ordinary (W-2) income if you actively participate and your MAGI is under $100k (phasing out to $0 by $150k); unused losses carry forward. On sale, claimed depreciation is recaptured at up to 25%, and gains may owe capital-gains tax (a 1031 exchange can defer both). Figures are a year-1 estimate at your 24.0% rate — not tax advice; consult a CPA.
Schools (NCES district)
- District
- Mobile County
- NCES district ID
- 0102370
- Math proficiency
- 15% ▼ -28.00%
- Reading proficiency
- 39% ▬ 0.00%
- Median HH income
- $42,455
- Composite
- 22.9/100
- National rank
- #8002
- State rank
- #81 of 129 in AL
Livability — Mobile
- Score
- 75/100
- State rank
- #20
- US rank
- #4262
Category grades
Schools grade is shown separately in the Schools card above.
Census & demographics
- Census place
- Mobile, AL
- City population
- 205,729
- Population (ZIP)
- 14,550
Population outlook (Mobile County) Hauer SSP2
- Today (2025)
- 415,303 people
- By 2030
- 411,755 · -0.9%
- By 2040
- 399,670 · -3.8%
- By 2050
- 382,616 · -7.9%
- By 2075
- 337,353 · -18.8%
- By 2100
- 283,391 · -31.8%
Race, ethnicity, and origin ACS 2023
- Neighborhood character
- Predominantly White (74%)
- Race & ethnicity
- White 74% Black 11% Two or more races 6% Hispanic / Latino 6% Asian 6%
- Hispanic origin (detail)
- Mexican 2% Puerto Rican 2%
- Common ancestry
- Lithuanian 5% Romanian 1% Portuguese 1%
- Foreign-born
- 4% · Canada, Vietnam
- Languages at home
- 90% English-only · Vietnamese 5% Spanish 4% French/Haitian/Cajun 1%
Political lean MEDSL · Mobile
- 2024 margin
- R (+16.4) · D 41.3% · R 57.7%
- 2008→2024 swing
- -7.7pp toward R · 2008: -8.7pp · 2024: -16.4pp
- All cycles
- 2024: R+16.4 2020: R+11.9 2016: R+13.9 2012: R+9.3 2008: R+8.7
Not yet ingested
- Civics
- —
Market trends
- HPI YoY
- ▼ -51.67%
- Current HPI
- 197.1074
- Rent YoY
- —
- Metro
- —
- State GDP YoY
- ▲ 2.94%
- F500 in state
- 4
Industry mix (Fortune 500 HQ in AL)
| Industry | F500 HQs | Revenue |
|---|---|---|
| Financial Services | 1 | $8B |
|
||
| Healthcare | 1 | $5B |
|
||
Price history
-2.3% since first listed2 events — show timeline
- 2026-06-02 Price Changed $253,900 GCMLS AL
- 2026-05-19 Listed $260,000 GCMLS AL
Property tax history
+4.2%/yrLatest (2025): $653 · +6.9% YoY. Source: county tax records.
Cash-flow waterfall
monthlySold comps — $/sqft
last 12 mo · ≤1 miLoading sold comps…