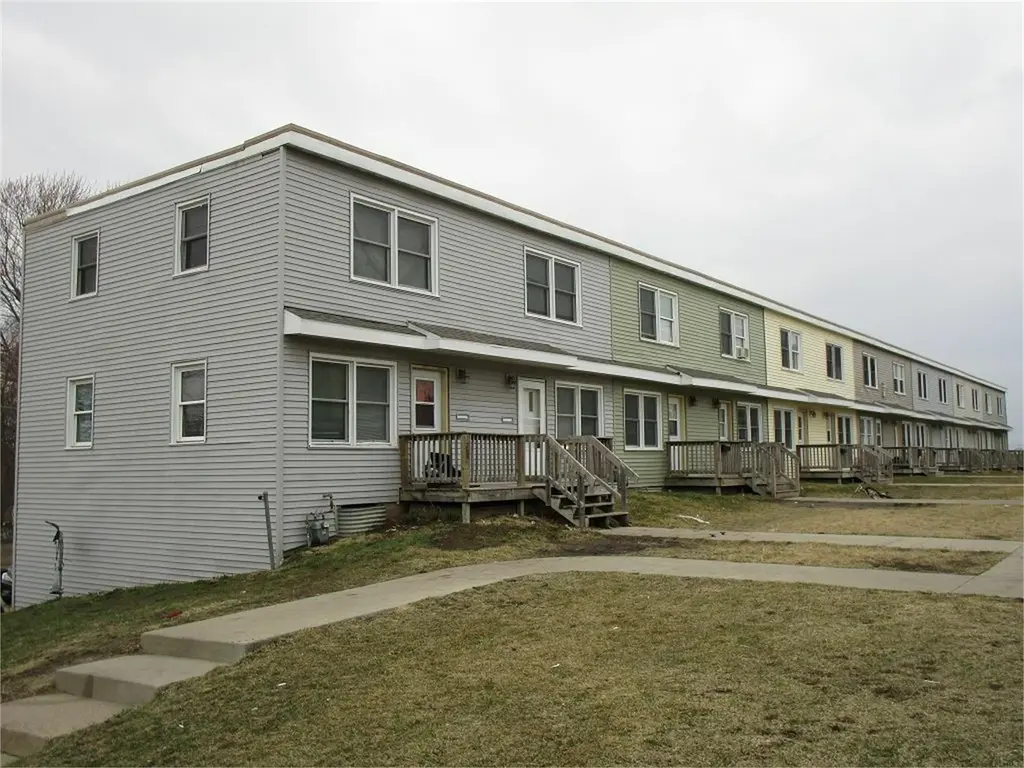
1225 W Mullan Ave · Waterloo, IA
Flood risk 1/10 · Minimal
- FEMA flood zone
- X (unshaded)
- Chance of flooding over 30 yrs
- 0.0%
- Est. flood insurance / yr
- $473 – $860
Fire risk 1/10 · Minimal
- Est. fire insurance / yr
- $902 – $1,676
Heat risk 3/10 · Minor
- Hot days now (above 101°F)
- 7 days/yr
- Hot days in 30 yrs
- 16 days/yr
Wind risk 2/10 · Minimal
- Chance of severe wind over 30 yrs
- —
Air-quality risk 1/10 · Minimal
- Unhealthy air days now
- 0 days/yr
- Unhealthy air days in 30 yrs
- 0 days/yr
Risk factors via First Street. Map © Google.
Why this score? — see what drove the B- grade
The composite is a weighted blend of 9 inputs, each scored 0–100. Each bar is that input's sub-score; the figure is the points it added to the 100-point composite (weight × sub-score).
- Cash flow +30.0/30.0
- 1% rule +10.0/10.0
- DSCR +10.0/10.0
- Schools +4.4/10.0
- Livability +4.0/5.0
- Rent growth +3.5/5.0
- ARV discount +2.9/15.0
- Condition / age +2.5/5.0
- Appreciation +0.0/10.0
$49,500
🖨 Deal sheet 📄 Offer letter ✓ Due diligence
Listing remarks MLS
Welcome to this affordable townhouse community, offering excellent investment potential. Each townhouse features a functional 2-bedroom, 1-bath layout and has a rental history ranging from $550–$650 per month per unit. A solid opportunity for investors seeking steady rental income in a practical, easy-to-maintain property or first time homebuyer.
Key facts
- Parking
- Built 1949
- Listed 184 days
Neighborhood map
What this means for you Summary
Snapshot
- This is a 2-bed/1.0-bath townhouse listed at $50k.
Deal economics
- At list price, monthly cash flow is $285 ($3k/yr) — positive.
- The deal already cash-flows at list — no discount required.
- Meets the 1% rule at list price ($794 rent vs $50k).
- Recommended offer: $44k (12.0% below list) — sets the bar for market timing.
- Cap rate 13.2% vs local median 4.2% in Waterloo — top-decile yield for the area; either an underpriced asset or a hidden risk that comps aren't pricing in. Stress-test before assuming the spread holds.
Location & tenants
- Location reads 81/100 on livability (#74 in IA, #1,589 nationally) — a professional / high-income tenant draw. Strengths: commute A+, cost of living A+, housing A+; Watch: schools C-, crime F, employment D-.
- Waterloo Community School District (urban): math 50% / reading 54% proficiency, ranked #276 of 289 in IA (top 96%) — acceptable for families but not a draw, mixed tenant base, ~2y average lease.
- Market conditions: Rents rising (+3.8%/yr); 282 active listings in the ZIP; 40 comparable units currently listed for rent nearby; rentals at typical pace (median 21d on market — plan ~3-4 weeks tenant-placement turnaround); 48% of comp listings sitting > 30 days — soft ceiling on asking rent; 287 units permitted in Black Hawk County in 2024 (67 in 5+ unit buildings).
- This rent is only 16% of the median local income ($61k/yr) — well below the 30% rent-burden line; pricing power to push rent on renewal without tenant pushback.
Forward outlook
- Local home prices are declining (-3.0%/yr); year-one equity from $342 of loan paydown is wiped out by about $1k of value loss. Plan a longer hold.
- Black Hawk County population projected at +10% by 2050 — modest demand growth; plan on rents tracking national, not racing it.
- At projected returns (-3.0% appreciation + 3.8% rent growth), your $14k cash investment doubles in ~5 years — after that, you're playing with house money.
Negotiation context
- It's been on market 185 days — a 12% lower offer ($44k) is reasonable based on typical stale-listing flexibility.
- 4 sale attempts since 2y ago with the ask held roughly flat each time — persistent listings suggest the price (not the market) is what's stuck; bring a comps-based counter.
Risks & watch-outs
- Watch-outs: built in 1949 — expect roof / HVAC / electrical / plumbing capex.
Questions for the listing agent
- It's been on market 185 days. Have you received any prior offers? Is the seller open to a 12% concession, seller financing, or rate buy-down credit?
- Built in 1949 — when were the roof, HVAC, electrical panel, plumbing, and water heater last replaced?
- Why hasn't it sold? Are there any deal-killer items the seller is aware of (foundation, flood, title, zoning, code violations)?
- Is there a deadline driving the sale (1031 exchange, divorce, estate, relocation)? That informs how much negotiation room exists.
- Crime grade is F in this area — have there been break-ins, vandalism, or insurance claims at this property in the last 3 years? What carrier currently insures it and at what premium?
- What's the average days-on-market for RENTAL listings here right now (not sales)? A rising rental-DOM trend means longer vacancies and softer asking-rent achievability than the comps imply.
- What's the recent tenant-quality profile in this submarket — average credit score on applications, eviction rate, late-payment / NSF rate, and stable-employment percentage? A property-management company in the area should have these aggregated.
- How much new for-sale + rental construction is in the pipeline within 1–3 miles? Heavy new supply typically softens prices + rents 12–24 months out; constrained supply supports both.
Investment metrics
- 1% rule
- 1.60% ✓
- Cap rate
- 13.20%
- Cash-on-cash
- 24.67%
- DSCR
- 2.10
- GRM
- 5.2
CMA / ARV
- ARV (median comp)
- $44,908
- List price
- $49,500
- Delta
- 10.23%
- Verdict
- OVERPRICED
- Comps
- 13 within 1.0 mi
Show comp detail 3 sales within ~0.75 mi
| Address | Dist | Beds/Ba | Sqft | Sold | Price | $/sf | Match |
|---|---|---|---|---|---|---|---|
| 1282 W Mullan Ave | 0.04mi | 2/1.0 | 864 (0%) | 5mo | $49,500 | $57 | 94 |
| 1280 W Mullan Ave | 0.04mi | 2/1.0 | 864 (0%) | 5mo | $49,500 | $57 | 94 |
| 426 Oaklawn Ave | 0.10mi | 2/1.0 | 952 (+10%) | 10mo | $65,000 | $68 | 70 |
Match score weights: distance 35% · size 25% · config 20% · recency 20%. Top-matched comps best support the ARV.
Projected returns pro-forma
-3.0% appreciation · 3.8% rent growth · sell at horizon
- IRR
- 19.0%
- Equity multiple
- 1.78×
- Total profit
- $10,783
- Equity at exit
- $7,381
- IRR
- 27.9%
- Equity multiple
- 3.56×
- Total profit
- $35,496
- Equity at exit
- $4,280
Cash invested: $13,860 (down + closing). Projections, not guarantees.
Landlord ↔ Tenant lean methodology
- Overall (STATE)
- 83 Strongly Landlord-Friendly
- State Iowa
- 83 Strongly Landlord-Friendly · R+6
- County
- — inherits STATE
- City
- — inherits STATE
ZIP-level market 50701
- Rents YoY
- 3.8%
- Active inventory
- 282
- Price-to-rent
- 5.2×
Monthly cashflow live
- Estimated rent
- $794 high interval (Pro) →
- Mortgage (P&I)
- −$260
- Tax from tax record
- −$62 /mo · $748/yr
- Insurance
- −$21
- HOA
- −$0
- Vacancy / Maint / Mgmt
- −$167
- Net cashflow
- $285
Break-even live
UW: 25.0% down · 7.5% · 30yr · 1.5% tax · 5.0% vac · 8.0% maint · 8.0% mgmt
Financing live
Cash to close
- Down payment
- $12,375
- Closing costs
- $1,485
- Reserves months
- —
- Total cash needed
- —
Loan-product check · same deal, 3 products live
Conventional
25% down · 7.5% · 30yr
- Down + closing
- —
- Monthly P&I
- —
- Monthly cashflow
- —
- DSCR
- —
- Eligible?
- —
Personal DTI + credit; lowest rate.
DSCR
20% down · 8.5% · 30yr
- Down + closing
- —
- Monthly P&I
- —
- Monthly cashflow
- —
- DSCR
- —
- Eligible?
- —
No personal income docs; deal must DSCR.
Hard money
10% down · 12.0% · 12mo
- Down + closing
- —
- Monthly P&I
- —
- Monthly cashflow
- —
- DSCR
- —
- Eligible?
- —
Short-term bridge; refi at stabilization.
Rent comps 40 comps
| Address | Beds | Baths | Sqft | Rent | $/sqft | DOM | Units | Dist |
|---|---|---|---|---|---|---|---|---|
| 1272 W Mullan Ave Unit 1272 Waterloo, IA | 2.0 | 1.0 | 864 | $825 | $0.95 | 21d | 1 | 0.03mi |
| 1254 W Mullan Ave Unit 1254 Waterloo, IA | 2.0 | 1.0 | 864 | $775 | $0.90 | 21d | 1 | 0.06mi |
| 209 Baltimore St Waterloo, IA | 1.0 | 1.0 | 618 | $650 | $1.05 | 44d | 1 | 0.15mi |
| 211 W Wellington St Unit 211 1/2 Wellington Waterloo, IA | 1.0 | 1.0 | 600 | $600 | $1.00 | 44d | 1 | 0.16mi |
| 313 Denver St Unit Downstairs Waterloo, IA | 2.0 | 1.5 | 950 | $695 | $0.73 | 21d | 1 | 0.32mi |
| 820 W 2nd St Apt 2 Waterloo, IA | 2.0 | 1.5 | 1100 | $695 | $0.63 | 44d | 1 | 0.33mi |
| 408 Locust St Waterloo, IA | 1.0 | 1.0 | 644 | $450 | $0.70 | 21d | 1 | 0.38mi |
| 102 1/2 South St Waterloo, IA | 1.0 | 1.0 | 668 | $550 | $0.82 | 21d | 1 | 0.40mi |
| 626 W 2nd St Unit 1 Waterloo, IA | 1.0 | 1.0 | 857 | $750 | $0.88 | 21d | 1 | 0.42mi |
| 811 W 3rd St #8 Waterloo, IA | 1.0 | 1.0 | 600 | $575 | $0.96 | 44d | 1 | 0.43mi |
| 218 South St Unit 5 Waterloo, IA | 1.0 | 1.0 | 800 | $545 | $0.68 | 44d | 1 | 0.45mi |
| W Mullan Ave Waterloo, IA | 2.0 | 1.0 | 918 | $710 | $0.77 | 44d | 2 | 0.47mi |
| 609 Wellington Ct Apt D6 Waterloo, IA | 1.0 | 1.0 | 588 | $600 | $1.02 | 21d | 1 | 0.56mi |
| 609 Wellington Ct Waterloo, IA | 1.0 | 1.0 | 567 | $600 | $1.06 | 44d | 2 | 0.56mi |
| 1524 1/2 W 5th St Unit 1524 1/2 Waterloo, IA | 2.0 | 1.0 | 981 | $850 | $0.87 | 21d | 1 | 0.58mi |
| 45 W Jefferson St Waterloo, IA | 1.0–2.0 | 1.0–2.0 | 1062 | $1,750 | $1.65 | 21d | 9 | 0.58mi |
| 21 W Jefferson St Waterloo, IA | 1.0 | 1.0 | 711 | $1,410 | $1.98 | 21d | 6 | 0.58mi |
| 136 Janney Ave Waterloo, IA | 2.0 | 2.0 | 901 | $1,325 | $1.47 | 44d | 1 | 0.59mi |
| 733 Baltimore St Waterloo, IA | 1.0 | 1.0 | 724 | $700 | $0.97 | 44d | 1 | 0.69mi |
| 706 South St Unit B Waterloo, IA | 2.0 | 1.0 | 750 | $635 | $0.85 | 21d | 1 | 0.71mi |
| 706 South St Waterloo, IA | 2.0 | 1.0 | 750 | $675 | $0.90 | 44d | 1 | 0.71mi |
| 302 Commercial St Waterloo, IA | 1.0 | 1.0 | 901 | $1,100 | $1.22 | 21d | 1 | 0.71mi |
| 1121 W 7th St Waterloo, IA | 1.0 | 1.0 | 800 | $725 | $0.91 | 44d | 1 | 0.74mi |
| 335 Cedar St Waterloo, IA | 1.0 | 1.0 | 540 | $1,510 | $2.80 | 21d | 1 | 0.80mi |
| 611 Johnson St Unit 11 Waterloo, IA | 2.0 | 1.0 | 800 | $895 | $1.12 | 44d | 1 | 0.83mi |
| 611 Johnson St Unit 8 Waterloo, IA | 2.0 | 1.0 | 800 | $825 | $1.03 | 44d | 1 | 0.83mi |
| 1008 Leavitt St Waterloo, IA | 2.0 | 1.0 | 700 | $920 | $1.31 | 21d | 1 | 0.83mi |
| 1014 Leavitt St Waterloo, IA | 2.0 | 1.0 | 700 | $1,060 | $1.51 | 21d | 2 | 0.85mi |
| 1001 1/2 Randolph St Waterloo, IA | 1.0 | 1.0 | 624 | $475 | $0.76 | 21d | 1 | 0.88mi |
| 200 Parkview Blvd Waterloo, IA | 2.0 | 1.0 | 744 | $725 | $0.97 | 21d | 1 | 0.92mi |
| 209 Parkview Blvd Waterloo, IA | 1.0 | 1.0 | 624 | $695 | $1.11 | 44d | 1 | 0.93mi |
| 225 Parkview Blvd Waterloo, IA | 1.0 | 1.0 | 624 | $650 | $1.04 | 21d | 1 | 0.94mi |
| 246 Parkview Blvd Unit 242 Waterloo, IA | 1.0 | 1.0 | 624 | $650 | $1.04 | 21d | 1 | 0.95mi |
| 254 Parkview Blvd Unit 254 Waterloo, IA | 2.0 | 1.0 | 744 | $795 | $1.07 | 44d | 1 | 0.95mi |
| 226 Palmer Dr Unit 226-B Waterloo, IA | 2.0 | 1.0 | 800 | $780 | $0.97 | 21d | 1 | 0.97mi |
| 225 Miriam Dr Unit A Waterloo, IA | 2.0 | 1.0 | 700 | $650 | $0.93 | 44d | 1 | 1.00mi |
| 237 Miriam Dr Apt B Waterloo, IA | 2.0 | 1.0 | 750 | $725 | $0.97 | 44d | 1 | 1.00mi |
| 606 Sycamore St Unit A Waterloo, IA | 1.0 | 1.0 | 622 | $875 | $1.41 | 44d | 1 | 1.09mi |
| 611 Sycamore St Unit 302 Waterloo, IA | 1.0 | 1.0 | 550 | $750 | $1.36 | 21d | 1 | 1.11mi |
| 520 Lafayette St Unit A Waterloo, IA | 2.0 | 1.0 | 800 | $750 | $0.94 | 44d | 1 | 1.13mi |
Listing history 24 events
-
2026-06-19days on market $49,500 Active 185 DOM
-
2026-06-18days on market $49,500 Active 184 DOM
-
2026-06-17days on market $49,500 Active 183 DOM
-
2026-06-16days on market $49,500 Active 182 DOM
-
2026-06-15days on market $49,500 Active 181 DOM
-
2026-06-14days on market $49,500 Active 179 DOM
-
2026-06-13days on market $49,500 Active 178 DOM
-
2026-06-10days on market $49,500 Active 176 DOM
-
2026-06-09days on market $49,500 Active 175 DOM
-
2026-06-08days on market $49,500 Active 174 DOM
-
2026-06-07days on market $49,500 Active 173 DOM
-
2026-06-05days on market $49,500 Active 170 DOM
-
2026-06-03days on market $49,500 Active 169 DOM
-
2026-06-02days on market $49,500 Active 168 DOM
-
2026-06-01days on market $49,500 Active 167 DOM
-
2026-05-31days on market $49,500 Active 166 DOM
-
2026-05-30days on market $49,500 Active 165 DOM
-
2025-12-15$49,500 Active 354-char remark
Show marketing remark (354 chars)
Welcome to this affordable townhouse community, offering excellent investment potential. Each townhouse features a functional 2-bedroom, 1-bath layout and has a rental history ranging from $550–$650 per month per unit. A solid opportunity for investors seeking steady rental income in a practical, easy-to-maintain property or first time homebuyer.
-
2025-08-03historical $650
-
2025-07-30$650
-
2025-03-27historical $650
-
2025-03-21$650
-
2024-11-10historical $650
-
2024-10-16$650
ⓘ Source: listings_history table (triggers on properties + properties_extension) + one-shot
backfill from property_details.listing_events for pre-trigger history.
Tax reassessment forecast IA · Partial reset (capped growth)
- Current annual tax
- $748 · $62/mo
- Projected year-2 tax
- $763 · $64/mo
- Expected delta
- +$15/yr (+$1/mo · 1.9%)
ⓘ Screening estimate from a state-policy table — verify with the county assessor before closing.
Climate risk First Street
- Flood 1/10 Low FEMA zone X (unshaded) · 0% chance over 30 yrs
- Wildfire 1/10 Low
- Heat 3/10 Moderate 7 d/yr ≥101°F today · 16 d/yr by 30 yrs out
- Wind 2/10 Low
- Air quality 1/10 Low 0 unhealthy d/yr today · 0 by 30 yrs out
Nearby sold comps map
Loading sold comps map…
Walkable amenities ~0.75 mi
Loading nearby amenities…
Taxation est. · year 1
- Rental income
- $9,531
- − Mortgage interest
- −$2,773
- − Property taxes
- −$748
- − Insurance
- −$248
- − Repairs & maintenance
- −$763
- − Management
- −$763
- − Depreciation
- −$1,440
- Taxable income
- $2,798
- Est. tax owed @ 24.0%
- −$672
- After-tax cash flow
- $2,748/yr
For passive investors: Depreciation is non-cash, so a rental often shows a tax loss while cash-flowing — sheltering income. Rental losses are passive: they offset passive income freely, and up to $25,000/yr can offset ordinary (W-2) income if you actively participate and your MAGI is under $100k (phasing out to $0 by $150k); unused losses carry forward. On sale, claimed depreciation is recaptured at up to 25%, and gains may owe capital-gains tax (a 1031 exchange can defer both). Figures are a year-1 estimate at your 24.0% rate — not tax advice; consult a CPA.
Schools (NCES district)
- District
- Waterloo Community School District
- NCES district ID
- 1930480
- Math proficiency
- 50% ▼ -4.00%
- Reading proficiency
- 54% ▲ 1.00%
- Median HH income
- $42,545
- Composite
- 43.72/100
- National rank
- #2950
- State rank
- #276 of 289 in IA
Livability — Waterloo
- Score
- 81/100
- State rank
- #74
- US rank
- #1589
Category grades
Schools grade is shown separately in the Schools card above.
Census & demographics
- Census place
- Waterloo, IA
- County
- Black Hawk County · 112,933 people
- City population
- 69,066
- Metro
- Waterloo-Cedar Falls, IA
- Population (ZIP)
- 30,232
- Household income
- $61,475
- Rent vs Own
- Severe rent burden
- 1377.0
Population outlook (Black Hawk County) Hauer SSP2
- Today (2025)
- 139,716 people
- By 2030
- 142,853 · +2.2%
- By 2040
- 147,843 · +5.8%
- By 2050
- 153,247 · +9.7%
- By 2075
- 167,977 · +20.2%
- By 2100
- 177,320 · +26.9%
Race, ethnicity, and origin ACS 2023
- Neighborhood character
- Predominantly White (78%)
- Race & ethnicity
- White 78% Black 11% Two or more races 5% Hispanic / Latino 3% Asian 3%
- Common ancestry
- Portuguese 3% Italian 3% American 2%
- Foreign-born
- 7% · Canada, South Korea, Vietnam
- Languages at home
- 92% English-only · Russian/Polish/Slavic 2% Spanish 2% French/Haitian/Cajun 2%
Political lean MEDSL · Black Hawk
- 2024 margin
- Toss-up / Even · D 50.0% · R 48.8% · Other 1.2%
- 2008→2024 swing
- -21.3pp toward R · 2008: 22.4pp · 2024: 1.2pp
- All cycles
- 2024: D+1.2 2020: D+9.0 2016: D+7.3 2012: D+20.0 2008: D+22.4
Not yet ingested
- Civics
- —
Market trends
- HPI YoY
- ▼ -107.19%
- Current HPI
- 162.8951
- Rent YoY
- ▲ 3.80%
- Metro
- Waterloo-Cedar Falls, IA
- State GDP YoY
- ▲ 2.48%
- F500 in state
- 4
Industry mix (Fortune 500 HQ in IA)
| Industry | F500 HQs | Revenue |
|---|---|---|
| Financial Services | 1 | $16B |
|
||
| Retail / Convenience | 1 | $15B |
|
||
Price history
7 events — show timeline
- 2025-12-15 Listed $49,500 NEIRBR as distributed by MLS GRID
- 2025-08-03 Rental Removed $650 BUILDIUM
- 2025-07-30 Listed for Rent $650 BUILDIUM
- 2025-03-27 Rental Removed $650 BUILDIUM
- 2025-03-21 Listed for Rent $650 BUILDIUM
- 2024-11-10 Rental Removed $650 BUILDIUM
- 2024-10-16 Listed for Rent $650 BUILDIUM
Property tax history
+3.2%/yrLatest (2025): $748 · +8.4% YoY. Source: county tax records.
Cash-flow waterfall
monthlySold comps — $/sqft
last 12 mo · ≤1 miLoading sold comps…