 🏷️ Likely Rental
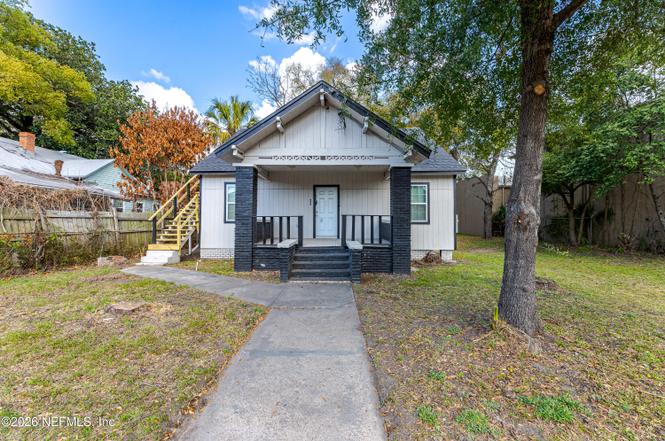
639 E 27th St · Jacksonville, FL
Flood risk 1/10 · Minimal
- FEMA flood zone
- X (unshaded)
- Chance of flooding over 30 yrs
- 0.0%
- Est. flood insurance / yr
- $507 – $1,088
Fire risk 2/10 · Minimal
- Est. fire insurance / yr
- $947 – $1,759
Heat risk 9/10 · Severe
- Hot days now (above 107°F)
- 7 days/yr
- Hot days in 30 yrs
- 20 days/yr
Wind risk 9/10 · Severe
- Chance of severe wind over 30 yrs
- 99.0%
Air-quality risk 4/10 · Minor
- Unhealthy air days now
- 6 days/yr
- Unhealthy air days in 30 yrs
- 6 days/yr
Risk factors via First Street. Map © Google.
Why this score? — see what drove the B grade
The composite is a weighted blend of 9 inputs, each scored 0–100. Each bar is that input's sub-score; the figure is the points it added to the 100-point composite (weight × sub-score).
- Cash flow +30.0/30.0
- 1% rule +10.0/10.0
- DSCR +10.0/10.0
- ARV discount +7.5/15.0
- Livability +4.2/5.0
- Schools +3.9/10.0
- Rent growth +2.7/5.0
- Condition / age +2.5/5.0
- Appreciation +0.0/10.0
$104,900
🖨 Deal sheet 📄 Offer letter ✓ Due diligence
Multi-family units
County records classify this as Multi-Family (5+ Unit). Listing-text estimate: 1 unit. estimate disagrees with records
5+ unit building — per-unit beds/baths from public records are typically unavailable; the breakdown below (if shown) is an estimate from the listing text.
Listing remarks MLS
Income producing investment opportunity. Duplex with 2bed/2 bath upstairs and 3/2 downstairs that has been converted to 4/2. Can easily change back to 3/2. Tenant occupied. Please Do not disturb tenants. Serious inquiries only. Also listed as MLS# 881322
Key facts
- Two unit
- Multi family
- Split bedroom layout
Tags
Property features AI
Exterior
- Parking: Other parking
- Utilities: Utilities listed as other
- Home design: Duplex; Frame construction
- Construction: Frame construction
- Exterior features: Lot features listed as other; Approximately 0.16-acre lot
Interior
- Bedrooms: 5 bedrooms total
- Bathrooms: 3 full bathrooms
- Heating & cooling: No central heating listed; No cooling listed
- Interior features: Multi-family use (duplex); Two total stories; Two units in the building
Neighborhood map
What this means for you Summary
Snapshot
- This is a 5-bed/2.0-bath multifamily listed at $105k.
Deal economics
- At list price, monthly cash flow is $945 ($11k/yr) — positive.
- The deal already cash-flows at list — no discount required.
- Meets the 1% rule at list price ($2k rent vs $105k).
- Recommended offer: $95k (9.0% below list) — sets the bar for market timing.
- Cap rate 17.1% vs local median 4.0% in Jacksonville — top-decile yield for the area; either an underpriced asset or a hidden risk that comps aren't pricing in. Stress-test before assuming the spread holds.
Location & tenants
- Location reads 83/100 on livability (#50 in FL, #911 nationally) — a professional / high-income tenant draw. Strengths: amenities A+, commute A+, housing A+.
- Duval (urban): math 46% / reading 45% proficiency, ranked #48 of 73 in FL (top 66%) — families likely to look elsewhere, expect single-tenant / working-renter base with shorter leases.
- Market conditions: Rents flat; 194 active listings in the ZIP; 9 comparable units currently listed for rent nearby; rentals leasing fast (median 7d on market — plan ~1-2 weeks tenant-placement turnaround); lower-income renter base — watch delinquency; 6,503 units permitted in Duval County in 2024 (1,131 in 5+ unit buildings).
- At $2,274/mo this rent would consume 70% of the median local household income ($39k/yr) (locally 1057% of renters already pay >50% of income on rent) — very limited rent-growth headroom before tenants either downsize or default.
Forward outlook
- Local home prices are declining (-3.0%/yr); year-one equity from $725 of loan paydown is wiped out by about $3k of value loss. Plan a longer hold.
- Duval County population projected at +19% by 2050 — long-run rental-demand tailwind backs the buy-and-hold thesis.
- At projected returns (-3.0% appreciation + 0.9% rent growth), your $29k cash investment doubles in ~4 years — after that, you're playing with house money.
Negotiation context
- It's been on market 107 days — a 9% lower offer ($95k) is reasonable based on typical stale-listing flexibility.
- 3 sale attempts since 9y ago; this cycle's ask has dropped $20k (16%) from the opening price — seller is motivated, your offer sets the floor, not the list.
Risks & watch-outs
- Watch-outs: property tax is 2.9% of price; built in 1920 — expect roof / HVAC / electrical / plumbing capex.
- Climate carrying-cost: severe wind risk, 99% chance of damaging wind over 30y; extreme-heat days projected 7→20/yr by 2055 (HVAC capex compounding) — expect insurance premiums to compound above CPI over the hold.
Questions for the listing agent
- It's been on market 107 days. Have you received any prior offers? Is the seller open to a 9% concession, seller financing, or rate buy-down credit?
- Built in 1920 — when were the roof, HVAC, electrical panel, plumbing, and water heater last replaced?
- Property tax is high relative to price — has the assessment been appealed recently, and will the sale trigger a re-assessment?
- Why hasn't it sold? Are there any deal-killer items the seller is aware of (foundation, flood, title, zoning, code violations)?
- Is there a deadline driving the sale (1031 exchange, divorce, estate, relocation)? That informs how much negotiation room exists.
- Schools are B-rated — typically a magnet for longer-tenancy family renters. What's the average tenant stay here, and is there a school-zone premium baked into asking?
- What's the average days-on-market for RENTAL listings here right now (not sales)? A rising rental-DOM trend means longer vacancies and softer asking-rent achievability than the comps imply.
- What's the recent tenant-quality profile in this submarket — average credit score on applications, eviction rate, late-payment / NSF rate, and stable-employment percentage? A property-management company in the area should have these aggregated.
- How much new apartment / multifamily construction is in the pipeline within 1–3 miles? Heavy new supply (>2% of stock underway) typically softens rents 12–24 months out; light construction supports rent growth.
Investment metrics
- 1% rule
- 2.17% ✓
- Cap rate
- 17.10%
- Cash-on-cash
- 38.60%
- DSCR
- 2.72
- GRM
- 3.8
CMA / ARV
- ARV (on-the-fly)
- $280,320
- Comps found
- 1
Show comp detail 1 sale within ~0.75 mi
| Address | Dist | Beds/Ba | Sqft | Sold | Price | $/sf | Match |
|---|---|---|---|---|---|---|---|
| 3303 Silver St | 0.74mi | 6/3.0 (+1) | 1,848 (+6%) | 17mo | $295,750 | $160 | 33 |
Match score weights: distance 35% · size 25% · config 20% · recency 20%. Top-matched comps best support the ARV.
Projected returns pro-forma
-3.0% appreciation · 0.94% rent growth · sell at horizon
- IRR
- 32.3%
- Equity multiple
- 2.32×
- Total profit
- $38,671
- Equity at exit
- $15,641
- IRR
- 38.1%
- Equity multiple
- 4.18×
- Total profit
- $93,432
- Equity at exit
- $9,070
Cash invested: $29,372 (down + closing). Projections, not guarantees.
Landlord ↔ Tenant lean methodology
- Overall (STATE)
- 87 Strongly Landlord-Friendly
- State Florida
- 87 Strongly Landlord-Friendly · R+3
- County
- — inherits STATE
- City
- — inherits STATE
ZIP-level market 32206
- Home prices YoY
- -23.7%
- Rents YoY
- 0.9%
- Active inventory
- 194
- Price-to-rent
- 7.4×
Monthly cashflow live
- Estimated rent
- $2,274 high interval (Pro) →
- Mortgage (P&I)
- −$550
- Tax from tax record
- −$258 /mo · $3,094/yr
- Insurance
- −$44
- HOA
- −$0
- Vacancy / Maint / Mgmt
- −$478
- Net cashflow
- $945
Break-even live
2-unit breakdown (identical units grouped — click to expand)
| Units | Beds | Baths | Est. rent |
|---|---|---|---|
| 1× unit | 3 | 1.5 | $1,187 |
| 1× unit | 2 | 1 | $1,088 |
| Total (2 units) | $2,274 | ||
UW: 25.0% down · 7.5% · 30yr · 1.5% tax · 5.0% vac · 8.0% maint · 8.0% mgmt
Financing live
Cash to close
- Down payment
- $26,225
- Closing costs
- $3,147
- Reserves months
- —
- Total cash needed
- —
Loan-product check · same deal, 3 products live
Conventional
25% down · 7.5% · 30yr
- Down + closing
- —
- Monthly P&I
- —
- Monthly cashflow
- —
- DSCR
- —
- Eligible?
- —
Personal DTI + credit; lowest rate.
DSCR
20% down · 8.5% · 30yr
- Down + closing
- —
- Monthly P&I
- —
- Monthly cashflow
- —
- DSCR
- —
- Eligible?
- —
No personal income docs; deal must DSCR.
Hard money
10% down · 12.0% · 12mo
- Down + closing
- —
- Monthly P&I
- —
- Monthly cashflow
- —
- DSCR
- —
- Eligible?
- —
Short-term bridge; refi at stabilization.
Rent comps 9 comps
| Address | Beds | Baths | Sqft | Rent | $/sqft | DOM | Units | Dist |
|---|---|---|---|---|---|---|---|---|
| 28 W 33rd St Jacksonville, FL | 4.0 | 1.0 | 1395 | $898 | $0.64 | 7d | 1 | 0.58mi |
| 421 Golfair Blvd Jacksonville, FL | 4.0 | 2.5 | 1761 | $1,381 | $0.78 | 16d | 1 | 0.87mi |
| 30 W 12th St Jacksonville, FL | 4.0 | 3.0 | 1792 | $2,580 | $1.44 | 1d | 1 | 0.92mi |
| 331 W 40th St Jacksonville, FL | 4.0 | 2.0 | 1536 | $1,375 | $0.90 | 3d | 1 | 0.96mi |
| 33 W 55th St Jacksonville, FL | 4.0 | 2.0 | 1387 | $1,321 | $0.95 | 2d | 1 | 1.31mi |
| 516 E 58th St Jacksonville, FL | 4.0 | 2.0 | 1232 | $1,725 | $1.40 | 7d | 1 | 1.37mi |
| 1445 Ionia St Jacksonville, FL | 4.0 | 2.0 | 1640 | $1,799 | $1.10 | 23d | 1 | 1.40mi |
| 1025 W 25th St Unit 1 Jacksonville, FL | 5.0 | 2.0 | 1500 | $2,000 | $1.33 | 23d | 1 | 1.48mi |
| 1029 W 25th St Unit 1 Jacksonville, FL | 5.0 | 2.0 | 1410 | $2,200 | $1.56 | 23d | 1 | 1.49mi |
Listing history 30 events
-
2026-06-18days on market $104,900 Active 107 DOM
-
2026-06-17days on market $104,900 Active 106 DOM
-
2026-06-16days on market $104,900 Active 105 DOM
-
2026-06-15days on market $104,900 Active 104 DOM
-
2026-06-10days on market $104,900 Active 98 DOM
-
2026-06-08days on market $104,900 Active 97 DOM
-
2026-06-07days on market $104,900 Active 96 DOM
-
2026-06-03remarks 646-char remark
-
2026-06-03days on market $104,900 Active 92 DOM
-
2026-06-02days on market $104,900 Active 91 DOM
-
2026-06-01days on market $104,900 Active 90 DOM
-
2026-05-31days on market $104,900 Active 89 DOM
-
2026-05-08price $104,900
-
2026-04-10price $114,900
-
2026-03-03$124,900 Active
-
2023-09-06soldstatus $160,000
-
2020-07-27soldstatus $115,000
-
2019-06-26soldstatus $22,500
-
2017-10-20price $42,000 259-char remark
Show marketing remark (183 chars)
Income producing investment opportunity near Springfield.Tenant occupied. Please do not disturb tenants. Duplex with 3/1 and 2/1. Serious inquires only. Also listed as MLS # 881320.
-
2017-10-20price $42,000 183-char remark
Show marketing remark (183 chars)
Income producing investment opportunity near Springfield.Tenant occupied. Please do not disturb tenants. Duplex with 3/1 and 2/1. Serious inquires only. Also listed as MLS # 881320.
-
2017-10-18soldstatus $35,000 Sold 183-char remark
Show marketing remark (259 chars)
Income producing investment opportunity. Duplex with 2bed/2 bath upstairs and 3/2 downstairs that has been converted to 4/2. Can easily change back to 3/2. Tenant occupied. Please Do not disturb tenants. Serious inquiries only. Also listed as MLS# 881322
-
2017-10-18soldstatus $35,000 Sold 259-char remark
Show marketing remark (259 chars)
Income producing investment opportunity. Duplex with 2bed/2 bath upstairs and 3/2 downstairs that has been converted to 4/2. Can easily change back to 3/2. Tenant occupied. Please Do not disturb tenants. Serious inquiries only. Also listed as MLS# 881322
-
2017-09-29price $65,000 259-char remark
Show marketing remark (259 chars)
Income producing investment opportunity. Duplex with 2bed/2 bath upstairs and 3/2 downstairs that has been converted to 4/2. Can easily change back to 3/2. Tenant occupied. Please Do not disturb tenants. Serious inquiries only. Also listed as MLS# 881322
-
2017-09-27price $65,000 183-char remark
Show marketing remark (183 chars)
Income producing investment opportunity near Springfield.Tenant occupied. Please do not disturb tenants. Duplex with 3/1 and 2/1. Serious inquires only. Also listed as MLS # 881320.
-
2017-06-14price $75,000 259-char remark
Show marketing remark (183 chars)
Income producing investment opportunity near Springfield.Tenant occupied. Please do not disturb tenants. Duplex with 3/1 and 2/1. Serious inquires only. Also listed as MLS # 881320.
-
2017-06-14price $75,000 183-char remark
Show marketing remark (183 chars)
Income producing investment opportunity near Springfield.Tenant occupied. Please do not disturb tenants. Duplex with 3/1 and 2/1. Serious inquires only. Also listed as MLS # 881320.
-
2017-05-10$85,000 Active 183-char remark
Show marketing remark (259 chars)
Income producing investment opportunity. Duplex with 2bed/2 bath upstairs and 3/2 downstairs that has been converted to 4/2. Can easily change back to 3/2. Tenant occupied. Please Do not disturb tenants. Serious inquiries only. Also listed as MLS# 881322
-
2017-05-10$85,000 Active 259-char remark
Show marketing remark (259 chars)
Income producing investment opportunity. Duplex with 2bed/2 bath upstairs and 3/2 downstairs that has been converted to 4/2. Can easily change back to 3/2. Tenant occupied. Please Do not disturb tenants. Serious inquiries only. Also listed as MLS# 881322
-
2002-11-06soldstatus $48,400
-
2001-07-20soldstatus $40,000
ⓘ Source: listings_history table (triggers on properties + properties_extension) + one-shot
backfill from property_details.listing_events for pre-trigger history.
Tax reassessment forecast FL · Resets to sale price
- Current annual tax
- $3,094 · $258/mo
- Projected year-2 tax
- $3,094 · $258/mo
- Expected delta
- $0/yr ($0/mo · 0.0%)
ⓘ Screening estimate from a state-policy table — verify with the county assessor before closing.
Climate risk First Street
- Flood 1/10 Low FEMA zone X (unshaded) · 0% chance over 30 yrs
- Wildfire 2/10 Low
- Heat 9/10 Extreme 7 d/yr ≥107°F today · 20 d/yr by 30 yrs out
- Wind 9/10 Extreme 99% chance of damaging wind over 30 yrs
- Air quality 4/10 Moderate 6 unhealthy d/yr today · 6 by 30 yrs out
Nearby sold comps map
Loading sold comps map…
Walkable amenities ~0.75 mi
Loading nearby amenities…
Taxation est. · year 1
- Rental income
- $27,288
- − Mortgage interest
- −$5,876
- − Property taxes
- −$3,094
- − Insurance
- −$524
- − Repairs & maintenance
- −$2,183
- − Management
- −$2,183
- − Depreciation
- −$3,052
- Taxable income
- $10,376
- Est. tax owed @ 24.0%
- −$2,490
- After-tax cash flow
- $8,848/yr
For passive investors: Depreciation is non-cash, so a rental often shows a tax loss while cash-flowing — sheltering income. Rental losses are passive: they offset passive income freely, and up to $25,000/yr can offset ordinary (W-2) income if you actively participate and your MAGI is under $100k (phasing out to $0 by $150k); unused losses carry forward. On sale, claimed depreciation is recaptured at up to 25%, and gains may owe capital-gains tax (a 1031 exchange can defer both). Figures are a year-1 estimate at your 24.0% rate — not tax advice; consult a CPA.
Schools (NCES district)
- District
- Duval
- NCES district ID
- 1200480
- Math proficiency
- 46% ▼ -11.00%
- Reading proficiency
- 45% ▼ -4.00%
- Median HH income
- $48,987
- Composite
- 38.97/100
- National rank
- #4076
- State rank
- #48 of 73 in FL
Livability — Jacksonville
- Score
- 83/100
- State rank
- #50
- US rank
- #911
Category grades
Schools grade is shown separately in the Schools card above.
Census & demographics
- Census place
- Jacksonville, FL
- County
- Duval County · 1,015,274 people
- City population
- 979,034
- Metro
- Jacksonville, FL
- Population (ZIP)
- 17,105
- Household income
- $39,242
- Rent vs Own
- Severe rent burden
- 1057.0
Population outlook (Duval County) Hauer SSP2
- Today (2025)
- 1,013,010 people
- By 2030
- 1,059,228 · +4.6%
- By 2040
- 1,141,439 · +12.7%
- By 2050
- 1,205,258 · +19.0%
- By 2075
- 1,324,282 · +30.7%
- By 2100
- 1,319,620 · +30.3%
Race, ethnicity, and origin ACS 2023
- Neighborhood character
- Predominantly Black (65%)
- Race & ethnicity
- Black 65% White 22% Two or more races 8% Hispanic / Latino 6%
- Hispanic origin (detail)
- Mexican 1% Puerto Rican 2%
- Common ancestry
- Italian 2% Romanian 1% Slovak 1%
- Foreign-born
- 5% · Canada
- Languages at home
- 93% English-only · Spanish 3% Arabic 1% German/W. Germanic 1%
Political lean MEDSL · Duval
- 2024 margin
- Toss-up / Even · D 48.7% · R 50.1% · Other 1.2%
- 2008→2024 swing
- +0.4pp no change · 2008: -1.9pp · 2024: -1.5pp
- All cycles
- 2024: R+1.5 2020: D+3.8 2016: R+1.5 2012: R+3.6 2008: R+1.9
Not yet ingested
- Civics
- —
Market trends
- HPI YoY
- ▼ -64.55%
- Current HPI
- 208.1852
- Rent YoY
- ▲ 0.94%
- Metro
- Jacksonville, FL
- State GDP YoY
- ▲ 3.28%
- F500 in state
- 36
Industry mix (Fortune 500 HQ in FL)
| Industry | F500 HQs | Revenue |
|---|---|---|
| Industrial Technology | 2 | $29B |
|
||
| Insurance | 2 | $17B |
|
||
| Retail | 1 | $60B |
|
||
| Technology Distribution | 1 | $58B |
|
||
| Homebuilding | 1 | $35B |
|
||
| Technology Manufacturing | 1 | $35B |
|
||
Price history
+162.2% since first listed18 events — show timeline
- 2026-05-08 Price Changed $104,900 realMLS
- 2026-04-10 Price Changed $114,900 realMLS
- 2026-03-03 Listed $124,900 realMLS
- 2023-09-06 Sold (Public Records) $160,000 Public Records
- 2020-07-27 Sold (Public Records) $115,000 Public Records
- 2019-06-26 Sold (Public Records) $22,500 Public Records
- 2017-10-20 Price Changed $42,000 realMLS
- 2017-10-20 Price Changed $42,000 realMLS
- 2017-10-18 Sold (MLS) $35,000 realMLS
- 2017-10-18 Sold (MLS) $35,000 realMLS
- 2017-09-29 Price Changed $65,000 realMLS
- 2017-09-27 Price Changed $65,000 realMLS
- 2017-06-14 Price Changed $75,000 realMLS
- 2017-06-14 Price Changed $75,000 realMLS
- 2017-05-10 Listed $85,000 realMLS
- 2017-05-10 Listed $85,000 realMLS
- 2002-11-06 Sold (Public Records) $48,400 Public Records
- 2001-07-20 Sold (Public Records) $40,000 Public Records
Property tax history
+15.4%/yrLatest (2025): $3,094 · +22.1% YoY. Source: county tax records.
Cash-flow waterfall
monthlySold comps — $/sqft
last 12 mo · ≤1 miLoading sold comps…