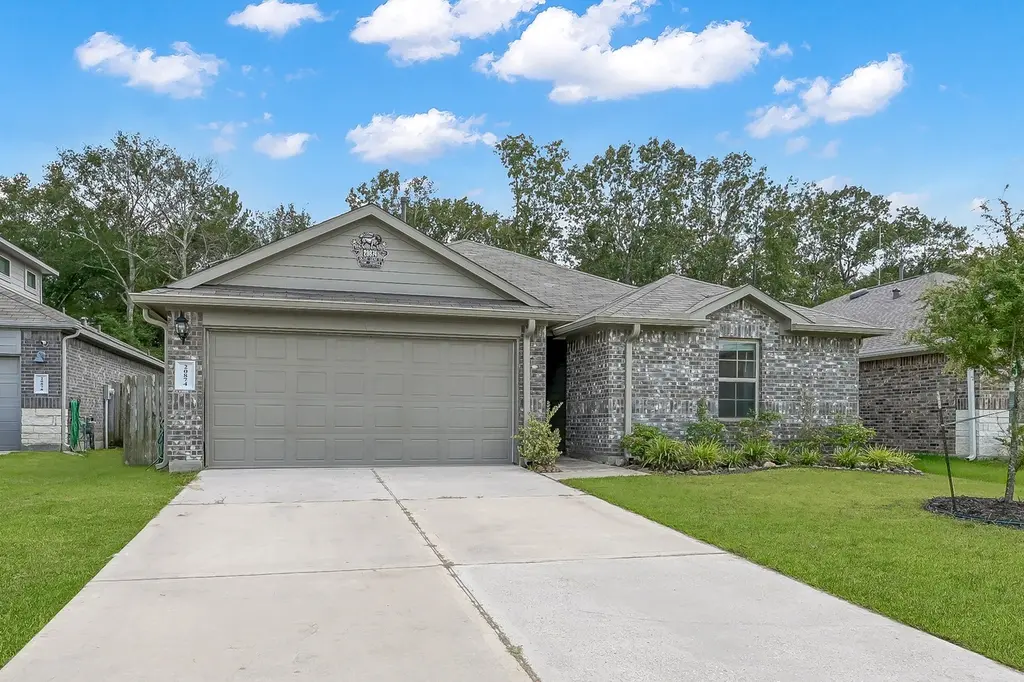
20874 Olive Leaf St · Woodbranch, TX
Flood risk 1/10 · Minimal
- FEMA flood zone
- X (unshaded)
- Chance of flooding over 30 yrs
- 0.0%
- Est. flood insurance / yr
- $507 – $1,088
Fire risk 4/10 · Minor
- Est. fire insurance / yr
- $1,222 – $2,270
Heat risk 8/10 · Major
- Hot days now (above 111°F)
- 7 days/yr
- Hot days in 30 yrs
- 24 days/yr
Wind risk 8/10 · Major
- Chance of severe wind over 30 yrs
- 99.0%
Air-quality risk 2/10 · Minimal
- Unhealthy air days now
- 2 days/yr
- Unhealthy air days in 30 yrs
- 2 days/yr
Risk factors via First Street. Map © Google.
Why this score? — see what drove the D grade
The composite is a weighted blend of 9 inputs, each scored 0–100. Each bar is that input's sub-score; the figure is the points it added to the 100-point composite (weight × sub-score).
- ARV discount +15.0/15.0
- Cash flow +7.7/30.0
- 1% rule +4.7/10.0
- Condition / age +4.0/5.0
- Livability +3.3/5.0
- Rent growth +2.6/5.0
- Schools +2.5/10.0
- DSCR +1.8/10.0
- Appreciation +0.0/10.0
$210,000
🖨 Deal sheet (PDF) 📄 Offer letter ✓ Due diligence
Listing remarks MLS
Beautiful 3-bedroom, 2-bath home located in the front section of The Canopies at Harrington Trails! Open-concept layout with spacious kitchen and breakfast bar. Energy-efficient with solar panel/battery system for low electric bills, plus a water softener. Enjoy a large backyard with currently no back neighbors and covered patio for outdoor living. Community offers 2 pools, playgrounds, trails and elementary school within walking distance.
Key facts
- Water softener
- Spacious kitchen
- Large backyard
Tags
Neighborhood map
What this means for you Summary
Snapshot
- This is a 3-bed/2.5-bath single-family listed at $210k. Condition is rated good.
Deal economics
- At list price, monthly cash flow is $-239 ($-3k/yr) — negative.
- To cash-flow at today's rent, offer at most $168k (20.1% below list).
- To meet the 1% rule (rent ≥ 1% of price), the offer needs to be $204k (3.0% below list).
- Recommended offer: $168k (20.1% below list) — sets the bar for cash-flow.
Location & tenants
- Location reads 66/100 on livability (#646 in TX) — a middle-class / working-renter tenant base. Strengths: crime A+, cost of living A+, housing A+; Watch: amenities F, commute F, health & safety F.
- Splendora ISD (rural): math 25% / reading 31% proficiency, ranked #648 of 826 in TX (top 78%) — low school quality limits family demand, transient renter base, plan for 1-2y turnover.
- Zoned schools: Piney Woods El (math 23% / reading 28%, grade F, #2,982 of 4,322 statewide, top 70%, 534 students, 55% FRL); Splendora J H (math 28% / reading 42%, grade F, #842 of 1,662 statewide, top 51%, 774 students, 62% FRL); Splendora H S (math 18% / reading 38%, grade F, #1,170 of 1,632 statewide, top 72%, 1,344 students, 59% FRL) — zoned schools at 59% FRL track the district average.
- Market conditions: Rents flat; 986 active listings in the ZIP; 2 comparable units currently listed for rent nearby; solid renter incomes; 13,259 units permitted in Montgomery County in 2024 (1,402 in 5+ unit buildings).
- This rent runs 32% of the median local income ($76k/yr) — at the standard rent-burdened threshold; future hikes will face affordability resistance.
Forward outlook
- Local home prices are declining (-3.0%/yr); year-one equity from $1k of loan paydown is wiped out by about $6k of value loss. Plan a longer hold.
- Montgomery County population projected at +65% by 2050 — long-run rental-demand tailwind backs the buy-and-hold thesis.
Negotiation context
- It's been on market 116 days — a 9% lower offer ($191k) is reasonable based on typical stale-listing flexibility.
- 2 sale attempts with the ask held roughly flat each time — persistent listings suggest the price (not the market) is what's stuck; bring a comps-based counter.
Risks & watch-outs
- Watch-outs: property tax is 3.4% of price.
- Climate carrying-cost: severe wind risk, 99% chance of damaging wind over 30y; extreme-heat days projected 7→24/yr by 2055 (HVAC capex compounding) — expect insurance premiums to compound above CPI over the hold.
Questions for the listing agent
- What do current leases actually rent for vs. the listed asking? Can we see a recent rent roll and the last 12 months of T-12 income?
- It's been on market 116 days. Have you received any prior offers? Is the seller open to a 20% concession, seller financing, or rate buy-down credit?
- Property tax is high relative to price — has the assessment been appealed recently, and will the sale trigger a re-assessment?
- What does the HOA fee cover, when was the last increase, and are there any pending special assessments or reserve-fund shortfalls?
- Why hasn't it sold? Are there any deal-killer items the seller is aware of (foundation, flood, title, zoning, code violations)?
- Is there a deadline driving the sale (1031 exchange, divorce, estate, relocation)? That informs how much negotiation room exists.
- Schools are F-rated, which usually means shorter tenancies and higher turnover. Who's the typical renter profile here, and what's been the actual vacancy rate?
- The area grade is low — what's the realistic commute time and amenity access for the typical tenant pool here? Any planned neighborhood developments (good or bad) we should know about?
- What's the average days-on-market for RENTAL listings here right now (not sales)? A rising rental-DOM trend means longer vacancies and softer asking-rent achievability than the comps imply.
- What's the recent tenant-quality profile in this submarket — average credit score on applications, eviction rate, late-payment / NSF rate, and stable-employment percentage? A property-management company in the area should have these aggregated.
- How much new for-sale + rental construction is in the pipeline within 1–3 miles? Heavy new supply typically softens prices + rents 12–24 months out; constrained supply supports both.
Investment metrics
- 1% rule
- 0.97% ✗
- Cap rate
- 4.93%
- Cash-on-cash
- -4.88%
- DSCR
- 0.78
- GRM
- 8.6
CMA / ARV
- ARV (median comp)
- $253,016
- List price
- $210,000
- Delta
- -17.00%
- Verdict
- UNDERPRICED
- Comps
- 20 within 1.0 mi
Show comp detail 12 sales within ~0.75 mi
| Address | Dist | Beds/Ba | Sqft | Sold | Price | $/sf | Match |
|---|---|---|---|---|---|---|---|
| 16229 Bergara Bend Dr | 0.21mi | 3/2.0 | 1,451 (+0%) | 1mo | $235,990 | $163 | 87 |
| 16226 Bergara Bend Dr | 0.21mi | 3/2.0 | 1,418 (-2%) | 1mo | $243,990 | $172 | 84 |
| 16218 Bergara Bend Dr | 0.21mi | 3/2.0 | 1,409 (-3%) | 1mo | $235,990 | $167 | 83 |
| 21344 Pine Mill Dr | 0.32mi | 3/2.0 | 1,412 (-2%) | 3mo | $222,000 | $157 | 76 |
| 16246 Bergara Bend Dr | 0.23mi | 3/2.0 | 1,311 (-10%) | 0mo | $231,990 | $177 | 71 |
| 16206 Bergara Bend Dr | 0.23mi | 3/2.0 | 1,311 (-10%) | 1mo | $231,990 | $177 | 70 |
| 20723 Southern Woods Dr | 0.50mi | 3/2.0 | 1,506 (+4%) | 4mo | $215,000 | $143 | 65 |
| 21307 Pine Mill Dr | 0.39mi | 3/2.0 | 1,591 (+10%) | 2mo | $225,000 | $141 | 61 |
| 16210 Bergara Bend Dr | 0.21mi | 4/2.0 (+1) | 1,656 (+14%) | 1mo | $256,990 | $155 | 59 |
| 16225 Bergara Bend Dr | 0.21mi | 4/2.0 (+1) | 1,656 (+14%) | 1mo | $260,990 | $158 | 59 |
| 14683 Canyon Pines Ln | 0.69mi | 3/2.0 | 1,534 (+6%) | 1mo | $184,000 | $120 | 55 |
| 14670 Canyon Pines Ln | 0.72mi | 3/2.0 | 1,585 (+10%) | 4mo | $199,000 | $126 | 46 |
Match score weights: distance 35% · size 25% · config 20% · recency 20%. Top-matched comps best support the ARV.
Projected returns pro-forma
-3.0% appreciation · 0.21% rent growth · sell at horizon
- IRR
- -28.6%
- Equity multiple
- 0.07×
- Total profit
- $-54,540
- Equity at exit
- $31,312
- IRR
- -51.2%
- Equity multiple
- -0.49×
- Total profit
- $-87,568
- Equity at exit
- $18,157
Cash invested: $58,800 (down + closing). Projections, not guarantees.
Landlord ↔ Tenant lean methodology
- Overall (STATE)
- 87 Strongly Landlord-Friendly
- State Texas
- 87 Strongly Landlord-Friendly · R+5
- County
- — inherits STATE
- City
- — inherits STATE
ZIP-level market 77357
- Home prices YoY
- -24.7%
- Rents YoY
- 0.2%
- Active inventory
- 986
- Price-to-rent
- 8.6×
Monthly cashflow live
- Estimated rent
- $2,037 medium interval (Pro) →
- Mortgage (P&I)
- −$1,101
- Tax from tax record
- −$597 /mo · $7,161/yr
- Insurance
- −$88
- HOA
- −$63
- Vacancy / Maint / Mgmt
- −$428
- Net cashflow
- $-239
Break-even live
Sensitivity live
| Price | -10% $-120 | -5% $-180 | +0% $-239 | +5% $-298 | +10% $-358 |
|---|---|---|---|---|---|
| Rent | -10% $-400 | -5% $-319 | +0% $-239 | +5% $-159 | +10% $-78 |
| Rate | -1.0pp $-133 | -0.5pp $-186 | base $-239 | +0.5pp $-293 | +1.0pp $-349 |
UW: 25.0% down · 7.5% · 30yr · 1.5% tax · 5.0% vac · 8.0% maint · 8.0% mgmt
Financing live
Cash to close
- Down payment
- $52,500
- Closing costs
- $6,300
- Reserves months
- —
- Total cash needed
- —
Loan-product check · same deal, 3 products live
Conventional
25% down · 7.5% · 30yr
- Down + closing
- —
- Monthly P&I
- —
- Monthly cashflow
- —
- DSCR
- —
- Eligible?
- —
Personal DTI + credit; lowest rate.
DSCR
20% down · 8.5% · 30yr
- Down + closing
- —
- Monthly P&I
- —
- Monthly cashflow
- —
- DSCR
- —
- Eligible?
- —
No personal income docs; deal must DSCR.
Hard money
10% down · 12.0% · 12mo
- Down + closing
- —
- Monthly P&I
- —
- Monthly cashflow
- —
- DSCR
- —
- Eligible?
- —
Short-term bridge; refi at stabilization.
Rent comps 2 comps
| Address | Beds | Baths | Sqft | Rent | $/sqft | DOM | Units | Dist |
|---|---|---|---|---|---|---|---|---|
| 15019 Ashton Meadows Dr New Caney, TX | 3.0 | 2.0 | 1501 | $1,790 | $1.19 | 26d | 1 | 0.65mi |
| 14255 Timber Fields Way New Caney, TX | 3.0–4.0 | 2.0–2.5 | 1797 | $1,622 | $0.90 | 7d | 57 | 1.04mi |
HOA detail
- Monthly dues
- $63 · $756/yr
- Likely covers
- waterelectriclandscapingpool
Listing history 19 events
-
2026-06-21days on market $210,000 Active 116 DOM
-
2026-06-18days on market $210,000 Active 113 DOM
-
2026-06-17days on market $210,000 Active 112 DOM
-
2026-06-16days on market $210,000 Active 111 DOM
-
2026-06-15days on market $210,000 Active 110 DOM
-
2026-06-13days on market $210,000 Active 108 DOM
-
2026-06-13days on market $210,000 Active 107 DOM
-
2026-06-09days on market $210,000 Active 104 DOM
-
2026-06-08days on market $210,000 Active 103 DOM
-
2026-06-07days on market $210,000 Active 102 DOM
-
2026-06-04days on market $210,000 Active 99 DOM
-
2026-06-03days on market $210,000 Active 98 DOM
-
2026-06-02days on market $210,000 Active 97 DOM
-
2026-06-01days on market $210,000 Active 96 DOM
-
2026-05-31days on market $210,000 Active 95 DOM
-
2026-02-25historical
Show marketing remark (443 chars)
Beautiful 3-bedroom, 2-bath home located in the front section of The Canopies at Harrington Trails! Open-concept layout with spacious kitchen and breakfast bar. Energy-efficient with solar panel/battery system for low electric bills, plus a water softener. Enjoy a large backyard with currently no back neighbors and covered patio for outdoor living. Community offers 2 pools, playgrounds, trails and elementary school within walking distance.
-
2026-02-25$210,000 Active 443-char remark
Show marketing remark (443 chars)
Beautiful 3-bedroom, 2-bath home located in the front section of The Canopies at Harrington Trails! Open-concept layout with spacious kitchen and breakfast bar. Energy-efficient with solar panel/battery system for low electric bills, plus a water softener. Enjoy a large backyard with currently no back neighbors and covered patio for outdoor living. Community offers 2 pools, playgrounds, trails and elementary school within walking distance.
-
2025-10-07price $220,000
-
2025-08-29$225,000 Active
ⓘ Source: listings_history table (triggers on properties + properties_extension) + one-shot
backfill from property_details.listing_events for pre-trigger history.
Tax reassessment forecast TX · Resets to sale price
- Current annual tax
- $7,161 · $597/mo
- Projected year-2 tax
- $7,161 · $597/mo
- Expected delta
- $0/yr ($0/mo · 0.0%)
ⓘ Screening estimate from a state-policy table — verify with the county assessor before closing.
Climate risk First Street
- Flood 1/10 Low FEMA zone X (unshaded) · 0% chance over 30 yrs
- Wildfire 4/10 Moderate
- Heat 8/10 Severe 7 d/yr ≥111°F today · 24 d/yr by 30 yrs out
- Wind 8/10 Severe 99% chance of damaging wind over 30 yrs
- Air quality 2/10 Low 2 unhealthy d/yr today · 2 by 30 yrs out
Nearby sold comps map
Loading sold comps map…
Walkable amenities ~0.75 mi
Loading nearby amenities…
Taxation est. · year 1
- Rental income
- $24,448
- − Mortgage interest
- −$11,763
- − Property taxes
- −$7,161
- − Insurance
- −$1,050
- − Repairs & maintenance
- −$1,956
- − Management
- −$1,956
- − HOA
- −$756
- − Depreciation
- −$6,109
- Taxable loss
- −$6,303
- Est. tax savings @ 24.0%
- +$1,513
- After-tax cash flow
- $-1,355/yr
For passive investors: Depreciation is non-cash, so a rental often shows a tax loss while cash-flowing — sheltering income. Rental losses are passive: they offset passive income freely, and up to $25,000/yr can offset ordinary (W-2) income if you actively participate and your MAGI is under $100k (phasing out to $0 by $150k); unused losses carry forward. On sale, claimed depreciation is recaptured at up to 25%, and gains may owe capital-gains tax (a 1031 exchange can defer both). Figures are a year-1 estimate at your 24.0% rate — not tax advice; consult a CPA.
Condition & rehab AI · 12 photos
This home is in good condition with a good condition score of 80. It has a modern kitchen, two bathrooms, and a well-maintained exterior. The property is located in a community with amenities such as pools, playgrounds, and trails. The home is move-in ready and would be a great investment.
Value-add opportunities
- Resale Paint exterior trim — Enhances curb appeal and can increase property value.
- Rental Clean gutters — Keeps property in good condition and reduces maintenance costs for tenants.
Renovation cost estimate screening
Value-add ROI direction
- Resale Paint exterior trim — Enhances curb appeal and can increase property value. ↑
- Rental Clean gutters — Keeps property in good condition and reduces maintenance costs for tenants. ↑
ⓘ Cost ranges are severity-bucket heuristics (US national rule-of-thumb). Get contractor quotes + a written scope before underwriting a rehab budget.
Schools (NCES district)
- District
- Splendora ISD
- NCES district ID
- 4841070
- Math proficiency
- 25% ▼ -8.00%
- Reading proficiency
- 31% ▼ -1.00%
- Median HH income
- $54,166
- Composite
- 24.92/100
- National rank
- #7572
- State rank
- #648 of 826 in TX
Livability — Woodbranch
- Score
- 66/100
- State rank
- #646
- US rank
- #12243
Category grades
Schools grade is shown separately in the Schools card above.
Census & demographics
- County
- Montgomery County · 663,713 people
- Metro
- Houston-The Woodlands-Sugar Land, TX
- Population (ZIP)
- 37,592
- Household income
- $76,050
- Rent vs Own
- Severe rent burden
- 487.0
Population outlook (Montgomery County) Hauer SSP2
- Today (2025)
- 713,896 people
- By 2030
- 805,263 · +12.8%
- By 2040
- 992,708 · +39.1%
- By 2050
- 1,179,590 · +65.2%
- By 2075
- 1,628,084 · +128.1%
- By 2100
- 1,937,880 · +171.5%
Race, ethnicity, and origin ACS 2023
- Neighborhood character
- Diverse neighborhood (Simpson 0.56)
- Race & ethnicity
- Hispanic / Latino 49% White 45% Two or more races 31% Black 3%
- Hispanic origin (detail)
- Mexican 40%
- Common ancestry
- Lithuanian 2% Romanian 1% Iranian 1%
- Foreign-born
- 23% · Canada, Jamaica
- Languages at home
- 58% English-only · Spanish 40% Other Indo-European 1%
Political lean MEDSL · Montgomery
- 2024 margin
- Solid R (+45.5) · D 26.8% · R 72.3%
- 2008→2024 swing
- +7.2pp toward D · 2008: -52.7pp · 2024: -45.5pp
- All cycles
- 2024: R+45.5 2020: R+43.8 2016: R+51.4 2012: R+60.7 2008: R+52.7
Not yet ingested
- Civics
- —
Market trends
- HPI YoY
- ▼ -87.71%
- Current HPI
- 266.8315
- Rent YoY
- ▲ 0.21%
- Metro
- Houston-The Woodlands-Sugar Land, TX
- State GDP YoY
- ▲ 3.95%
- F500 in state
- 110
Industry mix (Fortune 500 HQ in TX)
| Industry | F500 HQs | Revenue |
|---|---|---|
| Energy | 16 | $1,198B |
|
||
| Technology | 5 | $198B |
|
||
| Engineering / Construction | 4 | $72B |
|
||
| Energy Services | 3 | $60B |
|
||
| Utilities | 3 | $41B |
|
||
| Healthcare | 2 | $330B |
|
||
Price history
-6.7% since first listed4 events — show timeline
- 2026-02-25 Listed $210,000 HARMLS
- 2026-02-25 Listing Removed — HARMLS
- 2025-10-07 Price Changed $220,000 HARMLS
- 2025-08-29 Listed $225,000 HARMLS
Property tax history
+18.2%/yrLatest (2025): $7,161 · -3.4% YoY. Source: county tax records.
Cash-flow waterfall
monthlySold comps — $/sqft
last 12 mo · ≤1 miLoading sold comps…