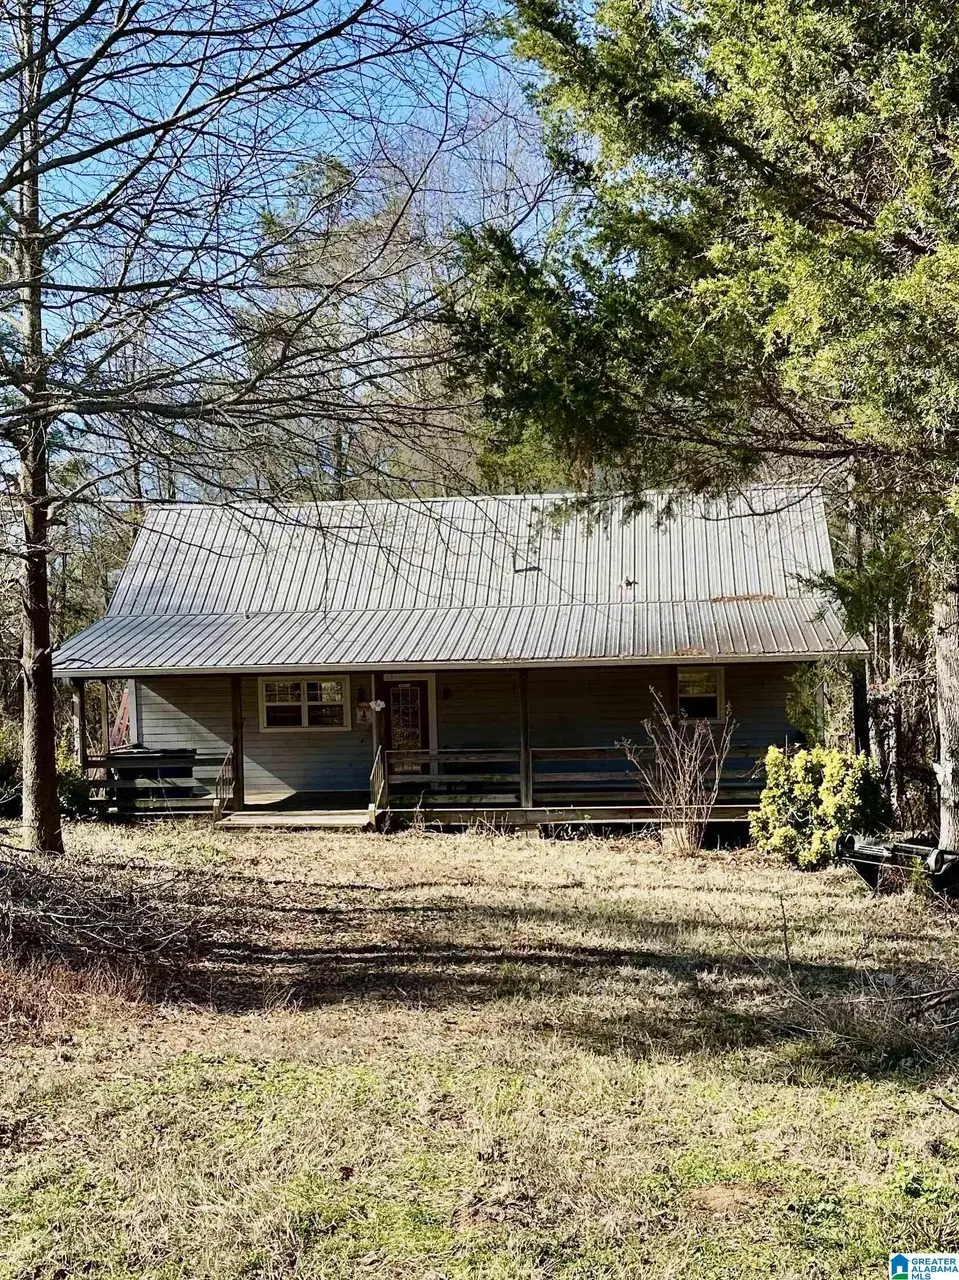
255 Fieldcrest Dr · Garden City, AL
Flood risk 1/10 · Minimal
- FEMA flood zone
- X (unshaded)
- Chance of flooding over 30 yrs
- 0.0%
- Est. flood insurance / yr
- $507 – $1,088
Fire risk 3/10 · Minor
- Est. fire insurance / yr
- $916 – $1,700
Heat risk 5/10 · Moderate
- Hot days now (above 105°F)
- 6 days/yr
- Hot days in 30 yrs
- 15 days/yr
Wind risk 5/10 · Moderate
- Chance of severe wind over 30 yrs
- 25.0%
Air-quality risk 3/10 · Minor
- Unhealthy air days now
- 2 days/yr
- Unhealthy air days in 30 yrs
- 3 days/yr
Risk factors via First Street. Map © Google.
Why this score? — see what drove the C- grade
The composite is a weighted blend of 9 inputs, each scored 0–100. Each bar is that input's sub-score; the figure is the points it added to the 100-point composite (weight × sub-score).
- Cash flow +19.7/30.0
- ARV discount +9.5/15.0
- DSCR +6.2/10.0
- 1% rule +5.2/10.0
- Schools +2.8/10.0
- Livability +2.7/5.0
- Rent growth +2.5/5.0
- Condition / age +2.2/5.0
- Appreciation +0.0/10.0
$129,900
🖨 Deal sheet 📄 Offer letter ✓ Due diligence
Listing remarks MLS
Are you looking for a small cabin-like feel? This home is your get-a-way home. This home is sold As-Is and the price reflects any repairs. Buyer's home inspection is for buyer purposes only. Survey completed in February 2026
Key facts
- 2.94 acre lot
- Built 1998
- Listed 125 days
Neighborhood map
What this means for you Summary
Snapshot
- This is a 1-bed/1.0-bath single-family listed at $130k. Condition is rated fair.
Deal economics
- At list price, monthly cash flow is $152 ($2k/yr) — positive.
- The deal already cash-flows at list — no discount required.
- Meets the 1% rule at list price ($1k rent vs $130k).
- Recommended offer: $114k (12.0% below list) — sets the bar for market timing.
Location & tenants
- Location reads 53/100 on livability (#476 in AL) — a working-class tenant base; expect higher turnover. Strengths: cost of living A+, housing A+; Watch: crime D, schools F, amenities F.
- Blount County (rural): math 20% / reading 45% proficiency, ranked #54 of 129 in AL (top 42%) — families likely to look elsewhere, expect single-tenant / working-renter base with shorter leases.
- Market conditions: 54 active listings in the ZIP; 13 units permitted in Blount County in 2024 (0 in 5+ unit buildings).
Forward outlook
- Local home prices are declining (-3.0%/yr); year-one equity from $898 of loan paydown is wiped out by about $4k of value loss. Plan a longer hold.
- Blount County population projected to shrink 8% by 2050 — rents likely to lag national; underwrite the cash flow, not the appreciation.
Negotiation context
- It's been on market 125 days — a 12% lower offer ($114k) is reasonable based on typical stale-listing flexibility.
Risks & watch-outs
- Climate carrying-cost: moderate wind risk, 25% chance of damaging wind over 30y; extreme-heat days projected 6→15/yr by 2055 (HVAC capex compounding) — expect insurance premiums to compound above CPI over the hold.
Questions for the listing agent
- It's been on market 125 days. Have you received any prior offers? Is the seller open to a 12% concession, seller financing, or rate buy-down credit?
- Have any recent inspections been done? Can we get a copy of the seller's disclosures and any deferred-maintenance estimates?
- Why hasn't it sold? Are there any deal-killer items the seller is aware of (foundation, flood, title, zoning, code violations)?
- Is there a deadline driving the sale (1031 exchange, divorce, estate, relocation)? That informs how much negotiation room exists.
- Schools are F-rated, which usually means shorter tenancies and higher turnover. Who's the typical renter profile here, and what's been the actual vacancy rate?
- Crime grade is D in this area — have there been break-ins, vandalism, or insurance claims at this property in the last 3 years? What carrier currently insures it and at what premium?
- What's the average days-on-market for RENTAL listings here right now (not sales)? A rising rental-DOM trend means longer vacancies and softer asking-rent achievability than the comps imply.
- What's the recent tenant-quality profile in this submarket — average credit score on applications, eviction rate, late-payment / NSF rate, and stable-employment percentage? A property-management company in the area should have these aggregated.
- How much new for-sale + rental construction is in the pipeline within 1–3 miles? Heavy new supply typically softens prices + rents 12–24 months out; constrained supply supports both.
Investment metrics
- 1% rule
- 1.02% ✓
- Cap rate
- 7.70%
- Cash-on-cash
- 5.03%
- DSCR
- 1.22
- GRM
- 8.1
CMA / ARV
- ARV (median comp)
- $136,000
- List price
- $129,900
- Delta
- -4.49%
- Verdict
- FAIR
- Comps
- 1 within 2.0 mi
Projected returns pro-forma
-3.0% appreciation · 3.0% rent growth · sell at horizon
- IRR
- -8.5%
- Equity multiple
- 0.69×
- Total profit
- $-11,322
- Equity at exit
- $19,369
- IRR
- 1.1%
- Equity multiple
- 1.07×
- Total profit
- $2,722
- Equity at exit
- $11,231
Cash invested: $36,372 (down + closing). Projections, not guarantees.
Landlord ↔ Tenant lean methodology
- Overall (STATE)
- 90 Strongly Landlord-Friendly
- State Alabama
- 90 Strongly Landlord-Friendly · R+15
- County
- — inherits STATE
- City
- — inherits STATE
ZIP-level market 35079
- Home prices YoY
- -12.4%
- Active inventory
- 54
- Price-to-rent
- 8.1×
Monthly cashflow live
- Estimated rent
- $1,329 medium interval (Pro) →
- Mortgage (P&I)
- −$681
- Tax est. 1.5%
- −$162 /mo · $1,948/yr
- Insurance
- −$54
- HOA
- −$0
- Vacancy / Maint / Mgmt
- −$279
- Net cashflow
- $152
Break-even live
UW: 25.0% down · 7.5% · 30yr · 1.5% tax · 5.0% vac · 8.0% maint · 8.0% mgmt
Financing live
Cash to close
- Down payment
- $32,475
- Closing costs
- $3,897
- Reserves months
- —
- Total cash needed
- —
Loan-product check · same deal, 3 products live
Conventional
25% down · 7.5% · 30yr
- Down + closing
- —
- Monthly P&I
- —
- Monthly cashflow
- —
- DSCR
- —
- Eligible?
- —
Personal DTI + credit; lowest rate.
DSCR
20% down · 8.5% · 30yr
- Down + closing
- —
- Monthly P&I
- —
- Monthly cashflow
- —
- DSCR
- —
- Eligible?
- —
No personal income docs; deal must DSCR.
Hard money
10% down · 12.0% · 12mo
- Down + closing
- —
- Monthly P&I
- —
- Monthly cashflow
- —
- DSCR
- —
- Eligible?
- —
Short-term bridge; refi at stabilization.
Listing history 3 events
-
2026-06-01statusdays on market $129,900 Pending 125 DOM
-
2026-05-31days on market $129,900 Active 124 DOM
-
2026-01-24$129,900 Active 224-char remark
Show marketing remark (224 chars)
Are you looking for a small cabin-like feel? This home is your get-a-way home. This home is sold As-Is and the price reflects any repairs. Buyer's home inspection is for buyer purposes only. Survey completed in February 2026
ⓘ Source: listings_history table (triggers on properties + properties_extension) + one-shot
backfill from property_details.listing_events for pre-trigger history.
Climate risk First Street
- Flood 1/10 Low FEMA zone X (unshaded) · 0% chance over 30 yrs
- Wildfire 3/10 Moderate
- Heat 5/10 Major 6 d/yr ≥105°F today · 15 d/yr by 30 yrs out
- Wind 5/10 Major 25% chance of damaging wind over 30 yrs
- Air quality 3/10 Moderate 2 unhealthy d/yr today · 3 by 30 yrs out
Nearby sold comps map
Loading sold comps map…
Walkable amenities ~0.75 mi
Loading nearby amenities…
Taxation est. · year 1
- Rental income
- $15,951
- − Mortgage interest
- −$7,276
- − Property taxes
- −$1,948
- − Insurance
- −$650
- − Repairs & maintenance
- −$1,276
- − Management
- −$1,276
- − Depreciation
- −$3,779
- Taxable loss
- −$254
- Est. tax savings @ 24.0%
- +$61
- After-tax cash flow
- $1,890/yr
For passive investors: Depreciation is non-cash, so a rental often shows a tax loss while cash-flowing — sheltering income. Rental losses are passive: they offset passive income freely, and up to $25,000/yr can offset ordinary (W-2) income if you actively participate and your MAGI is under $100k (phasing out to $0 by $150k); unused losses carry forward. On sale, claimed depreciation is recaptured at up to 25%, and gains may owe capital-gains tax (a 1031 exchange can defer both). Figures are a year-1 estimate at your 24.0% rate — not tax advice; consult a CPA.
Condition & rehab AI · 12 photos
This property requires moderate repairs and maintenance, with potential for significant value increase through exterior and interior updates.
Repairs flagged
- Moderate roof — visible wear
- Moderate exterior siding — visible wear
- Minor HVAC system — existing water heater
Value-add opportunities
- Both paint exterior and interior — enhances curb appeal and interior aesthetics
- Both landscaping and curb appeal — improves property's visual appeal
- Both roof repair — extends home's lifespan and improves appearance
Renovation cost estimate screening
| Repair item | Severity | Est. cost |
|---|---|---|
| roof · visible wear | Moderate | $3,000–15,000 |
| exterior siding · visible wear | Moderate | $3,000–15,000 |
| HVAC system · existing water heater | Minor | $500–3,000 |
| Total estimated repair cost · 3 items | $6,500–33,000 |
Value-add ROI direction
- Both paint exterior and interior — enhances curb appeal and interior aesthetics ↑
- Both landscaping and curb appeal — improves property's visual appeal ↑
- Both roof repair — extends home's lifespan and improves appearance ↑
ⓘ Cost ranges are severity-bucket heuristics (US national rule-of-thumb). Get contractor quotes + a written scope before underwriting a rehab budget.
Schools (NCES district)
- District
- Blount County
- NCES district ID
- 0100420
- Math proficiency
- 20% ▼ -25.00%
- Reading proficiency
- 45% ▼ -1.00%
- Median HH income
- $45,961
- Composite
- 27.79/100
- National rank
- #6891
- State rank
- #54 of 129 in AL
Livability — Garden City
- Score
- 53/100
- State rank
- #476
- US rank
- #24315
Category grades
Schools grade is shown separately in the Schools card above.
Census & demographics
- City population
- 127
- Population (ZIP)
- 9,388
Population outlook (Blount County) Hauer SSP2
- Today (2025)
- 57,983 people
- By 2030
- 57,405 · -1.0%
- By 2040
- 55,602 · -4.1%
- By 2050
- 53,393 · -7.9%
- By 2075
- 48,248 · -16.8%
- By 2100
- 44,190 · -23.8%
Race, ethnicity, and origin ACS 2023
- Neighborhood character
- Predominantly White (93%)
- Race & ethnicity
- White 93% Two or more races 3% Hispanic / Latino 2% Black 2%
- Common ancestry
- Slovak 2% Italian 1% Serbian 1%
- Foreign-born
- 1% · Canada
- Languages at home
- 98% English-only · Spanish 1% Other Indo-European 1%
Political lean MEDSL · Blount
- 2024 margin
- Solid R (+81.0) · D 9.2% · R 90.2%
- 2008→2024 swing
- -11.5pp toward R · 2008: -69.5pp · 2024: -81.0pp
- All cycles
- 2024: R+81.0 2020: R+80.0 2016: R+81.4 2012: R+74.1 2008: R+69.5
Not yet ingested
- Civics
- —
Market trends
- HPI YoY
- ▼ -36.00%
- Current HPI
- 255.3136
- Rent YoY
- —
- Metro
- —
- State GDP YoY
- ▲ 2.94%
- F500 in state
- 4
Industry mix (Fortune 500 HQ in AL)
| Industry | F500 HQs | Revenue |
|---|---|---|
| Financial Services | 1 | $8B |
|
||
| Healthcare | 1 | $5B |
|
||
Price history
1 event — show timeline
- 2026-01-24 Listed $129,900 Greater Alabama MLS
Cash-flow waterfall
monthlySold comps — $/sqft
last 12 mo · ≤1 miLoading sold comps…