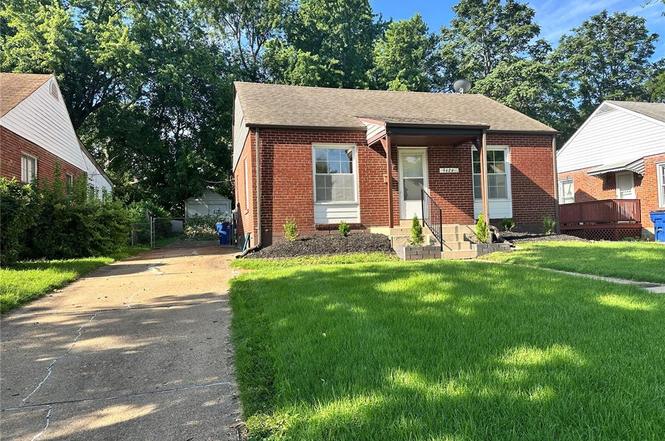
9424 Corregidor Dr · Woodson Terrace, MO
Flood risk 1/10 · Minimal
- FEMA flood zone
- X (unshaded)
- Chance of flooding over 30 yrs
- 0.0%
- Est. flood insurance / yr
- $473 – $860
Fire risk 1/10 · Minimal
- Est. fire insurance / yr
- $1,054 – $1,958
Heat risk 4/10 · Minor
- Hot days now (above 106°F)
- 7 days/yr
- Hot days in 30 yrs
- 21 days/yr
Wind risk 2/10 · Minimal
- Chance of severe wind over 30 yrs
- 1.0%
Air-quality risk 2/10 · Minimal
- Unhealthy air days now
- 1 days/yr
- Unhealthy air days in 30 yrs
- 3 days/yr
Risk factors via First Street. Map © Google.
Why this score? — see what drove the D- grade
The composite is a weighted blend of 9 inputs, each scored 0–100. Each bar is that input's sub-score; the figure is the points it added to the 100-point composite (weight × sub-score).
- Cash flow +16.4/30.0
- DSCR +5.1/10.0
- 1% rule +3.8/10.0
- Livability +3.2/5.0
- Rent growth +2.9/5.0
- Condition / age +2.5/5.0
- ARV discount +2.4/15.0
- Schools +1.7/10.0
- Appreciation +0.0/10.0
$139,900
🖨 Deal sheet (PDF) 📄 Offer letter ✓ Due diligence
Listing remarks
Move in ready and full of charm! Professional photos 6/23, showings start on or before 6/25. This well-maintained full brick home offers the perfect blend of comfort, character, and value. Featuring 2 bedrooms, 1 full bath, and beautiful hardwood floors in the living room and bedrooms, this home is ready for its next owner. The bright and inviting living space flows into a functional kitchen, while the partially finished lower level provides a spacious rec room perfect for entertaining, a home office, or additional living space, plus plenty of unfinished area for storage. Step outside to enjoy the covered back patio overlooking the fenced backyard that is ideal for relaxing, pets, or outdoo
Key facts
- Functional kitchen
- Covered back patio
- Fenced backyard
Tags
Property features AI
Exterior
- Parking: Has garage
- Utilities: Public water; Public sewer; Electric service by Ameren; Electricity connected; Natural gas connected; Water connected; Sewer connected
- Home design: Single-family residence; One level
- Construction: Brick construction
- Exterior features: Covered front porch; Patio; Back yard fencing; Front yard
Interior
- Kitchen: Gas stove
- Bedrooms: Two bedrooms on the main level (each with ceiling fan noted in one bedroom)
- Bathrooms: One full bathroom on the main level
- Heating & cooling: Forced air heating; Central air conditioning
- Interior features: Electric range; Gas water heater; Partially finished basement with storage space and roughed-in bath
- Laundry & utility: Laundry in the basement
Neighborhood map
What this means for you Summary
Snapshot
- This is a 2-bed/1.0-bath single-family listed at $140k.
Deal economics
- At list price, monthly cash flow is $79 ($949/yr) — positive.
- The deal already cash-flows at list — no discount required.
- To meet the 1% rule (rent ≥ 1% of price), the offer needs to be $123k (11.8% below list).
- Recommended offer: $123k (11.8% below list) — sets the bar for 1% rule.
Location & tenants
- Location reads 65/100 on livability (#269 in MO) — a middle-class / working-renter tenant base. Strengths: cost of living A+, housing A+, commute A; Watch: amenities F, health & safety F.
- Ritenour (suburban): math 13% / reading 27% proficiency, ranked #304 of 324 in MO (top 94%) — low school quality limits family demand, transient renter base, plan for 1-2y turnover; 66% free/reduced lunch — lower-income household profile, screen leases tightly.
- Zoned schools: Kratz Elem. (math 9% / reading 25%, grade F, #967 of 1,115 statewide, top 88%, 538 students, 99% FRL); Hoech Middle (math 15% / reading 28%, grade F, #339 of 391 statewide, top 87%, 299 students, 99% FRL); Ritenour Sr. High (math 9% / reading 36%, grade F, #455 of 521 statewide, top 88%, 1,873 students, 100% FRL) — zoned schools average 99% FRL vs 66% district-wide (34 pts higher); higher-poverty schools than district average — tighter screening recommended.
- Market conditions: Rents rising (+1.6%/yr); 71 active listings in the ZIP; 39 comparable units currently listed for rent nearby; rentals at typical pace (median 26d on market — plan ~3-4 weeks tenant-placement turnaround); 46% of comp listings sitting > 30 days — soft ceiling on asking rent; lower-income renter base — watch delinquency; 920 units permitted in St. Louis County in 2024 (250 in 5+ unit buildings).
- This rent runs 33% of the median local income ($45k/yr) — at the standard rent-burdened threshold; future hikes will face affordability resistance.
Forward outlook
- Local home prices are declining (-3.0%/yr); year-one equity from $967 of loan paydown is wiped out by about $4k of value loss. Plan a longer hold.
Negotiation context
- Only 1 days on market — expect competitive offers; lowballing is unlikely to land.
Risks & watch-outs
- Watch-outs: built in 1944 — expect roof / HVAC / electrical / plumbing capex.
Questions for the listing agent
- Built in 1944 — when were the roof, HVAC, electrical panel, plumbing, and water heater last replaced?
- Is there a deadline driving the sale (1031 exchange, divorce, estate, relocation)? That informs how much negotiation room exists.
- Schools are D-rated, which usually means shorter tenancies and higher turnover. Who's the typical renter profile here, and what's been the actual vacancy rate?
- The area grade is low — what's the realistic commute time and amenity access for the typical tenant pool here? Any planned neighborhood developments (good or bad) we should know about?
- What's the average days-on-market for RENTAL listings here right now (not sales)? A rising rental-DOM trend means longer vacancies and softer asking-rent achievability than the comps imply.
- What's the recent tenant-quality profile in this submarket — average credit score on applications, eviction rate, late-payment / NSF rate, and stable-employment percentage? A property-management company in the area should have these aggregated.
- How much new for-sale + rental construction is in the pipeline within 1–3 miles? Heavy new supply typically softens prices + rents 12–24 months out; constrained supply supports both.
Investment metrics
- 1% rule
- 0.88% ✗
- Cap rate
- 6.97%
- Cash-on-cash
- 2.42%
- DSCR
- 1.11
- GRM
- 9.4
CMA / ARV
- ARV (on-the-fly)
- $125,736
- Comps found
- 12
Show comp detail 12 sales within ~0.75 mi
| Address | Dist | Beds/Ba | Sqft | Sold | Price | $/sf | Match |
|---|---|---|---|---|---|---|---|
| 9448 Harold Dr | 0.13mi | 2/1.0 | 864 (+7%) | 2mo | $120,000 | $139 | 80 |
| 3926 Edmundson Rd | 0.20mi | 2/1.0 | 768 (-5%) | 4mo | $59,900 | $78 | 79 |
| 9724 Margo Ann Ln | 0.51mi | 2/1.0 | 816 (+1%) | 2mo | $119,000 | $146 | 73 |
| 3654 Boswell Ave | 0.50mi | 2/1.0 | 825 (+2%) | 5mo | $95,000 | $115 | 68 |
| 4210 Gordon Ave | 0.25mi | 3/1.0 (+1) | 864 (+7%) | 4mo | $140,000 | $162 | 68 |
| 9201 Guthrie Ave | 0.51mi | 2/1.0 | 864 (+7%) | 4mo | $69,900 | $81 | 61 |
| 9255 Leith Ave | 0.58mi | 2/1.0 | 864 (+7%) | 3mo | $140,000 | $162 | 59 |
| 9014 Tutwiler Ave | 0.64mi | 2/1.0 | 850 (+6%) | 4mo | $155,000 | $182 | 58 |
| 25 Jonell Ct | 0.66mi | 2/1.0 | 864 (+7%) | 2mo | $155,000 | $179 | 55 |
| 9121 Guthrie Ave | 0.54mi | 2/1.0 | 888 (+10%) | 4mo | $135,000 | $152 | 55 |
| 9225 Corregidor Ave | 0.37mi | 3/1.0 (+1) | 912 (+13%) | 3mo | $159,900 | $175 | 54 |
| 9033 Bobb Ave | 0.57mi | 3/1.0 (+1) | 864 (+7%) | 5mo | $134,900 | $156 | 53 |
Match score weights: distance 35% · size 25% · config 20% · recency 20%. Top-matched comps best support the ARV.
Projected returns pro-forma
-3.0% appreciation · 1.61% rent growth · sell at horizon
- IRR
- -14.0%
- Equity multiple
- 0.51×
- Total profit
- $-19,362
- Equity at exit
- $20,860
- IRR
- -7.4%
- Equity multiple
- 0.56×
- Total profit
- $-17,270
- Equity at exit
- $12,096
Cash invested: $39,172 (down + closing). Projections, not guarantees.
Landlord ↔ Tenant lean methodology
- Overall (STATE)
- 81 Strongly Landlord-Friendly
- State Missouri
- 81 Strongly Landlord-Friendly · R+10
- County
- — inherits STATE
- City
- — inherits STATE
ZIP-level market 63134
- Rents YoY
- 1.6%
- Active inventory
- 71
- Price-to-rent
- 9.4×
Monthly cashflow live
- Estimated rent
- $1,234 high interval (Pro) →
- Mortgage (P&I)
- −$734
- Tax from tax record
- −$104 /mo · $1,244/yr
- Insurance
- −$58
- HOA
- −$0
- Vacancy / Maint / Mgmt
- −$259
- Net cashflow
- $79
Break-even live
Sensitivity live
| Price | -10% $158 | -5% $119 | +0% $79 | +5% $39 | +10% $0 |
|---|---|---|---|---|---|
| Rent | -10% $-18 | -5% $30 | +0% $79 | +5% $128 | +10% $177 |
| Rate | -1.0pp $150 | -0.5pp $115 | base $79 | +0.5pp $43 | +1.0pp $6 |
UW: 25.0% down · 7.5% · 30yr · 1.5% tax · 5.0% vac · 8.0% maint · 8.0% mgmt
Financing live
Cash to close
- Down payment
- $34,975
- Closing costs
- $4,197
- Reserves months
- —
- Total cash needed
- —
Loan-product check · same deal, 3 products live
Conventional
25% down · 7.5% · 30yr
- Down + closing
- —
- Monthly P&I
- —
- Monthly cashflow
- —
- DSCR
- —
- Eligible?
- —
Personal DTI + credit; lowest rate.
DSCR
20% down · 8.5% · 30yr
- Down + closing
- —
- Monthly P&I
- —
- Monthly cashflow
- —
- DSCR
- —
- Eligible?
- —
No personal income docs; deal must DSCR.
Hard money
10% down · 12.0% · 12mo
- Down + closing
- —
- Monthly P&I
- —
- Monthly cashflow
- —
- DSCR
- —
- Eligible?
- —
Short-term bridge; refi at stabilization.
Rent comps 39 comps
| Address | Beds | Baths | Sqft | Rent | $/sqft | DOM | Units | Dist |
|---|---|---|---|---|---|---|---|---|
| 9448 Harold Dr Saint Louis, MO | 2.0 | 1.0 | 864 | $1,495 | $1.73 | 45d | 1 | 0.15mi |
| 3648 Edmundson Rd Unit 1 St. Louis, MO | 2.0 | 1.0 | 900 | $995 | $1.11 | 45d | 1 | 0.37mi |
| 9183 Harold Dr Saint Louis, MO | 3.0 | 1.0 | 912 | $1,200 | $1.32 | 45d | 1 | 0.39mi |
| 9807 Guthrie Ave Saint Louis, MO | 3.0 | 2.0 | 1068 | $1,685 | $1.58 | 0d | 1 | 0.42mi |
| 9675 Muriel Ave Unit 9733 Overland, MO | 2.0 | 1.5 | 830 | $1,200 | $1.45 | 5d | 1 | 0.45mi |
| 9675 Muriel Ave Unit 9627 Overland, MO | 2.0 | 1.5 | 830 | $1,200 | $1.45 | 45d | 1 | 0.45mi |
| 9675 Muriel Ave Unit 9709 Overland, MO | 2.0 | 1.5 | 830 | $1,200 | $1.45 | 0d | 1 | 0.45mi |
| 9987 Sloane Sq Apt A St. Louis, MO | 1.0 | 1.0 | 571 | $695 | $1.22 | 21d | 1 | 0.62mi |
| 9987 Sloane Sq Unit 9987A St. Louis, MO | 1.0 | 1.0 | 571 | $695 | $1.22 | 46d | 1 | 0.62mi |
| 9310 Shirley Gardens Dr Apt C St. Louis, MO | 2.0 | 1.0 | 800 | $1,200 | $1.50 | 45d | 1 | 0.64mi |
| 9310 Shirley Gardens Dr Apt B St. Louis, MO | 2.0 | 1.0 | 800 | $1,100 | $1.38 | 45d | 1 | 0.64mi |
| 9969 Sloane Sq Unit 9969C St. Louis, MO | 2.0 | 1.0 | 761 | $895 | $1.18 | 6d | 1 | 0.64mi |
| 3961 Jane Ave Unit 3963 St Ann, MO | 2.0 | 1.0 | 750 | $1,195 | $1.59 | 16d | 1 | 0.76mi |
| 4120 Geraldine Ave St Ann, MO | 2.0 | 1.5 | 922 | $1,200 | $1.30 | 19d | 1 | 0.80mi |
| 4120 Geraldine Ave St Ann, MO | 1.0 | 1.0 | 540 | $875 | $1.62 | 23d | 1 | 0.80mi |
| 4120 Geraldine Ave St Ann, MO | 1.0 | 1.0 | 540 | $875 | $1.62 | 45d | 1 | 0.80mi |
| 10069 Livingston Ave St Ann, MO | 2.0 | 1.0 | 875 | $1,100 | $1.26 | 25d | 1 | 0.84mi |
| 8819 McNulty Dr Saint Louis, MO | 2.0 | 1.0 | 752 | $1,225 | $1.63 | 45d | 1 | 0.90mi |
| 3434 Sims Ave Saint Ann, MO | 3.0 | 1.5 | 988 | $1,545 | $1.56 | 45d | 1 | 0.91mi |
| 3208 Dix Ave Saint Louis, MO | 2.0 | 1.0 | 656 | $1,215 | $1.85 | 0d | 1 | 0.95mi |
| 3209 Dix Ave Saint Louis, MO | 3.0 | 1.0 | 1122 | $1,550 | $1.38 | 25d | 1 | 0.95mi |
| 3219 Royalton Ave Saint Louis, MO | 2.0 | 1.0 | 792 | $1,095 | $1.38 | 23d | 1 | 0.99mi |
| 3209 Royalton Ave Saint Louis, MO | 2.0 | 1.0 | 805 | $1,150 | $1.43 | 45d | 1 | 1.01mi |
| 10145 Cabana Club Dr St Ann, MO | 1.0–2.0 | 1.0–2.0 | 776 | $1,060 | $1.37 | 45d | 8 | 1.06mi |
| 3010 Woodson Rd Breckenridge Hills, MO | 1.0 | 1.0 | 850 | $895 | $1.05 | 45d | 1 | 1.11mi |
| 3529 Saint Joachim Ln Saint Ann, MO | 2.0 | 1.0 | 900 | $1,450 | $1.61 | 25d | 1 | 1.12mi |
| 3529 Saint Joachim Ln Unit NA St Ann, MO | 2.0 | 1.0 | 900 | $1,450 | $1.61 | 22d | 1 | 1.12mi |
| 10116 Saint Katherine Ln Saint Ann, MO | 3.0 | 1.0 | 984 | $1,865 | $1.90 | 19d | 1 | 1.13mi |
| 4616 Country Ln St Ann, MO | 1.0–2.0 | 1.0–2.0 | 808 | $1,479 | $1.83 | 0d | 7 | 1.16mi |
| 9429 Baltimore Ave Saint Louis, MO | 2.0 | 1.0 | 900 | $1,200 | $1.33 | 0d | 1 | 1.17mi |
| 9429 Baltimore Ave Saint Louis, MO | 2.0 | 1.0 | 900 | $1,200 | $1.33 | 25d | 1 | 1.17mi |
| 9535 Baltimore Ave Saint Louis, MO | 2.0 | 1.0 | 800 | $1,145 | $1.43 | 25d | 1 | 1.18mi |
| 10214 Saint Anthony Ln Saint Ann, MO | 2.0 | 1.0 | 734 | $1,200 | $1.63 | 45d | 1 | 1.19mi |
| 9618 De Porres Ln Saint Louis, MO | 2.0 | 1.0 | 875 | $1,200 | $1.37 | 45d | 1 | 1.20mi |
| 2732 Annapolis Ave Saint Louis, MO | 2.0 | 1.0 | 768 | $1,250 | $1.63 | 45d | 1 | 1.26mi |
| 8700 Crocus Ln Saint Louis, MO | 1.0 | 1.0 | 700 | $950 | $1.36 | 9d | 2 | 1.37mi |
| 10205 Saint Daniel Ln Saint Ann, MO | 2.0 | 1.0 | 792 | $1,450 | $1.83 | 45d | 1 | 1.43mi |
| 9316 Koenig Cir Berkeley, MO | 2.0 | 1.0 | 720 | $1,150 | $1.60 | 0d | 4 | 1.44mi |
| 10742 Tropic Dr Unit VACANT St Ann, MO | 2.0 | 1.0 | 800 | $1,200 | $1.50 | 45d | 1 | 1.48mi |
Listing history 2 events
-
2026-06-21remarks 699-char remark
-
2026-06-21$139,900 Coming Soon 1 DOM
ⓘ Source: listings_history table (triggers on properties + properties_extension) + one-shot
backfill from property_details.listing_events for pre-trigger history.
Tax reassessment forecast MO · Resets to sale price
- Current annual tax
- $1,244 · $104/mo
- Projected year-2 tax
- $1,357 · $113/mo
- Expected delta
- +$113/yr (+$9/mo · 9.1%)
ⓘ Screening estimate from a state-policy table — verify with the county assessor before closing.
Climate risk First Street
- Flood 1/10 Low FEMA zone X (unshaded) · 0% chance over 30 yrs
- Wildfire 1/10 Low
- Heat 4/10 Moderate 7 d/yr ≥106°F today · 21 d/yr by 30 yrs out
- Wind 2/10 Low 100% chance of damaging wind over 30 yrs
- Air quality 2/10 Low 1 unhealthy d/yr today · 3 by 30 yrs out
Nearby sold comps map
Loading sold comps map…
Walkable amenities ~0.75 mi
Loading nearby amenities…
Taxation est. · year 1
- Rental income
- $14,805
- − Mortgage interest
- −$7,837
- − Property taxes
- −$1,244
- − Insurance
- −$700
- − Repairs & maintenance
- −$1,184
- − Management
- −$1,184
- − Depreciation
- −$4,070
- Taxable loss
- −$1,414
- Est. tax savings @ 24.0%
- +$339
- After-tax cash flow
- $1,288/yr
For passive investors: Depreciation is non-cash, so a rental often shows a tax loss while cash-flowing — sheltering income. Rental losses are passive: they offset passive income freely, and up to $25,000/yr can offset ordinary (W-2) income if you actively participate and your MAGI is under $100k (phasing out to $0 by $150k); unused losses carry forward. On sale, claimed depreciation is recaptured at up to 25%, and gains may owe capital-gains tax (a 1031 exchange can defer both). Figures are a year-1 estimate at your 24.0% rate — not tax advice; consult a CPA.
Schools (NCES district)
- District
- Ritenour
- NCES district ID
- 2926640
- Math proficiency
- 13% ▼ -14.00%
- Reading proficiency
- 27% ▼ -7.00%
- Median HH income
- $41,410
- Composite
- 17.04/100
- National rank
- #9125
- State rank
- #304 of 324 in MO
Livability — Woodson Terrace
- Score
- 65/100
- State rank
- #269
- US rank
- #12635
Category grades
Schools grade is shown separately in the Schools card above.
Census & demographics
- Census place
- Woodson Terrace, MO
- County
- Saint Louis County · 888,823 people
- Metro
- St. Louis, MO-IL
- Population (ZIP)
- 13,059
- Household income
- $44,680
- Rent vs Own
- Severe rent burden
- 655.0
Population outlook (St. Louis County) Hauer SSP2
- Today (2025)
- 1,025,227 people
- By 2030
- 1,028,023 · +0.3%
- By 2040
- 1,020,940 · -0.4%
- By 2050
- 1,007,280 · -1.8%
- By 2075
- 987,277 · -3.7%
- By 2100
- 921,984 · -10.1%
Race, ethnicity, and origin ACS 2023
- Neighborhood character
- Predominantly Black (66%)
- Race & ethnicity
- Black 66% White 17% Hispanic / Latino 13% Two or more races 7%
- Hispanic origin (detail)
- Mexican 8%
- Common ancestry
- Lithuanian 1%
- Foreign-born
- 6% · Canada
- Languages at home
- 86% English-only · Spanish 11%
Political lean MEDSL · St. Louis
- 2024 margin
- Strong D (+23.4) · D 60.8% · R 37.4% · Other 1.7%
- 2008→2024 swing
- +3.5pp toward D · 2008: 19.9pp · 2024: 23.4pp
- All cycles
- 2024: D+23.4 2020: D+24.0 2016: D+16.2 2012: D+13.7 2008: D+19.9
Not yet ingested
- Civics
- —
Market trends
- HPI YoY
- ▼ -164.02%
- Current HPI
- 226.9524
- Rent YoY
- ▲ 1.61%
- Metro
- St. Louis, MO-IL
- State GDP YoY
- ▲ 1.84%
- F500 in state
- 20
Industry mix (Fortune 500 HQ in MO)
| Industry | F500 HQs | Revenue |
|---|---|---|
| Healthcare | 1 | $163B |
|
||
| Insurance | 1 | $21B |
|
||
| Industrial Technology | 1 | $17B |
|
||
| Retail | 1 | $16B |
|
||
| Industrial Distribution | 1 | $10B |
|
||
| Utilities | 1 | $9B |
|
||
Price history
-86.4% since first listed7 events — show timeline
- 2026-06-20 Coming Soon $139,900 MARIS as Distributed by MLS Grid
- 2023-08-29 Rental Removed $1,045 BUILDIUM
- 2023-08-16 Price Changed $1,045 BUILDIUM
- 2023-07-22 Listed for Rent $1,095 BUILDIUM
- 2018-07-11 Sold (Public Records) $1,030,000 Public Records
- 2006-10-06 Sold (Public Records) — Public Records
- 1987-12-01 Sold (Public Records) — Public Records
Property tax history
+0.9%/yrLatest (2022): $1,244 · +0.1% YoY. Source: county tax records.
Cash-flow waterfall
monthlySold comps — $/sqft
last 12 mo · ≤1 miLoading sold comps…