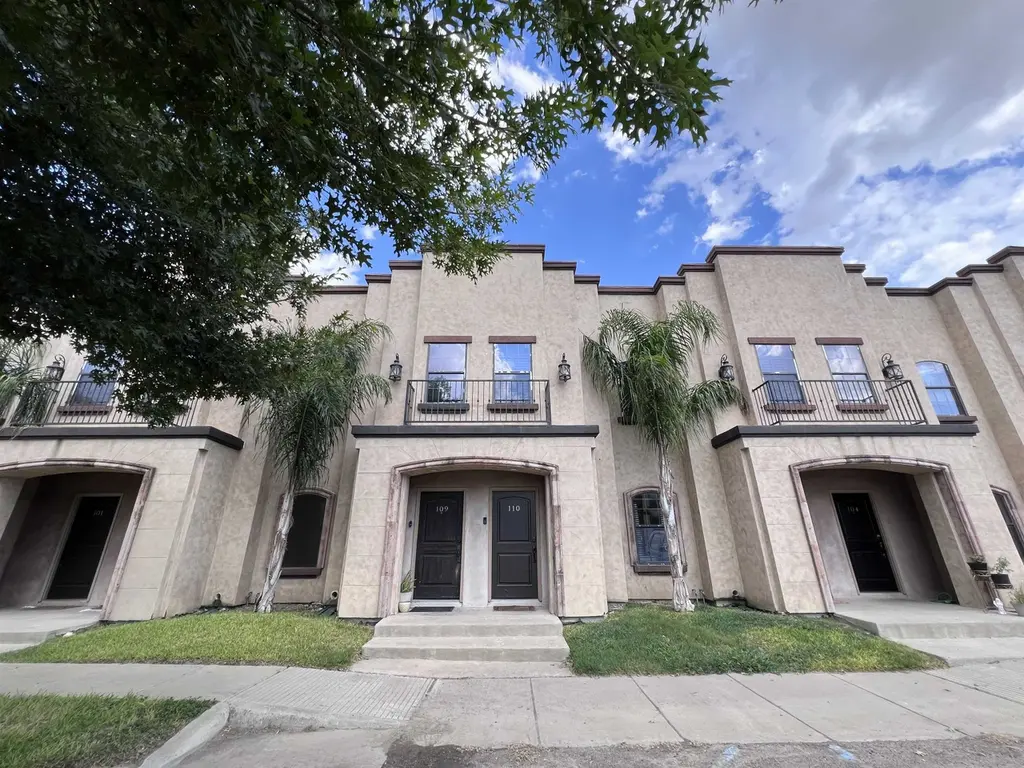
8216 Casa Verde Rd #109 · Laredo, TX
Flood risk No data
- FEMA flood zone
- —
- Chance of flooding over 30 yrs
- —
- Est. flood insurance / yr
- —
Fire risk No data
- Est. fire insurance / yr
- —
Heat risk No data
- Hot days now (above threshold)
- —
- Hot days in 30 yrs
- —
Wind risk No data
- Chance of severe wind over 30 yrs
- —
Air-quality risk No data
- Unhealthy air days now
- —
- Unhealthy air days in 30 yrs
- —
Risk factors via First Street. Map © Google.
Why this score? — see what drove the D grade
The composite is a weighted blend of 9 inputs, each scored 0–100. Each bar is that input's sub-score; the figure is the points it added to the 100-point composite (weight × sub-score).
- Cash flow +14.2/30.0
- ARV discount +7.5/15.0
- DSCR +4.3/10.0
- 1% rule +4.0/10.0
- Livability +3.7/5.0
- Schools +2.8/10.0
- Rent growth +2.5/5.0
- Condition / age +2.5/5.0
- Appreciation +0.0/10.0
$205,000
🖨 Deal sheet (PDF) 📄 Offer letter ✓ Due diligence
Listing remarks MLS
Beautiful, open concept 2bd/2bth condo located on the 2nd floor at the Floridian Condominiums gated community. Features granite countertops, a community pool and a basketball court to name a few. Includes stainless steel refrigerator, electric range, & W/ D hookups. Call to set up your tour today!
Key facts
- Electric range
- Open concept
- Community pool
Tags
Neighborhood map
What this means for you Summary
Snapshot
- This is a 2-bed/2.0-bath single-family listed at $205k.
Deal economics
- At list price, monthly cash flow is $36 ($427/yr) — positive.
- The deal already cash-flows at list — no discount required.
- To meet the 1% rule (rent ≥ 1% of price), the offer needs to be $184k (10.3% below list).
- Recommended offer: $180k (12.0% below list) — sets the bar for market timing.
- Cap rate 6.5% vs local median 4.1% in Laredo — top-decile yield for the area; either an underpriced asset or a hidden risk that comps aren't pricing in. Stress-test before assuming the spread holds.
Location & tenants
- Location reads 73/100 on livability (#227 in TX) — a middle-class / working-renter tenant base. Strengths: cost of living A+, housing A+, health & safety A+; Watch: crime C-, employment D+, amenities F.
- United ISD (urban): math 27% / reading 38% proficiency, ranked #568 of 826 in TX (top 69%) — families likely to look elsewhere, expect single-tenant / working-renter base with shorter leases; 72% free/reduced lunch — lower-income household profile, screen leases tightly.
- Zoned schools: Col Santos Benavides El (math 32% / reading 49%, grade F, #1,490 of 4,322 statewide, top 35%, 895 students, 36% FRL); United Middle (math 39% / reading 51%, grade D, #479 of 1,662 statewide, top 29%, 1,092 students, 49% FRL); John B Alexander H S (math 36% / reading 59%, grade D, #583 of 1,632 statewide, top 36%, 3,070 students, 60% FRL) — zoned schools average 48% FRL vs 72% district-wide (24 pts lower); this property's tenant base skews higher-income than the district average.
- Market conditions: 125 active listings in the ZIP; 10 comparable units currently listed for rent nearby; rentals lingering (median 45d on market — plan ~5-8 weeks vacancy on turnover, expect pricing pressure); 100% of comp listings sitting > 30 days — soft ceiling on asking rent; 1,448 units permitted in Webb County in 2024 (245 in 5+ unit buildings).
Forward outlook
- Local home prices are declining (-3.0%/yr); year-one equity from $1k of loan paydown is wiped out by about $6k of value loss. Plan a longer hold.
- Webb County population projected at +23% by 2050 — long-run rental-demand tailwind backs the buy-and-hold thesis.
Negotiation context
- It's been on market 301 days — a 12% lower offer ($180k) is reasonable based on typical stale-listing flexibility.
- 2 sale attempts since 2y ago with the ask held roughly flat each time — persistent listings suggest the price (not the market) is what's stuck; bring a comps-based counter.
Questions for the listing agent
- It's been on market 301 days. Have you received any prior offers? Is the seller open to a 12% concession, seller financing, or rate buy-down credit?
- Why hasn't it sold? Are there any deal-killer items the seller is aware of (foundation, flood, title, zoning, code violations)?
- Is there a deadline driving the sale (1031 exchange, divorce, estate, relocation)? That informs how much negotiation room exists.
- The area grade is low — what's the realistic commute time and amenity access for the typical tenant pool here? Any planned neighborhood developments (good or bad) we should know about?
- What's the average days-on-market for RENTAL listings here right now (not sales)? A rising rental-DOM trend means longer vacancies and softer asking-rent achievability than the comps imply.
- What's the recent tenant-quality profile in this submarket — average credit score on applications, eviction rate, late-payment / NSF rate, and stable-employment percentage? A property-management company in the area should have these aggregated.
- How much new for-sale + rental construction is in the pipeline within 1–3 miles? Heavy new supply typically softens prices + rents 12–24 months out; constrained supply supports both.
Investment metrics
- 1% rule
- 0.90% ✗
- Cap rate
- 6.50%
- Cash-on-cash
- 0.74%
- DSCR
- 1.03
- GRM
- 9.3
CMA / ARV
No comps found within radius.
Projected returns pro-forma
-3.0% appreciation · 3.0% rent growth · sell at horizon
- IRR
- -15.1%
- Equity multiple
- 0.46×
- Total profit
- $-30,924
- Equity at exit
- $30,566
- IRR
- -6.5%
- Equity multiple
- 0.58×
- Total profit
- $-23,896
- Equity at exit
- $17,725
Cash invested: $57,400 (down + closing). Projections, not guarantees.
Landlord ↔ Tenant lean methodology
- Overall (STATE)
- 87 Strongly Landlord-Friendly
- State Texas
- 87 Strongly Landlord-Friendly · R+5
- County
- — inherits STATE
- City
- — inherits STATE
ZIP-level market 78041
- Active inventory
- 125
- Price-to-rent
- 9.3×
Monthly cashflow live
- Estimated rent
- $1,838 high interval (Pro) →
- Mortgage (P&I)
- −$1,075
- Tax est. 1.5%
- −$256 /mo · $3,075/yr
- Insurance
- −$85
- HOA
- −$0
- Vacancy / Maint / Mgmt
- −$386
- Net cashflow
- $36
Break-even live
Sensitivity live
| Price | -10% $177 | -5% $106 | +0% $36 | +5% $-35 | +10% $-106 |
|---|---|---|---|---|---|
| Rent | -10% $-110 | -5% $-37 | +0% $36 | +5% $108 | +10% $181 |
| Rate | -1.0pp $139 | -0.5pp $88 | base $36 | +0.5pp $-18 | +1.0pp $-72 |
UW: 25.0% down · 7.5% · 30yr · 1.5% tax · 5.0% vac · 8.0% maint · 8.0% mgmt
Financing live
Cash to close
- Down payment
- $51,250
- Closing costs
- $6,150
- Reserves months
- —
- Total cash needed
- —
Loan-product check · same deal, 3 products live
Conventional
25% down · 7.5% · 30yr
- Down + closing
- —
- Monthly P&I
- —
- Monthly cashflow
- —
- DSCR
- —
- Eligible?
- —
Personal DTI + credit; lowest rate.
DSCR
20% down · 8.5% · 30yr
- Down + closing
- —
- Monthly P&I
- —
- Monthly cashflow
- —
- DSCR
- —
- Eligible?
- —
No personal income docs; deal must DSCR.
Hard money
10% down · 12.0% · 12mo
- Down + closing
- —
- Monthly P&I
- —
- Monthly cashflow
- —
- DSCR
- —
- Eligible?
- —
Short-term bridge; refi at stabilization.
Rent comps 10 comps
| Address | Beds | Baths | Sqft | Rent | $/sqft | DOM | Units | Dist |
|---|---|---|---|---|---|---|---|---|
| 7126 Rosson Rd Unit 107 Laredo, TX | 2.0 | 2.0 | 996 | $1,300 | $1.31 | 45d | 1 | 0.48mi |
| 7525 Cresta Bella St Laredo, TX | 3.0 | 2.5 | 1790 | $2,550 | $1.42 | 45d | 1 | 0.58mi |
| 7613 King Arthurs Ct Laredo, TX | 1.0–3.0 | 1.5–2.5 | 1160 | $1,875 | $1.62 | 45d | 1 | 0.95mi |
| 7550 Country Club Dr Laredo, TX | 1.0–3.0 | 1.0–2.0 | 826 | $1,375 | $1.66 | 45d | 23 | 0.97mi |
| 7521 Country Club Dr Unit 106 Laredo, TX | 3.0 | 2.5 | 1817 | $2,800 | $1.54 | 45d | 1 | 0.98mi |
| 7605 Green Meadow Dr Laredo, TX | 2.0 | 2.0 | 980 | $1,225 | $1.25 | 45d | 2 | 1.04mi |
| 1601 Jacaman Rd Laredo, TX | 2.0 | 2.0 | 1005 | $1,349 | $1.34 | 45d | 1 | 1.14mi |
| 1609 Suldana Ave Unit 323 Laredo, TX | 3.0 | 2.5 | 1638 | $1,800 | $1.10 | 45d | 1 | 1.16mi |
| 1609 Suldana Ave #327 Laredo, TX | 3.0 | 2.5 | 1638 | $1,850 | $1.13 | 45d | 1 | 1.16mi |
| 7917 Elka Loop Laredo, TX | 3.0 | 2.5 | 1794 | $2,300 | $1.28 | 45d | 1 | 1.50mi |
Listing history 7 events
-
2026-06-01days on market $205,000 Active 301 DOM
-
2026-05-31days on market $205,000 Active 300 DOM
-
2026-05-30days on market $205,000 Active 299 DOM
-
2025-08-05$205,000 Active 303-char remark
Show marketing remark (303 chars)
Beautiful, open concept 2bd/2bth condo located on the 2nd floor at the Floridian Condominiums gated community. Features granite countertops, a community pool and a basketball court to name a few. Includes stainless steel refrigerator, electric range, & W/ D hookups. Call to set up your tour today!
-
2024-11-27historical $1,450
-
2024-10-12$1,450
-
2022-09-16soldstatus 362-char remark
Show marketing remark (362 chars)
Take a look at this beautiful home located in North Laredo, near shopping, entertainment, restaurants and much more. Easy access to the loop and Mcpherson. This home features 2 bedrooms and 2 full bathrooms. It is a gated community and has a community pool. Set up your private showing today, this wont last long! OPEN HOUSE THURSDAY June 23 from 6:00pm- 8:00pm.
ⓘ Source: listings_history table (triggers on properties + properties_extension) + one-shot
backfill from property_details.listing_events for pre-trigger history.
Nearby sold comps map
Loading sold comps map…
Walkable amenities ~0.75 mi
Loading nearby amenities…
Taxation est. · year 1
- Rental income
- $22,060
- − Mortgage interest
- −$11,483
- − Property taxes
- −$3,075
- − Insurance
- −$1,025
- − Repairs & maintenance
- −$1,765
- − Management
- −$1,765
- − Depreciation
- −$5,964
- Taxable loss
- −$3,016
- Est. tax savings @ 24.0%
- +$724
- After-tax cash flow
- $1,151/yr
For passive investors: Depreciation is non-cash, so a rental often shows a tax loss while cash-flowing — sheltering income. Rental losses are passive: they offset passive income freely, and up to $25,000/yr can offset ordinary (W-2) income if you actively participate and your MAGI is under $100k (phasing out to $0 by $150k); unused losses carry forward. On sale, claimed depreciation is recaptured at up to 25%, and gains may owe capital-gains tax (a 1031 exchange can defer both). Figures are a year-1 estimate at your 24.0% rate — not tax advice; consult a CPA.
Schools (NCES district)
- District
- United ISD
- NCES district ID
- 4843650
- Math proficiency
- 27% ▼ -36.00%
- Reading proficiency
- 38% ▼ -11.00%
- Median HH income
- $47,780
- Composite
- 28.02/100
- National rank
- #6848
- State rank
- #568 of 826 in TX
Livability — Laredo
- Score
- 73/100
- State rank
- #227
- US rank
- #5399
Category grades
Schools grade is shown separately in the Schools card above.
Census & demographics
- Census place
- Laredo, TX
- City population
- 67,333
- Population (ZIP)
- 47,089
Population outlook (Webb County) Hauer SSP2
- Today (2025)
- 301,387 people
- By 2030
- 316,307 · +5.0%
- By 2040
- 345,636 · +14.7%
- By 2050
- 370,647 · +23.0%
- By 2075
- 413,907 · +37.3%
- By 2100
- 416,458 · +38.2%
Race, ethnicity, and origin ACS 2023
- Neighborhood character
- Predominantly Hispanic (93%)
- Race & ethnicity
- Hispanic / Latino 93% Two or more races 52% White 5% Asian 1%
- Hispanic origin (detail)
- Mexican 87%
- Foreign-born
- 24% · Canada, South Korea
- Languages at home
- 14% English-only · Spanish 85%
Political lean MEDSL · Webb
- 2024 margin
- Toss-up / Even · D 48.5% · R 50.7%
- 2008→2024 swing
- -45.6pp toward R · 2008: 43.4pp · 2024: -2.2pp
- All cycles
- 2024: R+2.2 2020: D+23.3 2016: D+51.6 2012: D+54.0 2008: D+43.4
Not yet ingested
- Civics
- —
Market trends
- HPI YoY
- ▼ -188.15%
- Current HPI
- 162.152
- Rent YoY
- —
- Metro
- —
- State GDP YoY
- ▲ 3.95%
- F500 in state
- 110
Industry mix (Fortune 500 HQ in TX)
| Industry | F500 HQs | Revenue |
|---|---|---|
| Energy | 16 | $1,198B |
|
||
| Technology | 5 | $198B |
|
||
| Engineering / Construction | 4 | $72B |
|
||
| Energy Services | 3 | $60B |
|
||
| Utilities | 3 | $41B |
|
||
| Healthcare | 2 | $330B |
|
||
Price history
+14037.9% since first listed4 events — show timeline
- 2025-08-05 Listed $205,000 LAOR
- 2024-11-27 Rental Removed $1,450 LAOR
- 2024-10-12 Listed for Rent $1,450 LAOR
- 2022-09-16 Sold (MLS) — LAOR
Cash-flow waterfall
monthlySold comps — $/sqft
last 12 mo · ≤1 miLoading sold comps…