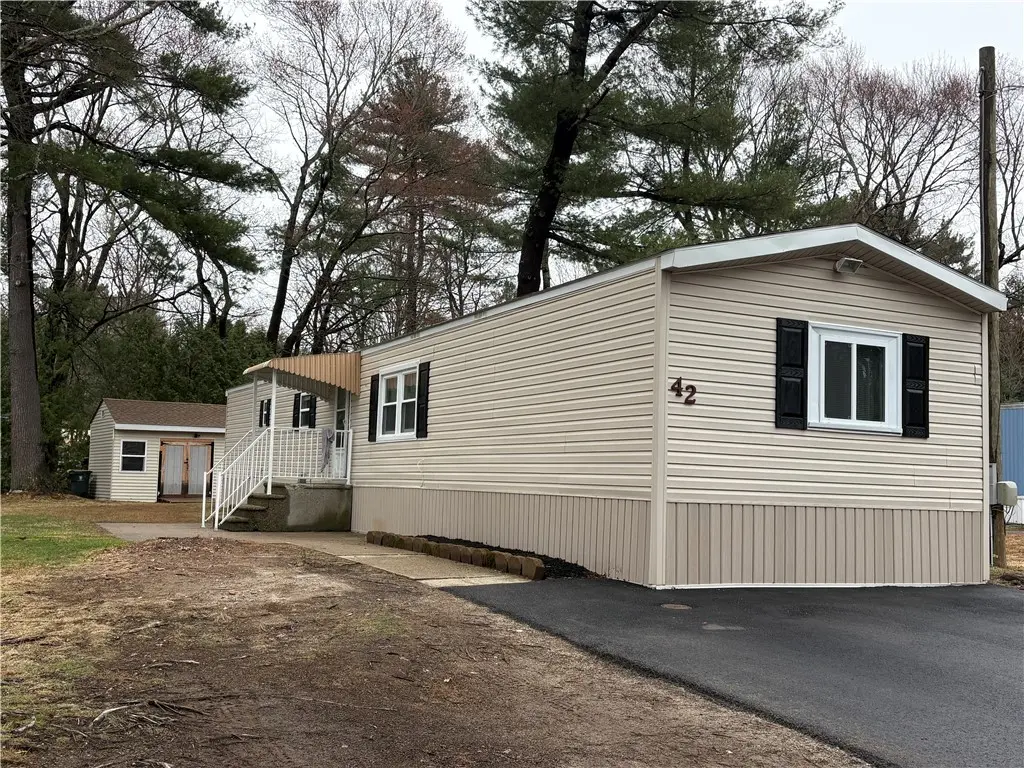
42 Maplewood Dr · Chepachet, RI
Flood risk No data
- FEMA flood zone
- —
- Chance of flooding over 30 yrs
- —
- Est. flood insurance / yr
- —
Fire risk No data
- Est. fire insurance / yr
- —
Heat risk No data
- Hot days now (above threshold)
- —
- Hot days in 30 yrs
- —
Wind risk No data
- Chance of severe wind over 30 yrs
- —
Air-quality risk No data
- Unhealthy air days now
- —
- Unhealthy air days in 30 yrs
- —
Risk factors via First Street. Map © Google.
Why this score? — see what drove the C grade
The composite is a weighted blend of 9 inputs, each scored 0–100. Each bar is that input's sub-score; the figure is the points it added to the 100-point composite (weight × sub-score).
- Cash flow +20.7/30.0
- 1% rule +7.5/10.0
- ARV discount +7.5/15.0
- DSCR +6.6/10.0
- Appreciation +6.2/10.0
- Livability +3.8/5.0
- Rent growth +2.5/5.0
- Condition / age +2.5/5.0
- Schools +2.1/10.0
$159,900
🖨 Deal sheet 📄 Offer letter ✓ Due diligence
Listing remarks
Luckily you did not miss out!!! Nicely updated 2-bedroom, 1-bath mobile home offering comfortable, low-maintenance living. This home features recent updates throughout, including refreshed flooring, modern finishes, and a bright, inviting living space. The kitchen offers ample cabinet storage and functionality, while both bedrooms are well-sized. Enjoy easy one-level living with efficient layout and minimal upkeep. Conveniently located near local amenities, shopping, and major routes. Perfect for downsizers, first-time buyers, or anyone looking for an affordable, move-in ready option. Park approval required, application, rules & by-laws in MLS listing.
Key facts
- Updated mobile home
- One-level living
- Modern finishes
Tags
Property features AI
Finance
- Other: Assessed value reported; Annual taxes reported
- Financial info: Has land lease
- HOA & community: Monthly association fee of $390; Near schools; Recreation area nearby
Exterior
- Parking: No garage; 2 parking spaces
- Utilities: Sewer connected; Water connected (water tap fee); Circuit breaker electrical service
- Home design: Single-story; Plaster and vinyl siding exterior; Slab foundation
- Construction: Plaster construction; Vinyl siding; Slab foundation; Built with 1 story
- Exterior features: Paved driveway
Interior
- Kitchen: Oven; Range; Refrigerator
- Flooring: Laminate flooring; Vinyl flooring
- Bathrooms: 1 full bathroom
- Heating & cooling: Forced air heating (propane); Ductless cooling
- Interior features: Tub with shower
- Laundry & utility: Washer; Dryer; Gas water heater
Neighborhood map
What this means for you Summary
Snapshot
- This is a 2-bed/1.0-bath manufactured listed at $160k.
Deal economics
- At list price, monthly cash flow is $216 ($3k/yr) — positive.
- The deal already cash-flows at list — no discount required.
- Meets the 1% rule at list price ($2k rent vs $160k).
- Recommended offer: $150k (6.0% below list) — sets the bar for market timing.
Location & tenants
- Location reads 75/100 on livability (#9 in RI, #4,347 nationally) — a middle-class / working-renter tenant base. Strengths: crime A+, employment A+, housing A+; Watch: amenities F, commute F.
- Burrillville (suburban): math 14% / reading 29% proficiency, ranked #27 of 39 in RI (top 69%) — low school quality limits family demand, transient renter base, plan for 1-2y turnover.
- Market conditions: 9 active listings in the ZIP; 1 comparable units currently listed for rent nearby; 776 units permitted in Providence County in 2024 (229 in 5+ unit buildings).
Forward outlook
- In year one you build about $5k of equity ($1k loan paydown + $4k appreciation (2.4% local appreciation)).
- Providence County population projected at +5% by 2050 — modest demand growth; plan on rents tracking national, not racing it.
- At projected returns (2.4% appreciation + 3.0% rent growth), your $45k cash investment doubles in ~6 years — after that, you're playing with house money.
- By year 7, paydown + projected appreciation supports a ~$31k cash-out refi (75% LTV) — recoverable capital for the next deal without selling this one.
Negotiation context
- It's been on market 68 days — a 6% lower offer ($150k) is reasonable based on typical stale-listing flexibility.
- 2 sale attempts; this cycle's ask has dropped $9k (5%) from the opening price — seller is motivated, your offer sets the floor, not the list.
Questions for the listing agent
- It's been on market 68 days. Have you received any prior offers? Is the seller open to a 6% concession, seller financing, or rate buy-down credit?
- What does the HOA fee cover, when was the last increase, and are there any pending special assessments or reserve-fund shortfalls?
- Why hasn't it sold? Are there any deal-killer items the seller is aware of (foundation, flood, title, zoning, code violations)?
- Is there a deadline driving the sale (1031 exchange, divorce, estate, relocation)? That informs how much negotiation room exists.
- What's the average days-on-market for RENTAL listings here right now (not sales)? A rising rental-DOM trend means longer vacancies and softer asking-rent achievability than the comps imply.
- What's the recent tenant-quality profile in this submarket — average credit score on applications, eviction rate, late-payment / NSF rate, and stable-employment percentage? A property-management company in the area should have these aggregated.
- How much new for-sale + rental construction is in the pipeline within 1–3 miles? Heavy new supply typically softens prices + rents 12–24 months out; constrained supply supports both.
Investment metrics
- 1% rule
- 1.25% ✓
- Cap rate
- 7.92%
- Cash-on-cash
- 5.80%
- DSCR
- 1.26
- GRM
- 6.7
CMA / ARV
No comps found within radius.
Projected returns pro-forma
2.38% appreciation · 3.0% rent growth · sell at horizon
- IRR
- 11.4%
- Equity multiple
- 1.63×
- Total profit
- $28,087
- Equity at exit
- $66,426
- IRR
- 14.0%
- Equity multiple
- 2.95×
- Total profit
- $87,521
- Equity at exit
- $98,304
Cash invested: $44,772 (down + closing). Projections, not guarantees.
Landlord ↔ Tenant lean methodology
- Overall (STATE)
- 31 Tenant-Leaning
- State Rhode Island
- 31 Tenant-Leaning · D+8
- County
- — inherits STATE
- City
- — inherits STATE
ZIP-level market 02839
- Home prices YoY
- 0.7%
- Active inventory
- 9
- Price-to-rent
- 6.7×
Monthly cashflow live
- Estimated rent
- $2,000 medium interval (Pro) →
- Mortgage (P&I)
- −$839
- Tax from tax record
- −$68 /mo · $822/yr
- Insurance
- −$67
- HOA
- −$390
- Vacancy / Maint / Mgmt
- −$420
- Net cashflow
- $216
Break-even live
UW: 25.0% down · 7.5% · 30yr · 1.5% tax · 5.0% vac · 8.0% maint · 8.0% mgmt
Financing live
Cash to close
- Down payment
- $39,975
- Closing costs
- $4,797
- Reserves months
- —
- Total cash needed
- —
Loan-product check · same deal, 3 products live
Conventional
25% down · 7.5% · 30yr
- Down + closing
- —
- Monthly P&I
- —
- Monthly cashflow
- —
- DSCR
- —
- Eligible?
- —
Personal DTI + credit; lowest rate.
DSCR
20% down · 8.5% · 30yr
- Down + closing
- —
- Monthly P&I
- —
- Monthly cashflow
- —
- DSCR
- —
- Eligible?
- —
No personal income docs; deal must DSCR.
Hard money
10% down · 12.0% · 12mo
- Down + closing
- —
- Monthly P&I
- —
- Monthly cashflow
- —
- DSCR
- —
- Eligible?
- —
Short-term bridge; refi at stabilization.
Rent comps 1 comps
| Address | Beds | Baths | Sqft | Rent | $/sqft | DOM | Units | Dist |
|---|---|---|---|---|---|---|---|---|
| 22 Oakland School St Oakland, RI | 1.0 | 1.0 | 910 | $2,000 | $2.20 | 14d | 1 | 0.92mi |
HOA detail
- Monthly dues
- $390 · $4,680/yr
Listing history 14 events
-
2026-06-12statusdays on market $159,900 Pending 68 DOM
-
2026-06-09days on market $159,900 Active Under Contract 67 DOM
-
2026-06-08days on market $159,900 Active Under Contract 66 DOM
-
2026-06-08days on market $159,900 Active Under Contract 65 DOM
-
2026-06-07days on market $159,900 Active Under Contract 64 DOM
-
2026-06-04days on market $159,900 Active Under Contract 61 DOM
-
2026-06-02days on market $159,900 Active Under Contract 60 DOM
-
2026-06-01days on market $159,900 Active Under Contract 59 DOM
-
2026-05-31days on market $159,900 Active Under Contract 58 DOM
-
2026-05-14historical Active Under Contract
-
2026-05-08status Active
-
2026-05-08price $159,900
-
2026-04-14historical Active Under Contract
-
2026-04-03$169,000 Active
ⓘ Source: listings_history table (triggers on properties + properties_extension) + one-shot
backfill from property_details.listing_events for pre-trigger history.
Tax reassessment forecast RI · Partial reset (capped growth)
- Current annual tax
- $822 · $68/mo
- Projected year-2 tax
- $1,714 · $143/mo
- Expected delta
- +$892/yr (+$74/mo · 108.5%)
ⓘ Screening estimate from a state-policy table — verify with the county assessor before closing.
Nearby sold comps map
Loading sold comps map…
Walkable amenities ~0.75 mi
Loading nearby amenities…
Taxation est. · year 1
- Rental income
- $24,000
- − Mortgage interest
- −$8,957
- − Property taxes
- −$822
- − Insurance
- −$800
- − Repairs & maintenance
- −$1,920
- − Management
- −$1,920
- − HOA
- −$4,680
- − Depreciation
- −$4,652
- Taxable income
- $250
- Est. tax owed @ 24.0%
- −$60
- After-tax cash flow
- $2,536/yr
For passive investors: Depreciation is non-cash, so a rental often shows a tax loss while cash-flowing — sheltering income. Rental losses are passive: they offset passive income freely, and up to $25,000/yr can offset ordinary (W-2) income if you actively participate and your MAGI is under $100k (phasing out to $0 by $150k); unused losses carry forward. On sale, claimed depreciation is recaptured at up to 25%, and gains may owe capital-gains tax (a 1031 exchange can defer both). Figures are a year-1 estimate at your 24.0% rate — not tax advice; consult a CPA.
Schools (NCES district)
- District
- Burrillville
- NCES district ID
- 4400090
- Math proficiency
- 14% ▼ -6.00%
- Reading proficiency
- 29% ▼ -5.00%
- Median HH income
- $66,679
- Composite
- 20.69/100
- National rank
- #8529
- State rank
- #27 of 39 in RI
Livability — Chepachet
- Score
- 75/100
- State rank
- #9
- US rank
- #4347
Category grades
Schools grade is shown separately in the Schools card above.
Census & demographics
- Population (ZIP)
- 1,690
Population outlook (Providence County) Hauer SSP2
- Today (2025)
- 653,469 people
- By 2030
- 660,819 · +1.1%
- By 2040
- 672,747 · +3.0%
- By 2050
- 683,741 · +4.6%
- By 2075
- 720,435 · +10.2%
- By 2100
- 741,582 · +13.5%
Race, ethnicity, and origin ACS 2023
- Neighborhood character
- Predominantly White (95%)
- Race & ethnicity
- White 95% Hispanic / Latino 3% Asian 1%
- Common ancestry
- Lithuanian 41% Romanian 4% Italian 2%
- Foreign-born
- 4% · Canada, Jamaica
- Languages at home
- 94% English-only · Spanish 4% Chinese 1% Russian/Polish/Slavic 1%
Political lean MEDSL · Providence
- 2024 margin
- D (+14.4) · D 56.1% · R 41.7% · Other 2.2%
- 2008→2024 swing
- -20.0pp toward R · 2008: 34.4pp · 2024: 14.4pp
- All cycles
- 2024: D+14.4 2020: D+22.9 2016: D+21.2 2012: D+34.9 2008: D+34.4
Not yet ingested
- Civics
- —
Market trends
- HPI YoY
- ▲ 2.38%
- Current HPI
- 325.8486
- Rent YoY
- —
- Metro
- —
- State GDP YoY
- ▲ 2.25%
- F500 in state
- 10
Industry mix (Fortune 500 HQ in RI)
| Industry | F500 HQs | Revenue |
|---|---|---|
| Healthcare | 1 | $373B |
|
||
| Food Distribution | 1 | $31B |
|
||
| Aerospace / Defense | 1 | $14B |
|
||
| Financial Services | 1 | $8B |
|
||
| Consumer Goods | 1 | $4B |
|
||
Price history
-5.4% since first listed5 events — show timeline
- 2026-05-14 Contingent — RIS
- 2026-05-08 Relisted — RIS
- 2026-05-08 Price Changed $159,900 RIS
- 2026-04-14 Contingent — RIS
- 2026-04-03 Listed $169,000 RIS
Property tax history
+0.0%/yrLatest (2025): $822 · +12.1% YoY. Source: county tax records.
Cash-flow waterfall
monthlySold comps — $/sqft
last 12 mo · ≤1 miLoading sold comps…