 🏗️ New Construction
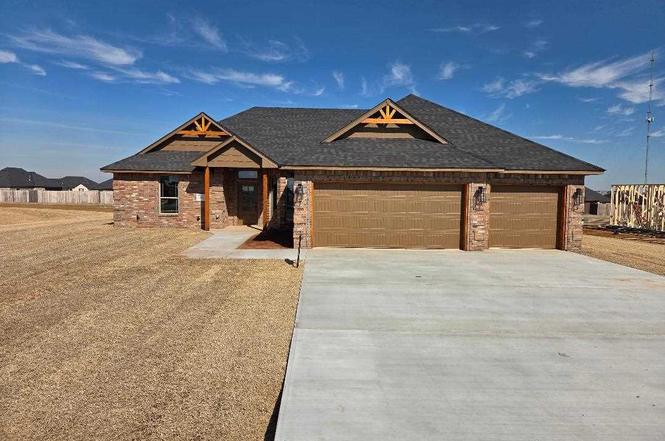
5692 NE Minnow Ln · Elgin, OK
Flood risk 1/10 · Minimal
- FEMA flood zone
- X (unshaded)
- Chance of flooding over 30 yrs
- 0.0%
- Est. flood insurance / yr
- $507 – $1,088
Fire risk 7/10 · Major
- Est. fire insurance / yr
- $2,463 – $4,575
Heat risk 6/10 · Moderate
- Hot days now (above 108°F)
- 7 days/yr
- Hot days in 30 yrs
- 19 days/yr
Wind risk 4/10 · Minor
- Chance of severe wind over 30 yrs
- 10.0%
Air-quality risk 1/10 · Minimal
- Unhealthy air days now
- 0 days/yr
- Unhealthy air days in 30 yrs
- 0 days/yr
Risk factors via First Street. Map © Google.
Why this score? — see what drove the F grade
The composite is a weighted blend of 9 inputs, each scored 0–100. Each bar is that input's sub-score; the figure is the points it added to the 100-point composite (weight × sub-score).
- Appreciation +10.0/10.0
- ARV discount +7.5/15.0
- Cash flow +4.8/30.0
- Livability +3.7/5.0
- Schools +3.0/10.0
- Rent growth +2.5/5.0
- Condition / age +2.5/5.0
- 1% rule +0.6/10.0
- DSCR +0.0/10.0
$369,900
🖨 Deal sheet (PDF) 📄 Offer letter ✓ Due diligence
Listing remarks
Beautiful new 4-Bedroom, 2-Bath house, 3-Car Garage, Newly developed country neighborhood---half acre lot, award-winning Elgin Schools District, brick veneer exterior with wooden porch posts and accents, Open floor plan, Gorgeous colors, Spacious bedrooms, Custom white maple wood cabinets with lots of special trim/built-ins and crown molding and white walls, Black hardware and fixtures, Upgraded 3 cm quartz countertops, Stainless steel appliances including gas cookstove, dishwasher, refrigerator, vent hood and drawer microwave, Gas log fireplace, Ceramic tiled floors(wood look), backsplashes and shower walls with accent, Extra attic insulation, Window blinds, Privacy fence w/ steel post and
Key facts
- Open floor plan
- Quartz countertops
- Wooden porch posts
Tags
Property features AI
Exterior
- Parking: 3 total parking spaces (3 covered); 3-car garage with garage door opener, garage faces side
- Security: Security system; Smoke detectors; Carbon monoxide detectors
- Utilities: Natural gas available; Septic tank
- Home design: Single family residence; One story; New construction; Built by Hardwood Homes
- Construction: Brick veneer exterior; Composition roof; Slab foundation
- Exterior features: Covered patio and porch; Porch; Wood fencing; Spa / hot tub
Interior
- Kitchen: Oven; Microwave; Dishwasher; Disposal; Refrigerator
- Flooring: Ceramic tile; Carpet
- Bathrooms: 2 full bathrooms
- Heating & cooling: Central heating (natural gas); Central air; Ceiling fans
- Interior features: Breakfast bar; Kitchen island; Pantry; Double pane windows; Window coverings; Gas, ventless fireplace
- Laundry & utility: Washer hookup; Gas water heater
Neighborhood map
What this means for you Summary
Snapshot
- This is a 4-bed/2.0-bath land listed at $370k.
Deal economics
- At list price, monthly cash flow is $-911 ($-11k/yr) — negative.
- To cash-flow at today's rent, offer at most $238k (35.6% below list).
- To meet the 1% rule (rent ≥ 1% of price), the offer needs to be $208k (43.7% below list).
- Recommended offer: $208k (43.7% below list) — sets the bar for 1% rule.
- Cap rate 3.3% vs local median 5.0% in Elgin — below-typical yield; the buyer is paying a premium for something (appreciation thesis, condition, location) that the cap rate doesn't capture.
Location & tenants
- Location reads 73/100 on livability (#17 in OK) — a middle-class / working-renter tenant base. Strengths: crime A+, housing A+, cost of living A; Watch: amenities F, commute F, health & safety F.
- Elgin (rural): math 29% / reading 36% proficiency, ranked #38 of 270 in OK (top 14%) — families likely to look elsewhere, expect single-tenant / working-renter base with shorter leases.
- Zoned schools: Elgin Es (math 36% / reading 33%, grade F, #168 of 845 statewide, top 24%, 945 students, 0% FRL); Elgin Ms (math 26% / reading 34%, grade F, #49 of 345 statewide, top 15%, 791 students, 0% FRL); Elgin Hs (math 27% / reading 47%, grade F, #42 of 447 statewide, top 10%, 771 students, 0% FRL) — zoned schools average 0% FRL vs 29% district-wide (29 pts lower); this property's tenant base skews higher-income than the district average.
- Market conditions: 96 active listings in the ZIP; 1 comparable units currently listed for rent nearby; solid renter incomes; 133 units permitted in Comanche County in 2024 (0 in 5+ unit buildings).
Forward outlook
- In year one you build about $40k of equity ($3k loan paydown + $37k appreciation (10.0% local appreciation)).
- Comanche County population projected to shrink 3% by 2050 — rents likely to lag national; underwrite the cash flow, not the appreciation.
- By year 2, paydown + projected appreciation supports a ~$64k cash-out refi (75% LTV) — recoverable capital for the next deal without selling this one.
Negotiation context
- It's been on market 122 days — a 12% lower offer ($326k) is reasonable based on typical stale-listing flexibility.
Risks & watch-outs
- Climate carrying-cost: major wildfire risk; extreme-heat days projected 7→19/yr by 2055 (HVAC capex compounding) — expect insurance premiums to compound above CPI over the hold.
Questions for the listing agent
- What do current leases actually rent for vs. the listed asking? Can we see a recent rent roll and the last 12 months of T-12 income?
- It's been on market 122 days. Have you received any prior offers? Is the seller open to a 44% concession, seller financing, or rate buy-down credit?
- Why hasn't it sold? Are there any deal-killer items the seller is aware of (foundation, flood, title, zoning, code violations)?
- Is there a deadline driving the sale (1031 exchange, divorce, estate, relocation)? That informs how much negotiation room exists.
- The area grade is low — what's the realistic commute time and amenity access for the typical tenant pool here? Any planned neighborhood developments (good or bad) we should know about?
- What's the average days-on-market for RENTAL listings here right now (not sales)? A rising rental-DOM trend means longer vacancies and softer asking-rent achievability than the comps imply.
- What's the recent tenant-quality profile in this submarket — average credit score on applications, eviction rate, late-payment / NSF rate, and stable-employment percentage? A property-management company in the area should have these aggregated.
- How much new for-sale + rental construction is in the pipeline within 1–3 miles? Heavy new supply typically softens prices + rents 12–24 months out; constrained supply supports both.
Investment metrics
- 1% rule
- 0.56% ✗
- Cap rate
- 3.34%
- Cash-on-cash
- -10.55%
- DSCR
- 0.53
- GRM
- 14.8
CMA / ARV
No comps found within radius.
Projected returns pro-forma
10.0% appreciation · 3.0% rent growth · sell at horizon
- IRR
- 16.9%
- Equity multiple
- 2.39×
- Total profit
- $143,481
- Equity at exit
- $333,235
- IRR
- 16.0%
- Equity multiple
- 5.52×
- Total profit
- $468,206
- Equity at exit
- $718,634
Cash invested: $103,572 (down + closing). Projections, not guarantees.
Landlord ↔ Tenant lean methodology
- Overall (STATE)
- 83 Strongly Landlord-Friendly
- State Oklahoma
- 83 Strongly Landlord-Friendly · R+20
- County
- — inherits STATE
- City
- — inherits STATE
ZIP-level market 73538
- Home prices YoY
- 22.9%
- Active inventory
- 96
- Price-to-rent
- 14.8×
Monthly cashflow live
- Estimated rent
- $2,083 medium interval (Pro) →
- Mortgage (P&I)
- −$1,940
- Tax est. 1.5%
- −$462 /mo · $5,548/yr
- Insurance
- −$154
- HOA
- −$0
- Vacancy / Maint / Mgmt
- −$437
- Net cashflow
- $-911
Break-even live
Sensitivity live
| Price | -10% $-655 | -5% $-783 | +0% $-911 | +5% $-1,039 | +10% $-1,166 |
|---|---|---|---|---|---|
| Rent | -10% $-1,075 | -5% $-993 | +0% $-911 | +5% $-829 | +10% $-746 |
| Rate | -1.0pp $-725 | -0.5pp $-817 | base $-911 | +0.5pp $-1,007 | +1.0pp $-1,104 |
UW: 25.0% down · 7.5% · 30yr · 1.5% tax · 5.0% vac · 8.0% maint · 8.0% mgmt
Financing live
Cash to close
- Down payment
- $92,475
- Closing costs
- $11,097
- Reserves months
- —
- Total cash needed
- —
Loan-product check · same deal, 3 products live
Conventional
25% down · 7.5% · 30yr
- Down + closing
- —
- Monthly P&I
- —
- Monthly cashflow
- —
- DSCR
- —
- Eligible?
- —
Personal DTI + credit; lowest rate.
DSCR
20% down · 8.5% · 30yr
- Down + closing
- —
- Monthly P&I
- —
- Monthly cashflow
- —
- DSCR
- —
- Eligible?
- —
No personal income docs; deal must DSCR.
Hard money
10% down · 12.0% · 12mo
- Down + closing
- —
- Monthly P&I
- —
- Monthly cashflow
- —
- DSCR
- —
- Eligible?
- —
Short-term bridge; refi at stabilization.
Rent comps 1 comps
| Address | Beds | Baths | Sqft | Rent | $/sqft | DOM | Units | Dist |
|---|---|---|---|---|---|---|---|---|
| 1201 Kensington Ln Elgin, OK | 2.0–3.0 | 2.0–2.5 | 1414 | $1,700 | $1.20 | 25d | 1 | 0.89mi |
Listing history 20 events
-
2026-06-21days on market $369,900 Active 122 DOM
-
2026-06-19days on market $369,900 Active 120 DOM
-
2026-06-18days on market $369,900 Active 119 DOM
-
2026-06-17days on market $369,900 Active 118 DOM
-
2026-06-16days on market $369,900 Active 117 DOM
-
2026-06-15days on market $369,900 Active 116 DOM
-
2026-06-14days on market $369,900 Active 114 DOM
-
2026-06-13days on market $369,900 Active 113 DOM
-
2026-06-10days on market $369,900 Active 111 DOM
-
2026-06-09days on market $369,900 Active 110 DOM
-
2026-06-08days on market $369,900 Active 109 DOM
-
2026-06-07days on market $369,900 Active 108 DOM
-
2026-06-05days on market $369,900 Active 105 DOM
-
2026-06-02days on market $369,900 Active 103 DOM
-
2026-06-01days on market $369,900 Active 102 DOM
-
2026-05-31days on market $369,900 Active 101 DOM
-
2026-05-30days on market $369,900 Active 100 DOM
-
2026-04-06price $369,900
-
2026-03-02price $375,000
-
2026-02-19$378,900 Active
ⓘ Source: listings_history table (triggers on properties + properties_extension) + one-shot
backfill from property_details.listing_events for pre-trigger history.
Climate risk First Street
- Flood 1/10 Low FEMA zone X (unshaded) · 0% chance over 30 yrs
- Wildfire 7/10 Severe
- Heat 6/10 Major 7 d/yr ≥108°F today · 19 d/yr by 30 yrs out
- Wind 4/10 Moderate 10% chance of damaging wind over 30 yrs
- Air quality 1/10 Low 0 unhealthy d/yr today · 0 by 30 yrs out
Nearby sold comps map
Loading sold comps map…
Walkable amenities ~0.75 mi
Loading nearby amenities…
Taxation est. · year 1
- Rental income
- $24,995
- − Mortgage interest
- −$20,720
- − Property taxes
- −$5,548
- − Insurance
- −$1,850
- − Repairs & maintenance
- −$2,000
- − Management
- −$2,000
- − Depreciation
- −$10,761
- Taxable loss
- −$17,883
- Est. tax savings @ 24.0%
- +$4,292
- After-tax cash flow
- $-6,637/yr
For passive investors: Depreciation is non-cash, so a rental often shows a tax loss while cash-flowing — sheltering income. Rental losses are passive: they offset passive income freely, and up to $25,000/yr can offset ordinary (W-2) income if you actively participate and your MAGI is under $100k (phasing out to $0 by $150k); unused losses carry forward. On sale, claimed depreciation is recaptured at up to 25%, and gains may owe capital-gains tax (a 1031 exchange can defer both). Figures are a year-1 estimate at your 24.0% rate — not tax advice; consult a CPA.
Schools (NCES district)
- District
- Elgin
- NCES district ID
- 4010710
- Math proficiency
- 29% ▼ -9.00%
- Reading proficiency
- 36% ▼ -5.00%
- Median HH income
- $65,900
- Composite
- 29.77/100
- National rank
- #6432
- State rank
- #38 of 270 in OK
Livability — Elgin
- Score
- 73/100
- State rank
- #17
- US rank
- #5411
Category grades
Schools grade is shown separately in the Schools card above.
Census & demographics
- County
- Comanche County · 96,361 people
- City population
- 7,128
- Metro
- Lawton, OK
- Population (ZIP)
- 7,128
- Household income
- $91,324
- Rent vs Own
- Severe rent burden
- 70.0
Population outlook (Comanche County) Hauer SSP2
- Today (2025)
- 124,518 people
- By 2030
- 124,231 · -0.2%
- By 2040
- 122,193 · -1.9%
- By 2050
- 120,368 · -3.3%
- By 2075
- 120,492 · -3.2%
- By 2100
- 123,113 · -1.1%
Race, ethnicity, and origin ACS 2023
- Neighborhood character
- Predominantly White (71%)
- Race & ethnicity
- White 71% Two or more races 15% Hispanic / Latino 13% Native American 4% Black 2% Asian 1%
- Hispanic origin (detail)
- Mexican 11% Puerto Rican 2%
- Common ancestry
- Slovak 5% Romanian 2% Serbian 1%
- Foreign-born
- 3% · Canada
- Languages at home
- 93% English-only · Spanish 4% German/W. Germanic 1%
Political lean MEDSL · Comanche
- 2024 margin
- Strong R (+23.3) · D 37.4% · R 60.7% · Other 1.9%
- 2008→2024 swing
- -5.8pp toward R · 2008: -17.5pp · 2024: -23.3pp
- All cycles
- 2024: R+23.3 2020: R+20.1 2016: R+23.7 2012: R+17.0 2008: R+17.5
Not yet ingested
- Civics
- —
Market trends
- HPI YoY
- ▲ 45.70%
- Current HPI
- 245.4249
- Rent YoY
- —
- Metro
- Lawton, OK
- State GDP YoY
- ▲ 1.55%
- F500 in state
- 6
Industry mix (Fortune 500 HQ in OK)
| Industry | F500 HQs | Revenue |
|---|---|---|
| Energy | 3 | $48B |
|
||
Price history
-2.4% since first listed3 events — show timeline
- 2026-04-06 Price Changed $369,900 LBRMLS
- 2026-03-02 Price Changed $375,000 LBRMLS
- 2026-02-19 Listed $378,900 LBRMLS
Property tax history
+0.0%/yrLatest (2025): $2 · +0.0% YoY. Source: county tax records.
Cash-flow waterfall
monthlySold comps — $/sqft
last 12 mo · ≤1 miLoading sold comps…