207 W Jackson St · West Columbia, TX
Flood risk 1/10 · Minimal
- FEMA flood zone
- X (unshaded)
- Chance of flooding over 30 yrs
- 0.0%
- Est. flood insurance / yr
- $507 – $1,088
Fire risk 4/10 · Minor
- Est. fire insurance / yr
- $1,222 – $2,270
Heat risk 10/10 · Severe
- Hot days now (above 109°F)
- 7 days/yr
- Hot days in 30 yrs
- 25 days/yr
Wind risk 9/10 · Severe
- Chance of severe wind over 30 yrs
- 99.0%
Air-quality risk 2/10 · Minimal
- Unhealthy air days now
- 1 days/yr
- Unhealthy air days in 30 yrs
- 1 days/yr
Risk factors via First Street. Map © Google.
Why this score? — see what drove the B+ grade
The composite is a weighted blend of 9 inputs, each scored 0–100. Each bar is that input's sub-score; the figure is the points it added to the 100-point composite (weight × sub-score).
- Cash flow +30.0/30.0
- 1% rule +10.0/10.0
- DSCR +10.0/10.0
- Appreciation +8.8/10.0
- ARV discount +7.5/15.0
- Livability +3.5/5.0
- Schools +3.0/10.0
- Rent growth +2.5/5.0
- Condition / age +2.5/5.0
$60,000
🖨 Deal sheet (PDF) 📄 Offer letter ✓ Due diligence
Listing remarks
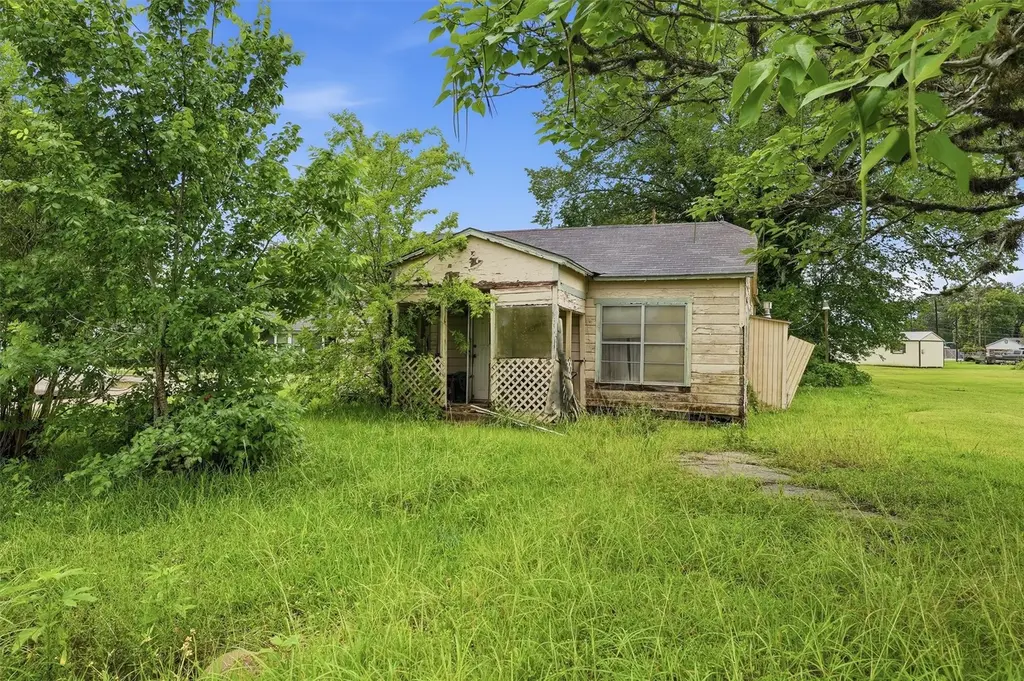
The existing single-story structure features a classic cottage footprint with a front porch, a distinct living area, a kitchen with cabinetry, two bedrooms, and a central bathroom. Situated in a quiet residential neighborhood, the property offers a generous yard space that provides excellent potential for expansion or landscaping.
Key facts
- Front porch
- Living area
- Generous yard space
Tags
Property features AI
Exterior
- Utilities: Public water; Public sewer
- Home design: Residential property; Built in 1947
- Construction: Wood siding exterior; Pillar/post/pier foundation; Composition roof
- Exterior features: Subdivision lot
Interior
- Bedrooms: Three first-floor bedrooms (approx. 10x10 each)
- Bathrooms: One full bathroom (first floor, approx. 10x10)
- Heating & cooling: Central heating (electric); Central air conditioning (electric)
- Interior features: 4 total rooms
Neighborhood map
What this means for you Summary
Snapshot
- This is a 3-bed/1.0-bath single-family listed at $60k.
Deal economics
- At list price, monthly cash flow is $669 ($8k/yr) — positive.
- The deal already cash-flows at list — no discount required.
- Meets the 1% rule at list price ($1k rent vs $60k).
- Recommended offer: $59k (1.5% below list) — sets the bar for market timing.
- Cap rate 19.7% vs local median 4.4% in West Columbia — top-decile yield for the area; either an underpriced asset or a hidden risk that comps aren't pricing in. Stress-test before assuming the spread holds.
Location & tenants
- Location reads 70/100 on livability (#375 in TX) — a middle-class / working-renter tenant base. Strengths: cost of living A+, housing A+, health & safety B+; Watch: amenities F, commute F.
- Columbia-Brazoria ISD (town): math 35% / reading 33% proficiency, ranked #513 of 826 in TX (top 62%) — families likely to look elsewhere, expect single-tenant / working-renter base with shorter leases.
- Zoned schools: West Columbia El (math 47% / reading 39%, grade F, #1,283 of 4,322 statewide, top 30%, 709 students, 60% FRL); West Brazos J H (math 34% / reading 32%, grade F, #930 of 1,662 statewide, top 57%, 676 students, 65% FRL); Columbia H S (math 13% / reading 28%, grade F, #1,389 of 1,632 statewide, top 86%, 889 students, 60% FRL).
- Market conditions: 145 active listings in the ZIP; 5 comparable units currently listed for rent nearby; rentals lingering (median 44d on market — plan ~5-8 weeks vacancy on turnover, expect pricing pressure); 60% of comp listings sitting > 30 days — soft ceiling on asking rent; 3,960 units permitted in Brazoria County in 2024 (593 in 5+ unit buildings).
Forward outlook
- In year one you build about $5k of equity ($415 loan paydown + $5k appreciation (7.6% local appreciation)).
- Brazoria County population projected at +44% by 2050 — long-run rental-demand tailwind backs the buy-and-hold thesis.
- At projected returns (7.6% appreciation + 3.0% rent growth), your $17k cash investment doubles in ~2 years — after that, you're playing with house money.
- By year 7, paydown + projected appreciation supports a ~$34k cash-out refi (75% LTV) — recoverable capital for the next deal without selling this one.
Negotiation context
- It's been on market 21 days — a 2% lower offer ($59k) is reasonable based on typical stale-listing flexibility.
- 2 sale attempts since 3y ago with the ask held roughly flat each time — persistent listings suggest the price (not the market) is what's stuck; bring a comps-based counter.
Risks & watch-outs
- Watch-outs: built in 1947 — expect roof / HVAC / electrical / plumbing capex.
- Climate carrying-cost: severe wind risk, 99% chance of damaging wind over 30y; extreme-heat days projected 7→25/yr by 2055 (HVAC capex compounding) — expect insurance premiums to compound above CPI over the hold.
Questions for the listing agent
- Built in 1947 — when were the roof, HVAC, electrical panel, plumbing, and water heater last replaced?
- Is there a deadline driving the sale (1031 exchange, divorce, estate, relocation)? That informs how much negotiation room exists.
- Schools are D-rated, which usually means shorter tenancies and higher turnover. Who's the typical renter profile here, and what's been the actual vacancy rate?
- What's the average days-on-market for RENTAL listings here right now (not sales)? A rising rental-DOM trend means longer vacancies and softer asking-rent achievability than the comps imply.
- What's the recent tenant-quality profile in this submarket — average credit score on applications, eviction rate, late-payment / NSF rate, and stable-employment percentage? A property-management company in the area should have these aggregated.
- How much new for-sale + rental construction is in the pipeline within 1–3 miles? Heavy new supply typically softens prices + rents 12–24 months out; constrained supply supports both.
Investment metrics
- 1% rule
- 2.20% ✓
- Cap rate
- 19.68%
- Cash-on-cash
- 47.82%
- DSCR
- 3.13
- GRM
- 3.8
CMA / ARV
- ARV (on-the-fly)
- $163,968
- Comps found
- 3
Show comp detail 3 sales within ~0.75 mi
| Address | Dist | Beds/Ba | Sqft | Sold | Price | $/sf | Match |
|---|---|---|---|---|---|---|---|
| 626 S Gray Ave | 0.42mi | 2/1.0 (-1) | 884 (-1%) | 6mo | $156,000 | $176 | 68 |
| 606 S Gray Ave | 0.39mi | 3/1.0 | 921 (+3%) | 12mo | $169,000 | $183 | 68 |
| 135 Ellis Ln | 0.36mi | 2/2.0 (-1) | 1,029 (+15%) | 8mo | $192,000 | $187 | 43 |
Match score weights: distance 35% · size 25% · config 20% · recency 20%. Top-matched comps best support the ARV.
Projected returns pro-forma
7.63% appreciation · 3.0% rent growth · sell at horizon
- IRR
- 58.8%
- Equity multiple
- 4.92×
- Total profit
- $65,933
- Equity at exit
- $44,078
- IRR
- 54.3%
- Equity multiple
- 10.50×
- Total profit
- $159,593
- Equity at exit
- $86,095
Cash invested: $16,800 (down + closing). Projections, not guarantees.
Landlord ↔ Tenant lean methodology
- Overall (STATE)
- 87 Strongly Landlord-Friendly
- State Texas
- 87 Strongly Landlord-Friendly · R+5
- County
- — inherits STATE
- City
- — inherits STATE
ZIP-level market 77486
- Home prices YoY
- 2.4%
- Active inventory
- 145
- Price-to-rent
- 3.8×
Monthly cashflow live
- Estimated rent
- $1,322 high interval (Pro) →
- Mortgage (P&I)
- −$315
- Tax from tax record
- −$35 /mo · $419/yr
- Insurance
- −$25
- HOA
- −$0
- Vacancy / Maint / Mgmt
- −$278
- Net cashflow
- $669
Break-even live
Sensitivity live
| Price | -10% $703 | -5% $686 | +0% $669 | +5% $652 | +10% $635 |
|---|---|---|---|---|---|
| Rent | -10% $565 | -5% $617 | +0% $669 | +5% $722 | +10% $774 |
| Rate | -1.0pp $700 | -0.5pp $685 | base $669 | +0.5pp $654 | +1.0pp $638 |
UW: 25.0% down · 7.5% · 30yr · 1.5% tax · 5.0% vac · 8.0% maint · 8.0% mgmt
Financing live
Cash to close
- Down payment
- $15,000
- Closing costs
- $1,800
- Reserves months
- —
- Total cash needed
- —
Loan-product check · same deal, 3 products live
Conventional
25% down · 7.5% · 30yr
- Down + closing
- —
- Monthly P&I
- —
- Monthly cashflow
- —
- DSCR
- —
- Eligible?
- —
Personal DTI + credit; lowest rate.
DSCR
20% down · 8.5% · 30yr
- Down + closing
- —
- Monthly P&I
- —
- Monthly cashflow
- —
- DSCR
- —
- Eligible?
- —
No personal income docs; deal must DSCR.
Hard money
10% down · 12.0% · 12mo
- Down + closing
- —
- Monthly P&I
- —
- Monthly cashflow
- —
- DSCR
- —
- Eligible?
- —
Short-term bridge; refi at stabilization.
Rent comps 5 comps
| Address | Beds | Baths | Sqft | Rent | $/sqft | DOM | Units | Dist |
|---|---|---|---|---|---|---|---|---|
| 136 Ellis Ln Unit C West Columbia, TX | 2.0 | 2.0 | 900 | $1,350 | $1.50 | 12d | 1 | 0.37mi |
| 136 Ellis Ln Unit C West Columbia, TX | 2.0 | 2.0 | 900 | $1,350 | $1.50 | 7d | 1 | 0.37mi |
| 1106 S Columbia Dr Apt B West Columbia, TX | 2.0 | 2.0 | 1000 | $1,350 | $1.35 | 44d | 1 | 0.66mi |
| 1106 S Columbia Dr West Columbia, TX | 2.0 | 2.0 | 1000 | $1,250 | $1.25 | 44d | 1 | 0.66mi |
| 1224 County Road 449 West Columbia, TX | 2.0 | 1.0 | 850 | $1,250 | $1.47 | 44d | 1 | 0.71mi |
Listing history 19 events
-
2026-06-18days on market $60,000 Active 21 DOM
-
2026-06-17days on market $60,000 Active 20 DOM
-
2026-06-16days on market $60,000 Active 19 DOM
-
2026-06-15days on market $60,000 Active 18 DOM
-
2026-06-13days on market $60,000 Active 16 DOM
-
2026-06-13days on market $60,000 Active 15 DOM
-
2026-06-09days on market $60,000 Active 12 DOM
-
2026-06-08days on market $60,000 Active 11 DOM
-
2026-06-07days on market $60,000 Active 10 DOM
-
2026-06-04days on market $60,000 Active 7 DOM
-
2026-06-03days on market $60,000 Active 6 DOM
-
2026-06-02days on market $60,000 Active 5 DOM
-
2026-06-01days on market $60,000 Active 4 DOM
-
2026-05-31days on market $60,000 Active 3 DOM
-
2026-05-28$60,000 Active
-
2026-01-30soldstatus
-
2026-01-30soldstatus
-
2023-09-30historical
-
2023-06-28$58,000 Active
ⓘ Source: listings_history table (triggers on properties + properties_extension) + one-shot
backfill from property_details.listing_events for pre-trigger history.
Tax reassessment forecast TX · Resets to sale price
- Current annual tax
- $419 · $35/mo
- Projected year-2 tax
- $1,098 · $92/mo
- Expected delta
- +$679/yr (+$57/mo · 162.1%)
ⓘ Screening estimate from a state-policy table — verify with the county assessor before closing.
Climate risk First Street
- Flood 1/10 Low FEMA zone X (unshaded) · 0% chance over 30 yrs
- Wildfire 4/10 Moderate
- Heat 10/10 Extreme 7 d/yr ≥109°F today · 25 d/yr by 30 yrs out
- Wind 9/10 Extreme 99% chance of damaging wind over 30 yrs
- Air quality 2/10 Low 1 unhealthy d/yr today · 1 by 30 yrs out
Nearby sold comps map
Loading sold comps map…
Walkable amenities ~0.75 mi
Loading nearby amenities…
Taxation est. · year 1
- Rental income
- $15,858
- − Mortgage interest
- −$3,361
- − Property taxes
- −$419
- − Insurance
- −$300
- − Repairs & maintenance
- −$1,269
- − Management
- −$1,269
- − Depreciation
- −$1,745
- Taxable income
- $7,496
- Est. tax owed @ 24.0%
- −$1,799
- After-tax cash flow
- $6,234/yr
For passive investors: Depreciation is non-cash, so a rental often shows a tax loss while cash-flowing — sheltering income. Rental losses are passive: they offset passive income freely, and up to $25,000/yr can offset ordinary (W-2) income if you actively participate and your MAGI is under $100k (phasing out to $0 by $150k); unused losses carry forward. On sale, claimed depreciation is recaptured at up to 25%, and gains may owe capital-gains tax (a 1031 exchange can defer both). Figures are a year-1 estimate at your 24.0% rate — not tax advice; consult a CPA.
Schools (NCES district)
- District
- Columbia-Brazoria ISD
- NCES district ID
- 4814670
- Math proficiency
- 35% ▼ -4.00%
- Reading proficiency
- 33% ▼ -1.00%
- Median HH income
- $57,256
- Composite
- 30.23/100
- National rank
- #6297
- State rank
- #513 of 826 in TX
Livability — West Columbia
- Score
- 70/100
- State rank
- #375
- US rank
- #7954
Category grades
Schools grade is shown separately in the Schools card above.
Census & demographics
- Census place
- West Columbia, TX
- Population (ZIP)
- 7,330
Population outlook (Brazoria County) Hauer SSP2
- Today (2025)
- 420,414 people
- By 2030
- 457,585 · +8.8%
- By 2040
- 532,232 · +26.6%
- By 2050
- 605,399 · +44.0%
- By 2075
- 779,358 · +85.4%
- By 2100
- 883,759 · +110.2%
Race, ethnicity, and origin ACS 2023
- Neighborhood character
- Majority White (61%)
- Race & ethnicity
- White 61% Hispanic / Latino 27% Two or more races 13% Black 10% Native American 1%
- Hispanic origin (detail)
- Mexican 23%
- Common ancestry
- Italian 5% Slovak 3% Lithuanian 2%
- Foreign-born
- 5% · Canada
- Languages at home
- 86% English-only · Spanish 12% German/W. Germanic 1%
Political lean MEDSL · Brazoria
- 2024 margin
- R (+19.7) · D 39.5% · R 59.2% · Other 1.3%
- 2008→2024 swing
- +9.9pp toward D · 2008: -29.6pp · 2024: -19.7pp
- All cycles
- 2024: R+19.7 2020: R+18.2 2016: R+24.6 2012: R+34.2 2008: R+29.6
Not yet ingested
- Civics
- —
Market trends
- HPI YoY
- ▲ 7.63%
- Current HPI
- 320.7967
- Rent YoY
- —
- Metro
- —
- State GDP YoY
- ▲ 3.95%
- F500 in state
- 110
Industry mix (Fortune 500 HQ in TX)
| Industry | F500 HQs | Revenue |
|---|---|---|
| Energy | 16 | $1,198B |
|
||
| Technology | 5 | $198B |
|
||
| Engineering / Construction | 4 | $72B |
|
||
| Energy Services | 3 | $60B |
|
||
| Utilities | 3 | $41B |
|
||
| Healthcare | 2 | $330B |
|
||
Price history
+3.4% since first listed5 events — show timeline
- 2026-05-28 Listed $60,000 HARMLS
- 2026-01-30 Sold (Public Records) — Public Records
- 2026-01-30 Sold (Public Records) — Public Records
- 2023-09-30 Listing Removed — HARMLS
- 2023-06-28 Listed $58,000 HARMLS
Property tax history
-1.1%/yrLatest (2025): $419 · +22.4% YoY. Source: county tax records.
Cash-flow waterfall
monthlySold comps — $/sqft
last 12 mo · ≤1 miLoading sold comps…