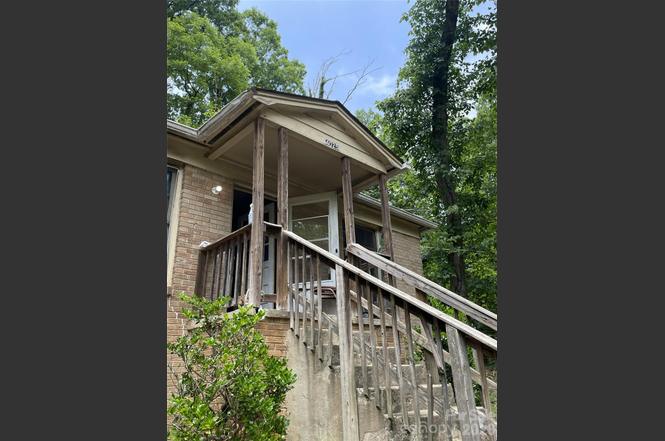
4025 Plato Cir · Charlotte, NC
Flood risk 1/10 · Minimal
- FEMA flood zone
- X (unshaded)
- Chance of flooding over 30 yrs
- 0.0%
- Est. flood insurance / yr
- $507 – $1,088
Fire risk 1/10 · Minimal
- Est. fire insurance / yr
- $906 – $1,684
Heat risk 6/10 · Moderate
- Hot days now (above 103°F)
- 7 days/yr
- Hot days in 30 yrs
- 16 days/yr
Wind risk 6/10 · Moderate
- Chance of severe wind over 30 yrs
- 27.0%
Air-quality risk 3/10 · Minor
- Unhealthy air days now
- 3 days/yr
- Unhealthy air days in 30 yrs
- 4 days/yr
Risk factors via First Street. Map © Google.
Why this score? — see what drove the C grade
The composite is a weighted blend of 9 inputs, each scored 0–100. Each bar is that input's sub-score; the figure is the points it added to the 100-point composite (weight × sub-score).
- Cash flow +23.2/30.0
- ARV discount +7.5/15.0
- DSCR +7.4/10.0
- 1% rule +5.4/10.0
- Livability +3.9/5.0
- Schools +3.8/10.0
- Rent growth +2.9/5.0
- Condition / age +2.5/5.0
- Appreciation +0.0/10.0
$115,000
🖨 Deal sheet 📄 Offer letter ✓ Due diligence
Listing remarks
CALLING ALL INVESTORS, REMODELERS & BUILDERS!! Diamond in the rough awaiting your vision. Property will require a full interior & exterior overhaul; to be sold for cash, as-is, where is.
Key facts
- 5,662 sq ft lot
- Built 1965
- Listed 2 days
Property features AI
Finance
- HOA & community: No HOA
Exterior
- Parking: On-street parking (no main-level garage)
- Utilities: City water; Public sewer
- Home design: Single-family residential home; One story; Site-built construction; Brick exterior
- Construction: Built on a crawl space foundation
- Exterior features: Paved, publicly maintained road access
Interior
- Kitchen: No appliances specified
- Bedrooms: Two bedrooms on the main level
- Flooring: Tile flooring; Wood flooring
- Bathrooms: One full bathroom (main level)
- Heating & cooling: No heating; No cooling
- Interior features: Five total rooms; No built-in appliances listed
- Laundry & utility: Laundry located in the kitchen, inside on the main level
Neighborhood map
What this means for you Summary
Snapshot
- This is a 2-bed/1.0-bath single-family listed at $115k.
Deal economics
- At list price, monthly cash flow is $208 ($2k/yr) — positive.
- The deal already cash-flows at list — no discount required.
- Meets the 1% rule at list price ($1k rent vs $115k).
- Cap rate 8.5% vs local median 3.1% in Charlotte — top-decile yield for the area; either an underpriced asset or a hidden risk that comps aren't pricing in. Stress-test before assuming the spread holds.
Location & tenants
- Location reads 78/100 on livability (#26 in NC, #2,502 nationally) — a middle-class / working-renter tenant base. Strengths: amenities A+, commute A+, housing A+; Watch: crime F.
- Charlotte-Mecklenburg Schools (urban): math 42% / reading 46% proficiency, ranked #85 of 178 in NC (top 48%) — families likely to look elsewhere, expect single-tenant / working-renter base with shorter leases.
- Zoned schools: Westerly Hills Academy (math 12% / reading 17%, grade F, #1,331 of 1,410 statewide, top 96%, 446 students, 99% FRL); Harding University High School (math 27% / reading 33%, grade F, #457 of 535 statewide, top 85%, 1,305 students, 98% FRL) — zoned schools average 99% FRL vs 49% district-wide (50 pts higher); higher-poverty schools than district average — tighter screening recommended.
- Zoned-school proficiency averages 22% at this address vs 44% district-wide (-22 pts) — the specific schools serving this property underperform the Charlotte-Mecklenburg Schools average; the district grade overstates school quality for this exact location.
- Market conditions: Rents rising (+1.5%/yr); 349 active listings in the ZIP; 14 comparable units currently listed for rent nearby; rentals at typical pace (median 24d on market — plan ~3-4 weeks tenant-placement turnaround); 11,969 units permitted in Mecklenburg County in 2024 (5,377 in 5+ unit buildings).
Forward outlook
- Local home prices are declining (-3.0%/yr); year-one equity from $795 of loan paydown is wiped out by about $3k of value loss. Plan a longer hold.
- Mecklenburg County population projected at +53% by 2050 — long-run rental-demand tailwind backs the buy-and-hold thesis.
Negotiation context
- Only 2 days on market — expect competitive offers; lowballing is unlikely to land.
Risks & watch-outs
- Climate carrying-cost: major wind risk, 27% chance of damaging wind over 30y; extreme-heat days projected 7→16/yr by 2055 (HVAC capex compounding) — expect insurance premiums to compound above CPI over the hold.
Questions for the listing agent
- Built in 1965 — when were the roof, HVAC, electrical panel, plumbing, and water heater last replaced?
- Is there a deadline driving the sale (1031 exchange, divorce, estate, relocation)? That informs how much negotiation room exists.
- Schools are D-rated, which usually means shorter tenancies and higher turnover. Who's the typical renter profile here, and what's been the actual vacancy rate?
- Crime grade is F in this area — have there been break-ins, vandalism, or insurance claims at this property in the last 3 years? What carrier currently insures it and at what premium?
- What's the average days-on-market for RENTAL listings here right now (not sales)? A rising rental-DOM trend means longer vacancies and softer asking-rent achievability than the comps imply.
- What's the recent tenant-quality profile in this submarket — average credit score on applications, eviction rate, late-payment / NSF rate, and stable-employment percentage? A property-management company in the area should have these aggregated.
- How much new for-sale + rental construction is in the pipeline within 1–3 miles? Heavy new supply typically softens prices + rents 12–24 months out; constrained supply supports both.
Investment metrics
- 1% rule
- 1.04% ✓
- Cap rate
- 8.46%
- Cash-on-cash
- 7.73%
- DSCR
- 1.34
- GRM
- 8.0
CMA / ARV
No comps found within radius.
Projected returns pro-forma
-3.0% appreciation · 1.47% rent growth · sell at horizon
- IRR
- -6.2%
- Equity multiple
- 0.77×
- Total profit
- $-7,247
- Equity at exit
- $17,147
- IRR
- 1.6%
- Equity multiple
- 1.11×
- Total profit
- $3,425
- Equity at exit
- $9,943
Cash invested: $32,200 (down + closing). Projections, not guarantees.
Landlord ↔ Tenant lean methodology
- Overall (STATE)
- 85 Strongly Landlord-Friendly
- State North Carolina
- 85 Strongly Landlord-Friendly · R+3
- County
- — inherits STATE
- City
- — inherits STATE
ZIP-level market 28208
- Home prices YoY
- -33.4%
- Rents YoY
- 1.5%
- Active inventory
- 349
- Price-to-rent
- 8.0×
Monthly cashflow live
- Estimated rent
- $1,196 high interval (Pro) →
- Mortgage (P&I)
- −$603
- Tax from tax record
- −$86 /mo · $1,031/yr
- Insurance
- −$48
- HOA
- −$0
- Vacancy / Maint / Mgmt
- −$251
- Net cashflow
- $208
Break-even live
UW: 25.0% down · 7.5% · 30yr · 1.5% tax · 5.0% vac · 8.0% maint · 8.0% mgmt
Financing live
Cash to close
- Down payment
- $28,750
- Closing costs
- $3,450
- Reserves months
- —
- Total cash needed
- —
Loan-product check · same deal, 3 products live
Conventional
25% down · 7.5% · 30yr
- Down + closing
- —
- Monthly P&I
- —
- Monthly cashflow
- —
- DSCR
- —
- Eligible?
- —
Personal DTI + credit; lowest rate.
DSCR
20% down · 8.5% · 30yr
- Down + closing
- —
- Monthly P&I
- —
- Monthly cashflow
- —
- DSCR
- —
- Eligible?
- —
No personal income docs; deal must DSCR.
Hard money
10% down · 12.0% · 12mo
- Down + closing
- —
- Monthly P&I
- —
- Monthly cashflow
- —
- DSCR
- —
- Eligible?
- —
Short-term bridge; refi at stabilization.
Rent comps 14 comps
| Address | Beds | Baths | Sqft | Rent | $/sqft | DOM | Units | Dist |
|---|---|---|---|---|---|---|---|---|
| 4507 Helena St Charlotte, NC | 2.0 | 1.0 | 702 | $900 | $1.28 | 13d | 1 | 0.51mi |
| 4552 Helena St Charlotte, NC | 2.0 | 1.0 | 702 | $1,199 | $1.71 | 23d | 1 | 0.57mi |
| 4552 Helena St Charlotte, NC | 2.0 | 1.0 | 702 | $1,199 | $1.71 | 7d | 1 | 0.57mi |
| 2611 Holton Ave #4 Charlotte, NC | 1.0 | 1.0 | 600 | $959 | $1.60 | 23d | 1 | 0.63mi |
| 2611 Holton Ave #2 Charlotte, NC | 1.0 | 1.0 | 600 | $995 | $1.66 | 14d | 1 | 0.63mi |
| 2510 Hemphill St Charlotte, NC | 2.0 | 1.0 | 682 | $1,150 | $1.69 | 23d | 1 | 0.71mi |
| 2425 Kingspark Dr Charlotte, NC | 2.0 | 1.0 | 757 | $1,099 | $1.45 | 23d | 6 | 1.06mi |
| 3128 Ridge Ave Charlotte, NC | 2.0 | 1.0 | 704 | $1,350 | $1.92 | 23d | 1 | 1.14mi |
| 3235 Ross Ave Charlotte, NC | 2.0 | 1.0 | 675 | $1,050 | $1.56 | 23d | 1 | 1.34mi |
| 2811 Marlowe Ave Charlotte, NC | 1.0–3.0 | 1.0 | 820 | $1,238 | $1.51 | 1d | 23 | 1.38mi |
| 1901 Ashley Rd Charlotte, NC | 2.0 | 1.0 | 750 | $1,330 | $1.77 | 7d | 1 | 1.39mi |
| 2203 Highland St Charlotte, NC | 1.0 | 1.0 | 572 | $999 | $1.75 | 2d | 1 | 1.43mi |
| 1701 West Blvd Unit E7 Charlotte, NC | 1.0 | 1.0 | 584 | $1,010 | $1.73 | 23d | 1 | 1.44mi |
| 1701 Remount Rd Charlotte, NC | 1.0 | 1.0 | 525 | $950 | $1.81 | 23d | 1 | 1.48mi |
Listing history 3 events
-
2026-06-18days on market $115,000 Active 2 DOM
-
2026-06-17remarks 190-char remark
-
2026-06-17$115,000 Active 1 DOM
ⓘ Source: listings_history table (triggers on properties + properties_extension) + one-shot
backfill from property_details.listing_events for pre-trigger history.
Tax reassessment forecast NC · Resets to sale price
- Current annual tax
- $1,031 · $86/mo
- Projected year-2 tax
- $1,031 · $86/mo
- Expected delta
- $0/yr ($0/mo · 0.0%)
ⓘ Screening estimate from a state-policy table — verify with the county assessor before closing.
Climate risk First Street
- Flood 1/10 Low FEMA zone X (unshaded) · 0% chance over 30 yrs
- Wildfire 1/10 Low
- Heat 6/10 Major 7 d/yr ≥103°F today · 16 d/yr by 30 yrs out
- Wind 6/10 Major 27% chance of damaging wind over 30 yrs
- Air quality 3/10 Moderate 3 unhealthy d/yr today · 4 by 30 yrs out
Nearby sold comps map
Loading sold comps map…
Walkable amenities ~0.75 mi
Loading nearby amenities…
Taxation est. · year 1
- Rental income
- $14,346
- − Mortgage interest
- −$6,442
- − Property taxes
- −$1,031
- − Insurance
- −$575
- − Repairs & maintenance
- −$1,148
- − Management
- −$1,148
- − Depreciation
- −$3,345
- Taxable income
- $657
- Est. tax owed @ 24.0%
- −$158
- After-tax cash flow
- $2,333/yr
For passive investors: Depreciation is non-cash, so a rental often shows a tax loss while cash-flowing — sheltering income. Rental losses are passive: they offset passive income freely, and up to $25,000/yr can offset ordinary (W-2) income if you actively participate and your MAGI is under $100k (phasing out to $0 by $150k); unused losses carry forward. On sale, claimed depreciation is recaptured at up to 25%, and gains may owe capital-gains tax (a 1031 exchange can defer both). Figures are a year-1 estimate at your 24.0% rate — not tax advice; consult a CPA.
Schools (NCES district)
- District
- Charlotte-Mecklenburg Schools
- NCES district ID
- 3702970
- Math proficiency
- 42% ▼ -6.00%
- Reading proficiency
- 46% ▲ 1.00%
- Median HH income
- $57,175
- Composite
- 38.49/100
- National rank
- #4183
- State rank
- #85 of 178 in NC
Livability — Charlotte
- Score
- 78/100
- State rank
- #26
- US rank
- #2502
Category grades
Schools grade is shown separately in the Schools card above.
Census & demographics
- Census place
- Charlotte, NC
- County
- Mecklenburg County · 1,167,319 people
- City population
- 920,422
- Metro
- Charlotte-Concord-Gastonia, NC-SC
- Population (ZIP)
- 40,197
- Household income
- $55,431
- Rent vs Own
- Severe rent burden
- 2368.0
Population outlook (Mecklenburg County) Hauer SSP2
- Today (2025)
- 1,305,740 people
- By 2030
- 1,442,752 · +10.5%
- By 2040
- 1,722,441 · +31.9%
- By 2050
- 1,999,450 · +53.1%
- By 2075
- 2,642,495 · +102.4%
- By 2100
- 3,106,755 · +137.9%
Race, ethnicity, and origin ACS 2023
- Neighborhood character
- Diverse neighborhood (Simpson 0.57)
- Race & ethnicity
- Black 61% White 16% Hispanic / Latino 14% Two or more races 6% Asian 4%
- Hispanic origin (detail)
- Mexican 5%
- Common ancestry
- Italian 1%
- Foreign-born
- 11% · Canada, Vietnam, China
- Languages at home
- 83% English-only · Spanish 12% Other Asian/Pacific 1% French/Haitian/Cajun 1%
Political lean MEDSL · Mecklenburg
- 2024 margin
- Solid D (+32.9) · D 65.6% · R 32.7% · Other 1.6%
- 2008→2024 swing
- +8.5pp toward D · 2008: 24.4pp · 2024: 32.9pp
- All cycles
- 2024: D+32.9 2020: D+35.1 2016: D+29.9 2012: D+22.5 2008: D+24.4
Not yet ingested
- Civics
- —
Market trends
- HPI YoY
- ▼ -162.76%
- Current HPI
- 324.3642
- Rent YoY
- ▲ 1.47%
- Metro
- Charlotte-Concord-Gastonia, NC-SC
- State GDP YoY
- ▲ 3.28%
- F500 in state
- 26
Industry mix (Fortune 500 HQ in NC)
| Industry | F500 HQs | Revenue |
|---|---|---|
| Financial Services | 2 | $213B |
|
||
| Retail | 2 | $95B |
|
||
| Industrial Conglomerate | 1 | $38B |
|
||
| Metals / Steel | 1 | $35B |
|
||
| Utilities | 1 | $30B |
|
||
| Industrial Machinery | 1 | $19B |
|
||
Price history
1 event — show timeline
- 2026-06-16 Listed $115,000 CANOPYMLS as Distributed by MLS Grid
Property tax history
+5.8%/yrLatest (2025): $1,031 · +3.2% YoY. Source: county tax records.
Cash-flow waterfall
monthlySold comps — $/sqft
last 12 mo · ≤1 miLoading sold comps…