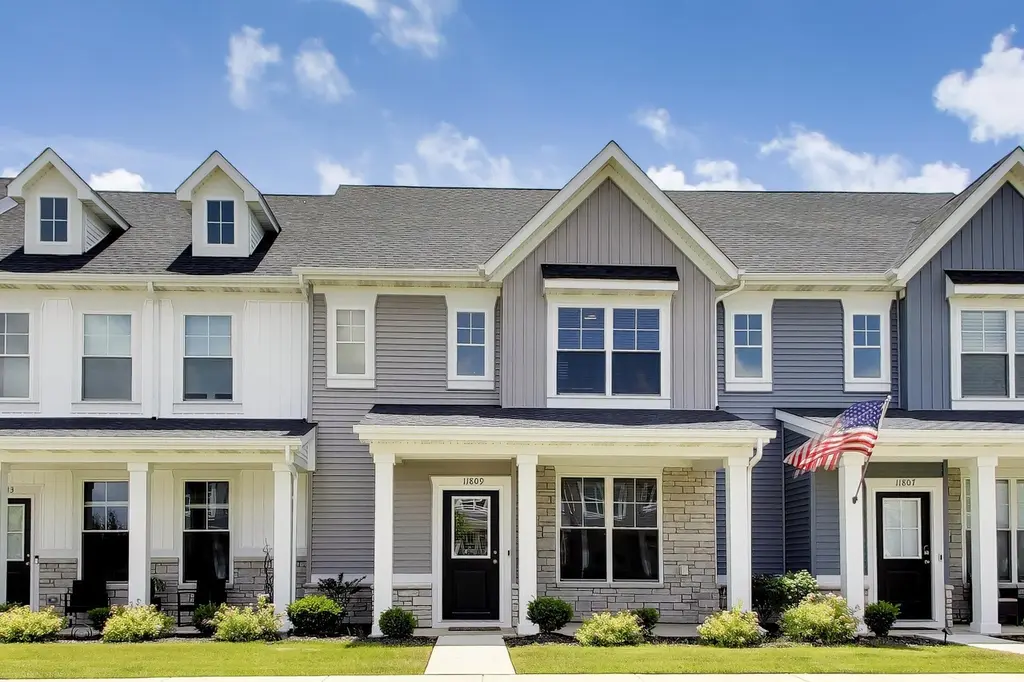
11809 Kentucky St · Crown Point, IN
Flood risk 1/10 · Minimal
- FEMA flood zone
- X (unshaded)
- Chance of flooding over 30 yrs
- 0.0%
- Est. flood insurance / yr
- $507 – $1,088
Fire risk 1/10 · Minimal
- Est. fire insurance / yr
- $717 – $1,331
Heat risk 3/10 · Minor
- Hot days now (above 102°F)
- 7 days/yr
- Hot days in 30 yrs
- 16 days/yr
Wind risk 2/10 · Minimal
- Chance of severe wind over 30 yrs
- 1.0%
Air-quality risk 2/10 · Minimal
- Unhealthy air days now
- 1 days/yr
- Unhealthy air days in 30 yrs
- 3 days/yr
Risk factors via First Street. Map © Google.
Why this score? — see what drove the D- grade
The composite is a weighted blend of 9 inputs, each scored 0–100. Each bar is that input's sub-score; the figure is the points it added to the 100-point composite (weight × sub-score).
- Cash flow +9.8/30.0
- ARV discount +6.4/15.0
- Schools +5.0/10.0
- Livability +3.9/5.0
- 1% rule +3.6/10.0
- Rent growth +3.1/5.0
- DSCR +2.8/10.0
- Condition / age +2.5/5.0
- Appreciation +0.0/10.0
$295,000
🖨 Deal sheet (PDF) 📄 Offer letter ✓ Due diligence
Listing remarks MLS
This 3 bedroom Tate is under construction! The open concept main floor w/ 9' ceilings offers the perfect space to make your own. You'll love your new kitchen w/ 42" Alpine cabinets, quartz countertops, and kitchen appliances including the refrig. The main floor bedroom and a walk-in shower in the powder bath add convenience for a guest room, family member, or home office space. The 2nd floor features a generous sized owners' bedroom with walk in closet, bathroom and a 2nd bedroom. The 2nd floor laundry includes a washer and gas dryer. Luxury vinyl plank flooring throughout the main living area and upgraded carpet on the 2nd floor. A Ring doorbell, and low maintenance landscaping w/ irrigation make this home complete. Enjoy peace of mind with the 10-year structural and 4-year workmanship on the roof warranties along with an industry best customer care program. Visit and find a place where you belong!
Key facts
- Quartz countertops
- Microwave
- Gas range
Tags
Property features AI
Finance
- HOA & community: Homeowners association managed by 1st American Management; Monthly association fee ($150) covering grounds maintenance and snow removal
Exterior
- Parking: Detached garage; 2-car garage; Garage faces rear with alley access; Paved parking; Off-street parking; Additional parking; Garage door opener; Kitchen-level parking access
- Security: Smoke detectors; Carbon monoxide detectors
- Utilities: Public water; Public sewer; Natural gas connected; Cable available
- Home design: Attached property; Two stories; Built in 2025
- Construction: Vinyl siding
- Exterior features: Private yard; Covered patio; Front porch; Neighborhood view
Interior
- Kitchen: Built-in gas range; Stainless steel appliances; Refrigerator; Microwave; Dishwasher; Disposal; ENERGY STAR qualified appliances
- Bedrooms: Primary bedroom; Bedroom 2; Bedroom 3
- Flooring: Carpet; Vinyl
- Bathrooms: 1 full bathroom; 1 three-quarter bathroom
- Heating & cooling: Forced air heating (natural gas); Central air conditioning
- Interior features: Eat-in kitchen; Walk-in closets; Recessed lighting; Pantry; Open floorplan; Kitchen island; In-law floorplan; High ceilings
- Laundry & utility: Washer; Dryer; Washer hookup; Gas dryer hookup; Gas water heater
Neighborhood map
What this means for you Summary
Snapshot
- This is a 3-bed/2.0-bath townhouse listed at $295k.
Deal economics
- At list price, monthly cash flow is $-188 ($-2k/yr) — negative.
- To cash-flow at today's rent, offer at most $268k (9.2% below list).
- To meet the 1% rule (rent ≥ 1% of price), the offer needs to be $253k (14.2% below list).
- Recommended offer: $253k (14.2% below list) — sets the bar for 1% rule.
- Cap rate 5.5% vs local median 3.4% in Crown Point — top-decile yield for the area; either an underpriced asset or a hidden risk that comps aren't pricing in. Stress-test before assuming the spread holds.
Location & tenants
- Location reads 77/100 on livability (#45 in IN, #3,244 nationally) — a middle-class / working-renter tenant base. Strengths: crime A+, employment A+, cost of living A+; Watch: amenities F, commute F, health & safety D-.
- Crown Point Community School Corporation (suburban): math 51% / reading 61% proficiency, ranked #23 of 301 in IN (top 8%) — acceptable for families but not a draw, mixed tenant base, ~2y average lease; only 18% free/reduced lunch — higher-income household profile.
- Zoned schools: Solon Robinson Elementary School (math 59% / reading 57%, grade C+, #160 of 994 statewide, top 17%, 528 students, 34% FRL); Robert Taft Middle School (math 37% / reading 57%, grade D+, #65 of 330 statewide, top 21%, 1,091 students, 23% FRL); Crown Point High School (math 51% / reading 80%, grade B, #29 of 369 statewide, top 8%, 2,948 students, 22% FRL).
- Market conditions: Rents rising (+2.5%/yr); 753 active listings in the ZIP; 2 comparable units currently listed for rent nearby; solid renter incomes; 1,642 units permitted in Lake County in 2024 (14 in 5+ unit buildings).
Forward outlook
- Local home prices are declining (-3.0%/yr); year-one equity from $2k of loan paydown is wiped out by about $9k of value loss. Plan a longer hold.
- Lake County population projected to shrink 7% by 2050 — rents likely to lag national; underwrite the cash flow, not the appreciation.
Negotiation context
- Only 9 days on market — expect competitive offers; lowballing is unlikely to land.
- 3 sale attempts since 2y ago with the ask held roughly flat each time — persistent listings suggest the price (not the market) is what's stuck; bring a comps-based counter.
Questions for the listing agent
- What do current leases actually rent for vs. the listed asking? Can we see a recent rent roll and the last 12 months of T-12 income?
- What does the HOA fee cover, when was the last increase, and are there any pending special assessments or reserve-fund shortfalls?
- Is there a deadline driving the sale (1031 exchange, divorce, estate, relocation)? That informs how much negotiation room exists.
- Schools are B-rated — typically a magnet for longer-tenancy family renters. What's the average tenant stay here, and is there a school-zone premium baked into asking?
- The area grade is low — what's the realistic commute time and amenity access for the typical tenant pool here? Any planned neighborhood developments (good or bad) we should know about?
- What's the average days-on-market for RENTAL listings here right now (not sales)? A rising rental-DOM trend means longer vacancies and softer asking-rent achievability than the comps imply.
- What's the recent tenant-quality profile in this submarket — average credit score on applications, eviction rate, late-payment / NSF rate, and stable-employment percentage? A property-management company in the area should have these aggregated.
- How much new for-sale + rental construction is in the pipeline within 1–3 miles? Heavy new supply typically softens prices + rents 12–24 months out; constrained supply supports both.
Investment metrics
- 1% rule
- 0.86% ✗
- Cap rate
- 5.53%
- Cash-on-cash
- -2.73%
- DSCR
- 0.88
- GRM
- 9.7
CMA / ARV
- ARV (on-the-fly)
- $287,728
- Comps found
- 12
Show comp detail 12 sales within ~0.75 mi
| Address | Dist | Beds/Ba | Sqft | Sold | Price | $/sf | Match |
|---|---|---|---|---|---|---|---|
| 11886 Kentucky St | 0.09mi | 3/2.0 | 1,414 (-4%) | 0mo | $299,900 | $212 | 90 |
| 1053 E 117th Ln | 0.04mi | 2/2.0 (-1) | 1,497 (+2%) | 4mo | $273,000 | $182 | 86 |
| 11803 Rhode Island St | 0.12mi | 2/2.0 (-1) | 1,484 (+1%) | 3mo | $273,000 | $184 | 85 |
| 11878 Kentucky St | 0.08mi | 2/1.5 (-1) | 1,452 (-1%) | 6mo | $269,900 | $186 | 82 |
| 1023 E 117th Ln | 0.05mi | 2/1.5 (-1) | 1,408 (-4%) | 4mo | $280,000 | $199 | 80 |
| 11897 Rhode Island St | 0.15mi | 2/1.5 (-1) | 1,408 (-4%) | 2mo | $279,900 | $199 | 78 |
| 1003 E 117th Ln | 0.06mi | 2/1.5 (-1) | 1,356 (-8%) | 1mo | $289,900 | $214 | 76 |
| 11792 Rhode Island St | 0.16mi | 2/2.0 (-1) | 1,377 (-6%) | 3mo | $300,000 | $218 | 74 |
| 11421 Vermont Pl | 0.51mi | 3/1.5 | 1,504 (+2%) | 2mo | $275,000 | $183 | 69 |
| 11811 Rhode Island St | 0.12mi | 2/1.5 (-1) | 1,304 (-11%) | 5mo | $255,000 | $196 | 64 |
| 11405 Vermont Pl | 0.53mi | 2/1.5 (-1) | 1,410 (-4%) | 1mo | $249,500 | $177 | 61 |
| 11828 Broadway | 0.71mi | 2/1.5 (-1) | 1,380 (-6%) | 2mo | $240,000 | $174 | 49 |
Match score weights: distance 35% · size 25% · config 20% · recency 20%. Top-matched comps best support the ARV.
Projected returns pro-forma
-3.0% appreciation · 2.53% rent growth · sell at horizon
- IRR
- -21.4%
- Equity multiple
- 0.26×
- Total profit
- $-60,839
- Equity at exit
- $43,985
- IRR
- -16.0%
- Equity multiple
- 0.12×
- Total profit
- $-72,713
- Equity at exit
- $25,506
Cash invested: $82,600 (down + closing). Projections, not guarantees.
Landlord ↔ Tenant lean methodology
- Overall (STATE)
- 90 Strongly Landlord-Friendly
- State Indiana
- 90 Strongly Landlord-Friendly · R+11
- County
- — inherits STATE
- City
- — inherits STATE
ZIP-level market 46307
- Rents YoY
- 2.5%
- Active inventory
- 753
- Price-to-rent
- 9.7×
Monthly cashflow live
- Estimated rent
- $2,532 medium interval (Pro) →
- Mortgage (P&I)
- −$1,547
- Tax est. 1.5%
- −$369 /mo · $4,425/yr
- Insurance
- −$123
- HOA
- −$150
- Vacancy / Maint / Mgmt
- −$532
- Net cashflow
- $-188
Break-even live
Sensitivity live
| Price | -10% $16 | -5% $-86 | +0% $-188 | +5% $-290 | +10% $-392 |
|---|---|---|---|---|---|
| Rent | -10% $-388 | -5% $-288 | +0% $-188 | +5% $-88 | +10% $12 |
| Rate | -1.0pp $-39 | -0.5pp $-113 | base $-188 | +0.5pp $-264 | +1.0pp $-342 |
UW: 25.0% down · 7.5% · 30yr · 1.5% tax · 5.0% vac · 8.0% maint · 8.0% mgmt
Financing live
Cash to close
- Down payment
- $73,750
- Closing costs
- $8,850
- Reserves months
- —
- Total cash needed
- —
Loan-product check · same deal, 3 products live
Conventional
25% down · 7.5% · 30yr
- Down + closing
- —
- Monthly P&I
- —
- Monthly cashflow
- —
- DSCR
- —
- Eligible?
- —
Personal DTI + credit; lowest rate.
DSCR
20% down · 8.5% · 30yr
- Down + closing
- —
- Monthly P&I
- —
- Monthly cashflow
- —
- DSCR
- —
- Eligible?
- —
No personal income docs; deal must DSCR.
Hard money
10% down · 12.0% · 12mo
- Down + closing
- —
- Monthly P&I
- —
- Monthly cashflow
- —
- DSCR
- —
- Eligible?
- —
Short-term bridge; refi at stabilization.
Rent comps 2 comps
| Address | Beds | Baths | Sqft | Rent | $/sqft | DOM | Units | Dist |
|---|---|---|---|---|---|---|---|---|
| 484 E 127th Ave Crown Point, IN | 2.0–3.0 | 2.0–2.5 | 1544 | $3,250 | $2.10 | 0d | 20 | 1.17mi |
| 396 Golden Oak Ct Crown Point, IN | 3.0 | 2.0 | 1670 | $2,300 | $1.38 | 0d | 1 | 1.24mi |
HOA detail
- Monthly dues
- $150 · $1,800/yr
- Likely covers
- gaslandscaping
Listing history 7 events
-
2026-06-21pricedays on market $295,000 Active 9 DOM
-
2026-06-18days on market $299,999 Active 6 DOM
-
2026-06-17days on market $299,999 Active 5 DOM
-
2026-06-16days on market $299,999 Active 4 DOM
-
2026-06-15days on market $299,999 Active 3 DOM
-
2026-06-13remarks 699-char remark
-
2026-06-13$299,999 Active 1 DOM
ⓘ Source: listings_history table (triggers on properties + properties_extension) + one-shot
backfill from property_details.listing_events for pre-trigger history.
Climate risk First Street
- Flood 1/10 Low FEMA zone X (unshaded) · 0% chance over 30 yrs
- Wildfire 1/10 Low
- Heat 3/10 Moderate 7 d/yr ≥102°F today · 16 d/yr by 30 yrs out
- Wind 2/10 Low 100% chance of damaging wind over 30 yrs
- Air quality 2/10 Low 1 unhealthy d/yr today · 3 by 30 yrs out
Nearby sold comps map
Loading sold comps map…
Walkable amenities ~0.75 mi
Loading nearby amenities…
Taxation est. · year 1
- Rental income
- $30,390
- − Mortgage interest
- −$16,525
- − Property taxes
- −$4,425
- − Insurance
- −$1,475
- − Repairs & maintenance
- −$2,431
- − Management
- −$2,431
- − HOA
- −$1,800
- − Depreciation
- −$8,582
- Taxable loss
- −$7,279
- Est. tax savings @ 24.0%
- +$1,747
- After-tax cash flow
- $-509/yr
For passive investors: Depreciation is non-cash, so a rental often shows a tax loss while cash-flowing — sheltering income. Rental losses are passive: they offset passive income freely, and up to $25,000/yr can offset ordinary (W-2) income if you actively participate and your MAGI is under $100k (phasing out to $0 by $150k); unused losses carry forward. On sale, claimed depreciation is recaptured at up to 25%, and gains may owe capital-gains tax (a 1031 exchange can defer both). Figures are a year-1 estimate at your 24.0% rate — not tax advice; consult a CPA.
Schools (NCES district)
- District
- Crown Point Community School Corporation
- NCES district ID
- 1802490
- Math proficiency
- 51% ▼ -9.00%
- Reading proficiency
- 61% ▼ -8.00%
- Median HH income
- $69,148
- Composite
- 49.55/100
- National rank
- #1990
- State rank
- #23 of 301 in IN
Livability — Crown Point
- Score
- 77/100
- State rank
- #45
- US rank
- #3244
Category grades
Schools grade is shown separately in the Schools card above.
Census & demographics
- Census place
- Crown Point, IN
- County
- Lake County · 422,878 people
- City population
- 71,673
- Metro
- Chicago-Naperville-Elgin, IL-IN-WI
- Population (ZIP)
- 71,673
- Household income
- $107,800
- Rent vs Own
- Severe rent burden
- 705.0
Population outlook (Lake County) Hauer SSP2
- Today (2025)
- 484,026 people
- By 2030
- 478,091 · -1.2%
- By 2040
- 462,974 · -4.3%
- By 2050
- 449,894 · -7.1%
- By 2075
- 436,169 · -9.9%
- By 2100
- 426,607 · -11.9%
Race, ethnicity, and origin ACS 2023
- Neighborhood character
- Predominantly White (76%)
- Race & ethnicity
- White 76% Hispanic / Latino 12% Two or more races 10% Black 7% Asian 2%
- Hispanic origin (detail)
- Mexican 9% Puerto Rican 1%
- Common ancestry
- Romanian 12% Iranian 3% Lithuanian 2%
- Foreign-born
- 7% · Canada, Vietnam
- Languages at home
- 88% English-only · Spanish 5% Russian/Polish/Slavic 3% Other Indo-European 1%
Political lean MEDSL · Lake
- 2024 margin
- Lean D (+5.6) · D 52.1% · R 46.5% · Other 1.5%
- 2008→2024 swing
- -28.6pp toward R · 2008: 34.3pp · 2024: 5.6pp
- All cycles
- 2024: D+5.6 2020: D+15.1 2016: D+20.6 2012: D+31.0 2008: D+34.3
Not yet ingested
- Civics
- —
Market trends
- HPI YoY
- ▼ -164.91%
- Current HPI
- 226.0335
- Rent YoY
- ▲ 2.53%
- Metro
- Chicago-Naperville-Elgin, IL-IN-WI
- State GDP YoY
- ▲ 2.90%
- F500 in state
- 18
Industry mix (Fortune 500 HQ in IN)
| Industry | F500 HQs | Revenue |
|---|---|---|
| Industrial Machinery | 2 | $37B |
|
||
| Healthcare | 1 | $177B |
|
||
| Pharmaceuticals | 1 | $45B |
|
||
| Metals / Steel | 1 | $18B |
|
||
| Agriculture | 1 | $17B |
|
||
| Packaging | 1 | $12B |
|
||
Price history
+3.4% since first listed10 events — show timeline
- 2026-06-12 Listed $299,999 NIRA MLS as Distributed by MLS Grid
- 2025-05-06 Sold (MLS) $284,143 NIRA MLS as Distributed by MLS Grid
- 2025-04-04 Listing Removed — NIRA MLS as Distributed by MLS Grid
- 2025-04-02 Listed $284,143 NIRA MLS as Distributed by MLS Grid
- 2025-02-26 Listing Removed — NIRA MLS as Distributed by MLS Grid
- 2025-02-11 Price Changed $290,143 NIRA MLS as Distributed by MLS Grid
- 2025-01-30 Price Changed $283,263 NIRA MLS as Distributed by MLS Grid
- 2024-12-12 Price Changed $289,043 NIRA MLS as Distributed by MLS Grid
- 2024-11-07 Price Changed $290,043 NIRA MLS as Distributed by MLS Grid
- 2024-08-15 Listed $290,143 NIRA MLS as Distributed by MLS Grid
Property tax history
-4.5%/yrLatest (2024): $4 · -6.0% YoY. Source: county tax records.
Cash-flow waterfall
monthlySold comps — $/sqft
last 12 mo · ≤1 miLoading sold comps…