 Duplex
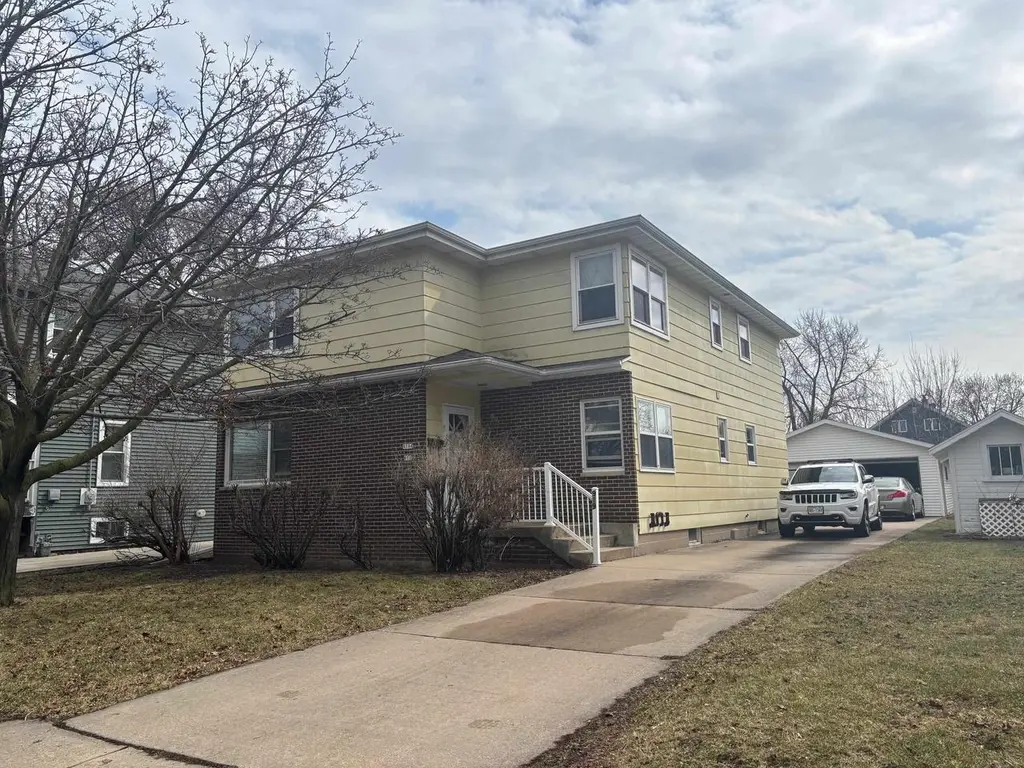
919 Bismarck Ave · Oshkosh, WI
Flood risk 1/10 · Minimal
- FEMA flood zone
- X (unshaded)
- Chance of flooding over 30 yrs
- 0.0%
- Est. flood insurance / yr
- $473 – $860
Fire risk 1/10 · Minimal
- Est. fire insurance / yr
- $636 – $1,182
Heat risk 2/10 · Minimal
- Hot days now (above 97°F)
- 7 days/yr
- Hot days in 30 yrs
- 13 days/yr
Wind risk 2/10 · Minimal
- Chance of severe wind over 30 yrs
- —
Air-quality risk 2/10 · Minimal
- Unhealthy air days now
- 1 days/yr
- Unhealthy air days in 30 yrs
- 1 days/yr
Risk factors via First Street. Map © Google.
Why this score? — see what drove the D- grade
The composite is a weighted blend of 9 inputs, each scored 0–100. Each bar is that input's sub-score; the figure is the points it added to the 100-point composite (weight × sub-score).
- Cash flow +17.0/30.0
- DSCR +5.3/10.0
- 1% rule +4.6/10.0
- Livability +4.2/5.0
- Rent growth +3.2/5.0
- Schools +2.9/10.0
- Condition / age +2.5/5.0
- ARV discount +0.0/15.0
- Appreciation +0.0/10.0
$289,900
🖨 Deal sheet 📄 Offer letter ✓ Due diligence
Multi-family units
County records classify this as Multi-Family (2-4 Unit). Listing-text estimate: 2 units. confirmed
Listing remarks MLS
South side spacious duplex. This property presents a prime opportunity for either investment or owner occupancy. The property features independent utilities, along with a separate garage and a total of 5 outdoor parking spaces that offers plenty of parking. A spacious basement equipped with laundry facilities, Oversized rooms with ample storage throughout. A must see.
Key facts
- Laundry facilities
- Separate garage
- Spacious basement
Tags
Neighborhood map
What this means for you Summary
Snapshot
- This is a 2 × 2-bed/1.0-bath units multifamily listed at $290k.
Deal economics
- At list price, monthly cash flow is $197 ($2k/yr) — positive. Per door: $98/mo.
- The deal already cash-flows at list — no discount required.
- To meet the 1% rule (rent ≥ 1% of price), the offer needs to be $277k (4.4% below list).
- Recommended offer: $273k (6.0% below list) — sets the bar for market timing.
- Cap rate 7.1% vs local median 3.7% in Oshkosh — top-decile yield for the area; either an underpriced asset or a hidden risk that comps aren't pricing in. Stress-test before assuming the spread holds.
Location & tenants
- Location reads 85/100 on livability (#29 in WI, #574 nationally) — a professional / high-income tenant draw. Strengths: cost of living A+, housing A+, health & safety A+.
- Oshkosh Area School District (urban): math 33% / reading 34% proficiency, ranked #246 of 342 in WI (top 72%) — families likely to look elsewhere, expect single-tenant / working-renter base with shorter leases.
- Market conditions: Rents rising (+2.6%/yr); 44 active listings in the ZIP; 5 comparable units currently listed for rent nearby; rentals at typical pace (median 21d on market — plan ~3-4 weeks tenant-placement turnaround); 40% of comp listings sitting > 30 days — soft ceiling on asking rent; 652 units permitted in Winnebago County in 2024 (333 in 5+ unit buildings).
- At $2,770/mo this rent would consume 51% of the median local household income ($66k/yr) (locally 873% of renters already pay >50% of income on rent) — very limited rent-growth headroom before tenants either downsize or default.
Forward outlook
- Local home prices are declining (-3.0%/yr); year-one equity from $2k of loan paydown is wiped out by about $9k of value loss. Plan a longer hold.
- Winnebago County population projected at +3% by 2050 — modest demand growth; plan on rents tracking national, not racing it.
Negotiation context
- It's been on market 79 days — a 6% lower offer ($273k) is reasonable based on typical stale-listing flexibility.
Questions for the listing agent
- It's been on market 79 days. Have you received any prior offers? Is the seller open to a 6% concession, seller financing, or rate buy-down credit?
- Can we see the unit-by-unit rent roll, current vacancy, and any below-market leases? What's the average tenancy length?
- What capital expenditures (roof, boiler, parking lot, exteriors) have been made in the last 5 years, and what's planned in the next 2?
- Built in 1976 — when were the roof, HVAC, electrical panel, plumbing, and water heater last replaced?
- Why hasn't it sold? Are there any deal-killer items the seller is aware of (foundation, flood, title, zoning, code violations)?
- Is there a deadline driving the sale (1031 exchange, divorce, estate, relocation)? That informs how much negotiation room exists.
- The area grade is low — what's the realistic commute time and amenity access for the typical tenant pool here? Any planned neighborhood developments (good or bad) we should know about?
- What's the average days-on-market for RENTAL listings here right now (not sales)? A rising rental-DOM trend means longer vacancies and softer asking-rent achievability than the comps imply.
- What's the recent tenant-quality profile in this submarket — average credit score on applications, eviction rate, late-payment / NSF rate, and stable-employment percentage? A property-management company in the area should have these aggregated.
- How much new apartment / multifamily construction is in the pipeline within 1–3 miles? Heavy new supply (>2% of stock underway) typically softens rents 12–24 months out; light construction supports rent growth.
Investment metrics
- 1% rule
- 0.96% ✗
- Cap rate
- 7.11%
- Cash-on-cash
- 2.91%
- DSCR
- 1.13
- GRM
- 8.7
CMA / ARV
- ARV (median comp)
- $215,000
- List price
- $289,900
- Delta
- 34.84%
- Verdict
- OVERPRICED
- Comps
- 17 within 1.0 mi
Show comp detail 3 sales within ~0.75 mi
| Address | Dist | Beds/Ba | Sqft | Sold | Price | $/sf | Match |
|---|---|---|---|---|---|---|---|
| 220 Guenther St | 0.26mi | 4/2.0 | 2,520 (+3%) | 6mo | $244,000 | $97 | 78 |
| 214 Guenther St | 0.27mi | 4/2.0 | 2,520 (+3%) | 6mo | $244,000 | $97 | 77 |
| 503 W 5th Ave | 0.55mi | 5/3.0 (+1) | 2,093 (-14%) | 14mo | $244,000 | $117 | 30 |
Match score weights: distance 35% · size 25% · config 20% · recency 20%. Top-matched comps best support the ARV.
Projected returns pro-forma
-3.0% appreciation · 2.6% rent growth · sell at horizon
- IRR
- -12.1%
- Equity multiple
- 0.56×
- Total profit
- $-35,508
- Equity at exit
- $43,225
- IRR
- -3.6%
- Equity multiple
- 0.76×
- Total profit
- $-19,148
- Equity at exit
- $25,065
Cash invested: $81,172 (down + closing). Projections, not guarantees.
Landlord ↔ Tenant lean methodology
- Overall (STATE)
- 73 Landlord-Friendly
- State Wisconsin
- 73 Landlord-Friendly · R+2
- County
- — inherits STATE
- City
- — inherits STATE
ZIP-level market 54902
- Rents YoY
- 2.6%
- Active inventory
- 44
- Price-to-rent
- 17.4×
Monthly cashflow live
- Estimated rent
- $2,770 high interval (Pro) →
- Mortgage (P&I)
- −$1,520
- Tax from tax record
- −$350 /mo · $4,203/yr
- Insurance
- −$121
- HOA
- −$0
- Vacancy / Maint / Mgmt
- −$582
- Net cashflow
- $197
Break-even live
2-unit breakdown (identical units grouped — click to expand)
| Units | Beds | Baths | Est. rent |
|---|---|---|---|
| 2× units | 2 | 1 | $2,770 |
| #1 | 2 | 1 | $1,385 |
| #2 | 2 | 1 | $1,385 |
| Total (2 units) | $2,770 | ||
UW: 25.0% down · 7.5% · 30yr · 1.5% tax · 5.0% vac · 8.0% maint · 8.0% mgmt
Financing live
Cash to close
- Down payment
- $72,475
- Closing costs
- $8,697
- Reserves months
- —
- Total cash needed
- —
Loan-product check · same deal, 3 products live
Conventional
25% down · 7.5% · 30yr
- Down + closing
- —
- Monthly P&I
- —
- Monthly cashflow
- —
- DSCR
- —
- Eligible?
- —
Personal DTI + credit; lowest rate.
DSCR
20% down · 8.5% · 30yr
- Down + closing
- —
- Monthly P&I
- —
- Monthly cashflow
- —
- DSCR
- —
- Eligible?
- —
No personal income docs; deal must DSCR.
Hard money
10% down · 12.0% · 12mo
- Down + closing
- —
- Monthly P&I
- —
- Monthly cashflow
- —
- DSCR
- —
- Eligible?
- —
Short-term bridge; refi at stabilization.
Rent comps 5 comps
| Address | Beds | Baths | Sqft | Rent | $/sqft | DOM | Units | Dist |
|---|---|---|---|---|---|---|---|---|
| 953 W 6th Ave Unit NA Oshkosh, WI | 4.0 | 2.0 | 1800 | $1,748 | $0.97 | 21d | 1 | 0.13mi |
| 904 W 8th Ave Oshkosh, WI | 3.0 | 1.0 | 1759 | $1,600 | $0.91 | 13d | 1 | 0.18mi |
| 101 Algoma Blvd Unit 1332436P Oshkosh, WI | 3.0 | 1.5 | 2798 | $3,092 | $1.11 | 43d | 1 | 1.17mi |
| 733 Wright St Oshkosh, WI | 5.0 | 2.0 | 1642 | $2,200 | $1.34 | 43d | 1 | 1.18mi |
| 685 Franklin St Unit B Oshkosh, WI | 4.0 | 2.0 | 1721 | $1,700 | $0.99 | 21d | 1 | 1.20mi |
Listing history 18 events
-
2026-06-19days on market $289,900 Active 79 DOM
-
2026-06-18days on market $289,900 Active 78 DOM
-
2026-06-17days on market $289,900 Active 77 DOM
-
2026-06-16days on market $289,900 Active 76 DOM
-
2026-06-15days on market $289,900 Active 75 DOM
-
2026-06-14days on market $289,900 Active 73 DOM
-
2026-06-13statusdays on market $289,900 Active 72 DOM
-
2026-06-10days on market $289,900 Active w/ Contract 70 DOM
-
2026-06-09days on market $289,900 Active w/ Contract 69 DOM
-
2026-06-08days on market $289,900 Active w/ Contract 68 DOM
-
2026-06-07days on market $289,900 Active w/ Contract 67 DOM
-
2026-06-02days on market $289,900 Active w/ Contract 62 DOM
-
2026-06-01days on market $289,900 Active w/ Contract 61 DOM
-
2026-05-31days on market $289,900 Active w/ Contract 60 DOM
-
2026-05-30days on market $289,900 Active w/ Contract 59 DOM
-
2026-05-05historical Active w/ Contract 371-char remark
Show marketing remark (371 chars)
South side spacious duplex. This property presents a prime opportunity for either investment or owner occupancy. The property features independent utilities, along with a separate garage and a total of 5 outdoor parking spaces that offers plenty of parking. A spacious basement equipped with laundry facilities, Oversized rooms with ample storage throughout. A must see.
-
2026-04-24price $289,900 371-char remark
Show marketing remark (371 chars)
South side spacious duplex. This property presents a prime opportunity for either investment or owner occupancy. The property features independent utilities, along with a separate garage and a total of 5 outdoor parking spaces that offers plenty of parking. A spacious basement equipped with laundry facilities, Oversized rooms with ample storage throughout. A must see.
-
2026-03-31$299,900 Active 371-char remark
Show marketing remark (371 chars)
South side spacious duplex. This property presents a prime opportunity for either investment or owner occupancy. The property features independent utilities, along with a separate garage and a total of 5 outdoor parking spaces that offers plenty of parking. A spacious basement equipped with laundry facilities, Oversized rooms with ample storage throughout. A must see.
ⓘ Source: listings_history table (triggers on properties + properties_extension) + one-shot
backfill from property_details.listing_events for pre-trigger history.
Tax reassessment forecast WI · Partial reset (capped growth)
- Current annual tax
- $4,203 · $350/mo
- Projected year-2 tax
- $4,783 · $399/mo
- Expected delta
- +$580/yr (+$48/mo · 13.8%)
ⓘ Screening estimate from a state-policy table — verify with the county assessor before closing.
Climate risk First Street
- Flood 1/10 Low FEMA zone X (unshaded) · 0% chance over 30 yrs
- Wildfire 1/10 Low
- Heat 2/10 Low 7 d/yr ≥97°F today · 13 d/yr by 30 yrs out
- Wind 2/10 Low
- Air quality 2/10 Low 1 unhealthy d/yr today · 1 by 30 yrs out
Nearby sold comps map
Loading sold comps map…
Walkable amenities ~0.75 mi
Loading nearby amenities…
Taxation est. · year 1
- Rental income
- $33,240
- − Mortgage interest
- −$16,239
- − Property taxes
- −$4,203
- − Insurance
- −$1,450
- − Repairs & maintenance
- −$2,659
- − Management
- −$2,659
- − Depreciation
- −$8,433
- Taxable loss
- −$2,404
- Est. tax savings @ 24.0%
- +$577
- After-tax cash flow
- $2,940/yr
For passive investors: Depreciation is non-cash, so a rental often shows a tax loss while cash-flowing — sheltering income. Rental losses are passive: they offset passive income freely, and up to $25,000/yr can offset ordinary (W-2) income if you actively participate and your MAGI is under $100k (phasing out to $0 by $150k); unused losses carry forward. On sale, claimed depreciation is recaptured at up to 25%, and gains may owe capital-gains tax (a 1031 exchange can defer both). Figures are a year-1 estimate at your 24.0% rate — not tax advice; consult a CPA.
Schools (NCES district)
- District
- Oshkosh Area School District
- NCES district ID
- 5511190
- Math proficiency
- 33% ▼ -7.00%
- Reading proficiency
- 34% ▼ -2.00%
- Median HH income
- $48,048
- Composite
- 28.92/100
- National rank
- #6634
- State rank
- #246 of 342 in WI
Livability — Oshkosh
- Score
- 85/100
- State rank
- #29
- US rank
- #574
Category grades
Schools grade is shown separately in the Schools card above.
Census & demographics
- Census place
- Oshkosh, WI
- County
- Winnebago County · 155,689 people
- City population
- 81,810
- Metro
- Oshkosh-Neenah, WI
- Population (ZIP)
- 22,243
- Household income
- $65,612
- Rent vs Own
- Severe rent burden
- 873.0
Population outlook (Winnebago County) Hauer SSP2
- Today (2025)
- 175,480 people
- By 2030
- 177,928 · +1.4%
- By 2040
- 180,873 · +3.1%
- By 2050
- 181,302 · +3.3%
- By 2075
- 184,071 · +4.9%
- By 2100
- 175,932 · +0.3%
Race, ethnicity, and origin ACS 2023
- Neighborhood character
- Predominantly White (84%)
- Race & ethnicity
- White 84% Two or more races 7% Asian 4% Hispanic / Latino 3% Black 3%
- Common ancestry
- Romanian 6% Portuguese 4% Lithuanian 3%
- Foreign-born
- 2% · Canada, China
- Languages at home
- 95% English-only · Other Asian/Pacific 2% Spanish 2%
Political lean MEDSL · Winnebago
- 2024 margin
- Toss-up / Even · D 46.9% · R 51.7% · Other 1.4%
- 2008→2024 swing
- -16.4pp toward R · 2008: 11.7pp · 2024: -4.8pp
- All cycles
- 2024: R+4.8 2020: R+4.0 2016: R+7.4 2012: D+3.8 2008: D+11.7
Not yet ingested
- Civics
- —
Market trends
- HPI YoY
- ▼ -122.03%
- Current HPI
- 187.4917
- Rent YoY
- ▲ 2.60%
- Metro
- Oshkosh-Neenah, WI
- State GDP YoY
- ▲ 2.10%
- F500 in state
- 20
Industry mix (Fortune 500 HQ in WI)
| Industry | F500 HQs | Revenue |
|---|---|---|
| Industrial Machinery | 4 | $23B |
|
||
| Industrial Technology | 2 | $36B |
|
||
| Insurance | 1 | $36B |
|
||
| Professional Services | 1 | $19B |
|
||
| Utilities | 1 | $9B |
|
||
| Consumer Goods | 1 | $3B |
|
||
Price history
-3.3% since first listed3 events — show timeline
- 2026-05-05 Contingent — RANW
- 2026-04-24 Price Changed $289,900 RANW
- 2026-03-31 Listed $299,900 RANW
Property tax history
+2.6%/yrLatest (2024): $4,203 · +9.1% YoY. Source: county tax records.
Cash-flow waterfall
monthlySold comps — $/sqft
last 12 mo · ≤1 miLoading sold comps…