 Fourplex
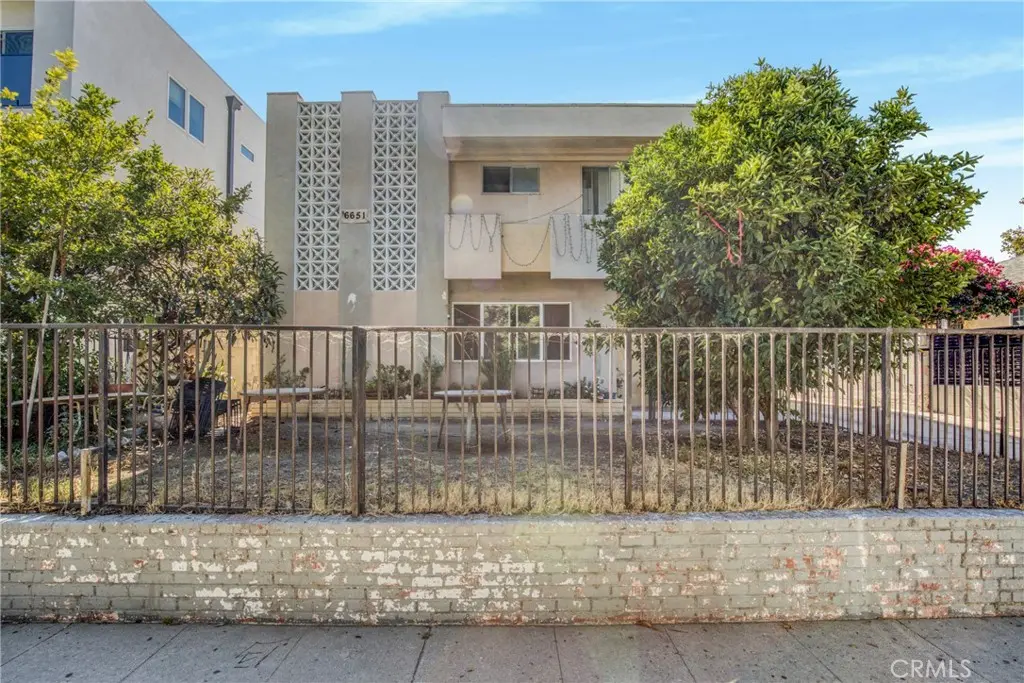
6651 Beck · Los Angeles, CA
Flood risk 1/10 · Minimal
- FEMA flood zone
- X (unshaded)
- Chance of flooding over 30 yrs
- 0.0%
- Est. flood insurance / yr
- $507 – $1,088
Fire risk 1/10 · Minimal
- Est. fire insurance / yr
- $659 – $1,223
Heat risk 6/10 · Moderate
- Hot days now (above 96°F)
- 7 days/yr
- Hot days in 30 yrs
- 21 days/yr
Wind risk 1/10 · Minimal
- Chance of severe wind over 30 yrs
- —
Air-quality risk 5/10 · Moderate
- Unhealthy air days now
- 7 days/yr
- Unhealthy air days in 30 yrs
- 9 days/yr
Risk factors via First Street. Map © Google.
Why this score? — see what drove the D+ grade
The composite is a weighted blend of 9 inputs, each scored 0–100. Each bar is that input's sub-score; the figure is the points it added to the 100-point composite (weight × sub-score).
- Cash flow +18.8/30.0
- ARV discount +10.1/15.0
- DSCR +5.9/10.0
- 1% rule +4.0/10.0
- Schools +3.6/10.0
- Livability +3.4/5.0
- Condition / age +2.5/5.0
- Rent growth +1.7/5.0
- Appreciation +0.0/10.0
$1,550,000
🖨 Deal sheet 📄 Offer letter ✓ Due diligence
Multi-family units
County records classify this as Multi-Family (5+ Unit). Listing-text estimate: 4 units. estimate disagrees with records
5+ unit building — per-unit beds/baths from public records are typically unavailable; the breakdown below (if shown) is an estimate from the listing text.
Listing remarks MLS
Prime North Hollywood Investment Opportunity! Looking for a solid real estate investment? This fully rented * * six-unit apartment building * * offers immediate cash flow with the potential to * * increase rent to market rates * * . Excellent location near * * shopping centers, major freeways, and the Burbank airport * * - perfect for tenants seeking convenience. Stable, income-producing property with * * growth potential * * . Ideal for investors looking to expand their portfolio in a thriving North Hollywood market. Don't miss out on this opportunity to secure a high-demand property in a prime area! Contact us today to schedule a private showing and start maximizing your investment.
Key facts
- High-demand property
- Shopping centers
- Major freeways
Tags
Neighborhood map
What this means for you Summary
Snapshot
- This is a 4 × 2-bed/?-bath units multifamily listed at $1.55M.
Deal economics
- At list price, monthly cash flow is $2k ($19k/yr) — positive. Per door: $389/mo.
- The deal already cash-flows at list — no discount required.
- To meet the 1% rule (rent ≥ 1% of price), the offer needs to be $1.40M (9.8% below list).
- Recommended offer: $1.40M (9.8% below list) — sets the bar for 1% rule.
- Cap rate 7.5% vs local median 2.1% in Los Angeles — top-decile yield for the area; either an underpriced asset or a hidden risk that comps aren't pricing in. Stress-test before assuming the spread holds.
Location & tenants
- Location reads 68/100 on livability (#273 in CA) — a middle-class / working-renter tenant base. Strengths: amenities A+, commute A+, employment B; Watch: health & safety C-, schools D+, crime F.
- Los Angeles Unified (urban): math 29% / reading 54% proficiency, ranked #223 of 517 in CA (top 43%) — families likely to look elsewhere, expect single-tenant / working-renter base with shorter leases; 67% free/reduced lunch — lower-income household profile, screen leases tightly.
- Market conditions: Rents falling (-3.1%/yr); 98 active listings in the ZIP; 19,697 units permitted in Los Angeles County in 2024 (9,426 in 5+ unit buildings).
- At $13,982/mo this rent would consume 253% of the median local household income ($66k/yr) (locally 3946% of renters already pay >50% of income on rent) — very limited rent-growth headroom before tenants either downsize or default.
Forward outlook
- Local home prices are declining (-3.0%/yr); year-one equity from $11k of loan paydown is wiped out by about $46k of value loss. Plan a longer hold.
- Los Angeles County population projected at +9% by 2050 — modest demand growth; plan on rents tracking national, not racing it.
Negotiation context
- It's been on market 104 days — a 9% lower offer ($1.41M) is reasonable based on typical stale-listing flexibility.
- 3 sale attempts with the ask held roughly flat each time — persistent listings suggest the price (not the market) is what's stuck; bring a comps-based counter.
- Current owner paid $425k; list at $1.55M implies a 265% gain — meaningful room to come down on a strong offer.
Risks & watch-outs
- Climate carrying-cost: extreme-heat days projected 7→21/yr by 2055 (HVAC capex compounding) — expect insurance premiums to compound above CPI over the hold.
Questions for the listing agent
- It's been on market 104 days. Have you received any prior offers? Is the seller open to a 10% concession, seller financing, or rate buy-down credit?
- Can we see the unit-by-unit rent roll, current vacancy, and any below-market leases? What's the average tenancy length?
- What capital expenditures (roof, boiler, parking lot, exteriors) have been made in the last 5 years, and what's planned in the next 2?
- Built in 1961 — when were the roof, HVAC, electrical panel, plumbing, and water heater last replaced?
- Why hasn't it sold? Are there any deal-killer items the seller is aware of (foundation, flood, title, zoning, code violations)?
- Is there a deadline driving the sale (1031 exchange, divorce, estate, relocation)? That informs how much negotiation room exists.
- Schools are D-rated, which usually means shorter tenancies and higher turnover. Who's the typical renter profile here, and what's been the actual vacancy rate?
- Crime grade is F in this area — have there been break-ins, vandalism, or insurance claims at this property in the last 3 years? What carrier currently insures it and at what premium?
- The area grade is low — what's the realistic commute time and amenity access for the typical tenant pool here? Any planned neighborhood developments (good or bad) we should know about?
- What's the average days-on-market for RENTAL listings here right now (not sales)? A rising rental-DOM trend means longer vacancies and softer asking-rent achievability than the comps imply.
- What's the recent tenant-quality profile in this submarket — average credit score on applications, eviction rate, late-payment / NSF rate, and stable-employment percentage? A property-management company in the area should have these aggregated.
- How much new apartment / multifamily construction is in the pipeline within 1–3 miles? Heavy new supply (>2% of stock underway) typically softens rents 12–24 months out; light construction supports rent growth.
Investment metrics
- 1% rule
- 0.90% ✗
- Cap rate
- 7.50%
- Cash-on-cash
- 4.31%
- DSCR
- 1.19
- GRM
- 9.2
CMA / ARV
- ARV (median comp)
- $1,643,545
- List price
- $1,550,000
- Delta
- -5.69%
- Verdict
- FAIR
- Comps
- 20 within 1.0 mi
Projected returns pro-forma
-3.0% appreciation · 0.0% rent growth · sell at horizon
- IRR
- -12.7%
- Equity multiple
- 0.55×
- Total profit
- $-193,456
- Equity at exit
- $231,110
- IRR
- -8.5%
- Equity multiple
- 0.54×
- Total profit
- $-201,240
- Equity at exit
- $134,016
Cash invested: $434,000 (down + closing). Projections, not guarantees.
Landlord ↔ Tenant lean methodology
- Overall (CITY)
- 0 Strongly Tenant-Friendly
- State California
- 18 Strongly Tenant-Friendly · D+13
- County
- — inherits STATE
- City Los Angeles
- 0 Strongly Tenant-Friendly · D+22
ZIP-level market 91606
- Rents YoY
- -3.1%
- Active inventory
- 98
- Price-to-rent
- 37.0×
Monthly cashflow live
- Estimated rent
- $13,982 high interval (Pro) →
- Mortgage (P&I)
- −$8,128
- Tax from tax record
- −$714 /mo · $8,563/yr
- Insurance
- −$646
- HOA
- −$0
- Vacancy / Maint / Mgmt
- −$2,936
- Net cashflow
- $1,558
Break-even live
4-unit breakdown (identical units grouped — click to expand)
| Units | Beds | Baths | Est. rent |
|---|---|---|---|
| 4× units | 2 | — | $13,980 |
| #1 | 2 | — | $3,495 |
| #2 | 2 | — | $3,495 |
| #3 | 2 | — | $3,495 |
| #4 | 2 | — | $3,495 |
| Total (4 units) | $13,982 | ||
UW: 25.0% down · 7.5% · 30yr · 1.5% tax · 5.0% vac · 8.0% maint · 8.0% mgmt
Financing live
Cash to close
- Down payment
- $387,500
- Closing costs
- $46,500
- Reserves months
- —
- Total cash needed
- —
Loan-product check · same deal, 3 products live
Conventional
25% down · 7.5% · 30yr
- Down + closing
- —
- Monthly P&I
- —
- Monthly cashflow
- —
- DSCR
- —
- Eligible?
- —
Personal DTI + credit; lowest rate.
DSCR
20% down · 8.5% · 30yr
- Down + closing
- —
- Monthly P&I
- —
- Monthly cashflow
- —
- DSCR
- —
- Eligible?
- —
No personal income docs; deal must DSCR.
Hard money
10% down · 12.0% · 12mo
- Down + closing
- —
- Monthly P&I
- —
- Monthly cashflow
- —
- DSCR
- —
- Eligible?
- —
Short-term bridge; refi at stabilization.
Listing history 26 events
-
2026-06-18days on market $1,550,000 Active 104 DOM
-
2026-06-17days on market $1,550,000 Active 103 DOM
-
2026-06-16days on market $1,550,000 Active 102 DOM
-
2026-06-15days on market $1,550,000 Active 101 DOM
-
2026-06-13days on market $1,550,000 Active 99 DOM
-
2026-06-09days on market $1,550,000 Active 95 DOM
-
2026-06-08days on market $1,550,000 Active 94 DOM
-
2026-06-07days on market $1,550,000 Active 93 DOM
-
2026-06-04days on market $1,550,000 Active 90 DOM
-
2026-06-03days on market $1,550,000 Active 89 DOM
-
2026-06-02days on market $1,550,000 Active 88 DOM
-
2026-06-01days on market $1,550,000 Active 87 DOM
-
2026-05-31days on market $1,550,000 Active 86 DOM
-
2026-03-06$1,599,999 Active 707-char remark
Show marketing remark (707 chars)
Prime North Hollywood Investment Opportunity! Looking for a solid real estate investment? This fully rented * * six-unit apartment building * * offers immediate cash flow with the potential to * * increase rent to market rates * * . Excellent location near * * shopping centers, major freeways, and the Burbank airport * * - perfect for tenants seeking convenience. Stable, income-producing property with * * growth potential * * . Ideal for investors looking to expand their portfolio in a thriving North Hollywood market. Don't miss out on this opportunity to secure a high-demand property in a prime area! Contact us today to schedule a private showing and start maximizing your investment.
-
2026-03-04historical
-
2026-02-28price $1,599,999
-
2026-01-05price $1,699,999
-
2025-11-26price $1,785,000
-
2025-10-06$1,835,000 Active
-
2025-10-03historical
-
2025-08-11$1,850,000 Active
-
2002-09-10soldstatus $425,000
-
2001-12-12soldstatus $310,000
-
1996-10-01soldstatus $190,000
-
1988-10-07soldstatus $370,000
-
1983-08-26soldstatus $131,000
ⓘ Source: listings_history table (triggers on properties + properties_extension) + one-shot
backfill from property_details.listing_events for pre-trigger history.
Tax reassessment forecast CA · Resets to sale price
- Current annual tax
- $8,563 · $714/mo
- Projected year-2 tax
- $11,780 · $982/mo
- Expected delta
- +$3,217/yr (+$268/mo · 37.6%)
ⓘ Screening estimate from a state-policy table — verify with the county assessor before closing.
Climate risk First Street
- Flood 1/10 Low FEMA zone X (unshaded) · 0% chance over 30 yrs
- Wildfire 1/10 Low
- Heat 6/10 Major 7 d/yr ≥96°F today · 21 d/yr by 30 yrs out
- Wind 1/10 Low
- Air quality 5/10 Major 7 unhealthy d/yr today · 9 by 30 yrs out
Nearby sold comps map
Loading sold comps map…
Walkable amenities ~0.75 mi
Loading nearby amenities…
Taxation est. · year 1
- Rental income
- $167,784
- − Mortgage interest
- −$86,824
- − Property taxes
- −$8,563
- − Insurance
- −$7,750
- − Repairs & maintenance
- −$13,423
- − Management
- −$13,423
- − Depreciation
- −$45,091
- Taxable loss
- −$7,290
- Est. tax savings @ 24.0%
- +$1,750
- After-tax cash flow
- $20,445/yr
For passive investors: Depreciation is non-cash, so a rental often shows a tax loss while cash-flowing — sheltering income. Rental losses are passive: they offset passive income freely, and up to $25,000/yr can offset ordinary (W-2) income if you actively participate and your MAGI is under $100k (phasing out to $0 by $150k); unused losses carry forward. On sale, claimed depreciation is recaptured at up to 25%, and gains may owe capital-gains tax (a 1031 exchange can defer both). Figures are a year-1 estimate at your 24.0% rate — not tax advice; consult a CPA.
Schools (NCES district)
- District
- Los Angeles Unified
- NCES district ID
- 0622710
- Math proficiency
- 29% ▼ -4.00%
- Reading proficiency
- 54% ▲ 10.00%
- Median HH income
- $50,403
- Composite
- 35.67/100
- National rank
- #4875
- State rank
- #223 of 517 in CA
Livability — Los Angeles
- Score
- 68/100
- State rank
- #273
- US rank
- #9237
Category grades
Schools grade is shown separately in the Schools card above.
Census & demographics
- Census place
- Los Angeles, CA
- County
- Los Angeles County · 9,444,647 people
- City population
- 3,838,149
- Metro
- Los Angeles-Long Beach-Anaheim, CA
- Population (ZIP)
- 43,559
- Household income
- $66,200
- Rent vs Own
- Severe rent burden
- 3946.0
Population outlook (Los Angeles County) Hauer SSP2
- Today (2025)
- 10,940,515 people
- By 2030
- 11,256,481 · +2.9%
- By 2040
- 11,729,929 · +7.2%
- By 2050
- 11,948,407 · +9.2%
- By 2075
- 11,818,114 · +8.0%
- By 2100
- 10,842,928 · -0.9%
Race, ethnicity, and origin ACS 2023
- Neighborhood character
- Diverse neighborhood (Simpson 0.60)
- Race & ethnicity
- Hispanic / Latino 53% White 33% Two or more races 19% Asian 5% Black 5% Native American 1%
- Hispanic origin (detail)
- Mexican 28%
- Common ancestry
- Scotch-Irish 2% Romanian 1% Subsaharan African 1%
- Foreign-born
- 43% · Canada, Vietnam, Jamaica
- Languages at home
- 32% English-only · Spanish 47% Other Indo-European 12% Russian/Polish/Slavic 3%
Political lean MEDSL · Los Angeles
- 2024 margin
- Solid D (+32.9) · D 64.8% · R 31.9% · Other 3.3%
- 2008→2024 swing
- -7.4pp toward R · 2008: 40.4pp · 2024: 32.9pp
- All cycles
- 2024: D+32.9 2020: D+44.2 2016: D+48.0 2012: D+40.0 2008: D+40.4
Not yet ingested
- Civics
- —
Market trends
- HPI YoY
- ▼ -1100.02%
- Current HPI
- 493.8996
- Rent YoY
- ▼ -3.12%
- Metro
- Los Angeles-Long Beach-Anaheim, CA
- State GDP YoY
- ▲ 3.21%
- F500 in state
- 116
Industry mix (Fortune 500 HQ in CA)
| Industry | F500 HQs | Revenue |
|---|---|---|
| Technology | 27 | $1,492B |
|
||
| Financial Services | 3 | $174B |
|
||
| Retail | 3 | $44B |
|
||
| Insurance | 3 | $26B |
|
||
| Media / Entertainment | 2 | $115B |
|
||
| Pharmaceuticals / Biotech | 2 | $62B |
|
||
Price history
+1121.4% since first listed13 events — show timeline
- 2026-03-06 Listed $1,599,999 CRMLS
- 2026-03-04 Listing Removed — CRMLS
- 2026-02-28 Price Changed $1,599,999 CRMLS
- 2026-01-05 Price Changed $1,699,999 CRMLS
- 2025-11-26 Price Changed $1,785,000 CRMLS
- 2025-10-06 Listed $1,835,000 CRMLS
- 2025-10-03 Listing Removed — CRMLS
- 2025-08-11 Listed $1,850,000 CRMLS
- 2002-09-10 Sold (Public Records) $425,000 Public Records
- 2001-12-12 Sold (Public Records) $310,000 Public Records
- 1996-10-01 Sold (Public Records) $190,000 Public Records
- 1988-10-07 Sold (Public Records) $370,000 Public Records
- 1983-08-26 Sold (Public Records) $131,000 Public Records
Property tax history
+1.8%/yrLatest (2025): $8,563 · +1.8% YoY. Source: county tax records.
Cash-flow waterfall
monthlySold comps — $/sqft
last 12 mo · ≤1 miLoading sold comps…