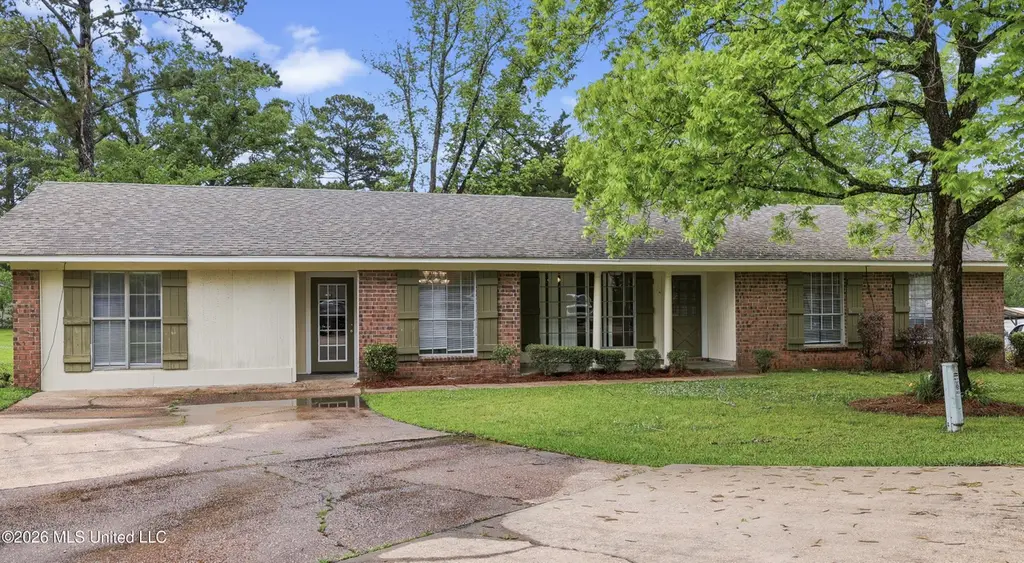
110 Dickson Dr · Brandon, MS
Flood risk 1/10 · Minimal
- FEMA flood zone
- X (unshaded)
- Chance of flooding over 30 yrs
- 0.0%
- Est. flood insurance / yr
- $507 – $1,088
Fire risk 4/10 · Minor
- Est. fire insurance / yr
- $1,241 – $2,305
Heat risk 7/10 · Major
- Hot days now (above 108°F)
- 7 days/yr
- Hot days in 30 yrs
- 20 days/yr
Wind risk 8/10 · Major
- Chance of severe wind over 30 yrs
- 80.0%
Air-quality risk 2/10 · Minimal
- Unhealthy air days now
- 1 days/yr
- Unhealthy air days in 30 yrs
- 1 days/yr
Risk factors via First Street. Map © Google.
Why this score? — see what drove the C+ grade
The composite is a weighted blend of 9 inputs, each scored 0–100. Each bar is that input's sub-score; the figure is the points it added to the 100-point composite (weight × sub-score).
- Cash flow +21.4/30.0
- ARV discount +15.0/15.0
- DSCR +6.8/10.0
- 1% rule +5.4/10.0
- Schools +4.6/10.0
- Rent growth +4.3/5.0
- Livability +4.0/5.0
- Condition / age +2.5/5.0
- Appreciation +0.0/10.0
$185,000
🖨 Deal sheet 📄 Offer letter ✓ Due diligence
Listing remarks MLS
Great home sold AS-IS. Home needs a little TLC but will make a great investment. 3 bed 2 bath home with living room, dining area and eat in kitchen. Large backyard. First time home owner to an investor this home will make a great investment.
Key facts
- Ample cabinet space
- Spacious layout
- Conveniently located
Tags
Property features AI
Exterior
- Utilities: Public water; Public sewer; Cable available; Electricity available; Phone available
- Home design: Single-family house; One story; Move-in ready
- Construction: Brick construction; Brick/mortar foundation; Architectural shingle (asphalt) roof; Built in public records (year built from public records)
- Exterior features: Deck
Interior
- Kitchen: Dishwasher; Electric cooktop
- Flooring: Ceramic tile; Vinyl
- Bathrooms: 2 full bathrooms
- Heating & cooling: Central heating (electric); Fireplace heating; Central air conditioning
- Interior features: Entrance foyer; Fireplace in the living room
Neighborhood map
What this means for you Summary
Snapshot
- This is a 3-bed/1.0-bath single-family listed at $185k.
Deal economics
- At list price, monthly cash flow is $273 ($3k/yr) — positive.
- The deal already cash-flows at list — no discount required.
- Meets the 1% rule at list price ($2k rent vs $185k).
- Cap rate 8.1% vs local median 4.2% in Brandon — top-decile yield for the area; either an underpriced asset or a hidden risk that comps aren't pricing in. Stress-test before assuming the spread holds.
Location & tenants
- Location reads 81/100 on livability (#3 in MS, #1,514 nationally) — a professional / high-income tenant draw. Strengths: crime A+, employment A+, cost of living A+; Watch: amenities F, commute F.
- Rankin County School District (rural): math 56% / reading 48% proficiency, ranked #6 of 130 in MS (top 5%) — acceptable for families but not a draw, mixed tenant base, ~2y average lease.
- Zoned schools: Rouse Elementary (797 students, 100% FRL); Brandon Middle School (math 67% / reading 49%, grade B, #11 of 179 statewide, top 6%, 1,193 students, 100% FRL); Brandon High School (math 47% / reading 49%, grade D, #27 of 197 statewide, top 13%, 1,648 students, 100% FRL) — zoned schools average 100% FRL vs 35% district-wide (65 pts higher); higher-poverty schools than district average — tighter screening recommended.
- Market conditions: Rents rising fast (+7.1%/yr); 302 active listings in the ZIP; 4 comparable units currently listed for rent nearby; rentals at typical pace (median 24d on market — plan ~3-4 weeks tenant-placement turnaround); solid renter incomes; 343 units permitted in Rankin County in 2024 (0 in 5+ unit buildings).
Forward outlook
- Local home prices are declining (-3.0%/yr); year-one equity from $1k of loan paydown is wiped out by about $6k of value loss. Plan a longer hold.
- Rankin County population projected at +17% by 2050 — long-run rental-demand tailwind backs the buy-and-hold thesis.
- At projected returns (-3.0% appreciation + 7.1% rent growth), your $52k cash investment doubles in ~9 years — after that, you're playing with house money.
Negotiation context
- Only 12 days on market — expect competitive offers; lowballing is unlikely to land.
- 7 sale attempts since 26y ago with the ask held roughly flat each time — persistent listings suggest the price (not the market) is what's stuck; bring a comps-based counter.
Risks & watch-outs
- Climate carrying-cost: severe wind risk, 80% chance of damaging wind over 30y; extreme-heat days projected 7→20/yr by 2055 (HVAC capex compounding) — expect insurance premiums to compound above CPI over the hold.
Questions for the listing agent
- Built in 1971 — when were the roof, HVAC, electrical panel, plumbing, and water heater last replaced?
- Is there a deadline driving the sale (1031 exchange, divorce, estate, relocation)? That informs how much negotiation room exists.
- Schools are A-rated — typically a magnet for longer-tenancy family renters. What's the average tenant stay here, and is there a school-zone premium baked into asking?
- What's the average days-on-market for RENTAL listings here right now (not sales)? A rising rental-DOM trend means longer vacancies and softer asking-rent achievability than the comps imply.
- What's the recent tenant-quality profile in this submarket — average credit score on applications, eviction rate, late-payment / NSF rate, and stable-employment percentage? A property-management company in the area should have these aggregated.
- How much new for-sale + rental construction is in the pipeline within 1–3 miles? Heavy new supply typically softens prices + rents 12–24 months out; constrained supply supports both.
Investment metrics
- 1% rule
- 1.04% ✓
- Cap rate
- 8.06%
- Cash-on-cash
- 6.32%
- DSCR
- 1.28
- GRM
- 8.0
CMA / ARV
- ARV (median comp)
- $242,197
- List price
- $185,000
- Delta
- -23.62%
- Verdict
- UNDERPRICED
- Comps
- 20 within 1.0 mi
Show comp detail 12 sales within ~0.75 mi
| Address | Dist | Beds/Ba | Sqft | Sold | Price | $/sf | Match |
|---|---|---|---|---|---|---|---|
| 104 Afton Dr | 0.34mi | 3/2.0 | 1,427 (+1%) | 7mo | $235,000 | $165 | 73 |
| 118 Rollingwood Dr | 0.23mi | 3/2.0 | 1,364 (-4%) | 11mo | $240,000 | $176 | 70 |
| 420 Stoneybrook Dr | 0.25mi | 2/2.0 (-1) | 1,405 (-1%) | 11mo | $250,000 | $178 | 69 |
| 430 Stoneybrook Dr | 0.23mi | 2/2.0 (-1) | 1,448 (+2%) | 10mo | $239,000 | $165 | 68 |
| 100 Rollingwood Dr | 0.41mi | 3/2.0 | 1,511 (+7%) | 1mo | $247,500 | $164 | 65 |
| 321 Busick Well Rd | 0.42mi | 3/2.0 | 1,465 (+3%) | 10mo | $199,900 | $136 | 62 |
| 105 Gayden St | 0.47mi | 3/1.0 | 1,350 (-5%) | 14mo | $199,900 | $148 | 59 |
| 308 Rollingwood Ave | 0.12mi | 3/3.0 | 1,609 (+14%) | 7mo | $152,000 | $94 | 58 |
| 215 Moss Valley Dr | 0.24mi | 3/2.0 | 1,627 (+15%) | 11mo | $262,000 | $161 | 51 |
| 310 Afton Dr | 0.21mi | 3/2.0 | 1,600 (+13%) | 17mo | $234,900 | $147 | 51 |
| 109 Circle Dr | 0.54mi | 2/1.0 (-1) | 1,206 (-15%) | 10mo | $194,950 | $162 | 36 |
| 160 Provonce Park | 0.67mi | 3/2.0 | 1,618 (+14%) | 19mo | $297,900 | $184 | 26 |
Match score weights: distance 35% · size 25% · config 20% · recency 20%. Top-matched comps best support the ARV.
Projected returns pro-forma
-3.0% appreciation · 7.13% rent growth · sell at horizon
- IRR
- -2.1%
- Equity multiple
- 0.92×
- Total profit
- $-4,228
- Equity at exit
- $27,584
- IRR
- 11.6%
- Equity multiple
- 2.08×
- Total profit
- $56,111
- Equity at exit
- $15,995
Cash invested: $51,800 (down + closing). Projections, not guarantees.
Landlord ↔ Tenant lean methodology
- Overall (STATE)
- 90 Strongly Landlord-Friendly
- State Mississippi
- 90 Strongly Landlord-Friendly · R+11
- County
- — inherits STATE
- City
- — inherits STATE
ZIP-level market 39042
- Home prices YoY
- -34.3%
- Rents YoY
- 7.1%
- Active inventory
- 302
- Price-to-rent
- 8.0×
Monthly cashflow live
- Estimated rent
- $1,932 medium interval (Pro) →
- Mortgage (P&I)
- −$970
- Tax from tax record
- −$206 /mo · $2,474/yr
- Insurance
- −$77
- HOA
- −$0
- Vacancy / Maint / Mgmt
- −$406
- Net cashflow
- $273
Break-even live
UW: 25.0% down · 7.5% · 30yr · 1.5% tax · 5.0% vac · 8.0% maint · 8.0% mgmt
Financing live
Cash to close
- Down payment
- $46,250
- Closing costs
- $5,550
- Reserves months
- —
- Total cash needed
- —
Loan-product check · same deal, 3 products live
Conventional
25% down · 7.5% · 30yr
- Down + closing
- —
- Monthly P&I
- —
- Monthly cashflow
- —
- DSCR
- —
- Eligible?
- —
Personal DTI + credit; lowest rate.
DSCR
20% down · 8.5% · 30yr
- Down + closing
- —
- Monthly P&I
- —
- Monthly cashflow
- —
- DSCR
- —
- Eligible?
- —
No personal income docs; deal must DSCR.
Hard money
10% down · 12.0% · 12mo
- Down + closing
- —
- Monthly P&I
- —
- Monthly cashflow
- —
- DSCR
- —
- Eligible?
- —
Short-term bridge; refi at stabilization.
Rent comps 4 comps
| Address | Beds | Baths | Sqft | Rent | $/sqft | DOM | Units | Dist |
|---|---|---|---|---|---|---|---|---|
| 202 Overby St Brandon, MS | 3.0 | 2.0 | 1394 | $1,786 | $1.28 | 44d | 1 | 1.16mi |
| 114 Fox Meadow Dr Brandon, MS | 3.0 | 2.0 | 1500 | $2,250 | $1.50 | 14d | 1 | 1.20mi |
| 1500 Chapelridge Way Brandon, MS | 3.0 | 2.0 | 1081 | $1,609 | $1.49 | 23d | 1 | 1.35mi |
| 1500 Chapelridge Way Brandon, MS | 2.0 | 2.0 | 921 | $1,399 | $1.52 | 21d | 1 | 1.35mi |
Listing history 17 events
-
2026-05-13status Active 698-char remark
-
2026-05-12status Pending 698-char remark
-
2026-05-05status Active 698-char remark
-
2026-05-04$185,000 Active 698-char remark
-
2026-05-04historical 698-char remark
-
2024-03-22historical $1,645
-
2024-02-22price $1,645
-
2024-02-16price $1,695
-
2024-01-13price $1,750
-
2024-01-07$1,635
-
2021-10-08historical
-
2020-02-04soldstatus
-
2020-01-31soldstatus
Show marketing remark (241 chars)
Great home sold AS-IS. Home needs a little TLC but will make a great investment. 3 bed 2 bath home with living room, dining area and eat in kitchen. Large backyard. First time home owner to an investor this home will make a great investment.
-
2019-12-07$133,900
Show marketing remark (241 chars)
Great home sold AS-IS. Home needs a little TLC but will make a great investment. 3 bed 2 bath home with living room, dining area and eat in kitchen. Large backyard. First time home owner to an investor this home will make a great investment.
-
2009-04-17soldstatus
-
2008-11-28$110,000
-
2000-04-18$92,500
ⓘ Source: listings_history table (triggers on properties + properties_extension) + one-shot
backfill from property_details.listing_events for pre-trigger history.
Tax reassessment forecast MS · Resets to sale price
- Current annual tax
- $2,474 · $206/mo
- Projected year-2 tax
- $2,474 · $206/mo
- Expected delta
- $0/yr ($0/mo · 0.0%)
ⓘ Screening estimate from a state-policy table — verify with the county assessor before closing.
Climate risk First Street
- Flood 1/10 Low FEMA zone X (unshaded) · 0% chance over 30 yrs
- Wildfire 4/10 Moderate
- Heat 7/10 Severe 7 d/yr ≥108°F today · 20 d/yr by 30 yrs out
- Wind 8/10 Severe 80% chance of damaging wind over 30 yrs
- Air quality 2/10 Low 1 unhealthy d/yr today · 1 by 30 yrs out
Nearby sold comps map
Loading sold comps map…
Walkable amenities ~0.75 mi
Loading nearby amenities…
Taxation est. · year 1
- Rental income
- $23,183
- − Mortgage interest
- −$10,363
- − Property taxes
- −$2,474
- − Insurance
- −$925
- − Repairs & maintenance
- −$1,855
- − Management
- −$1,855
- − Depreciation
- −$5,382
- Taxable income
- $330
- Est. tax owed @ 24.0%
- −$79
- After-tax cash flow
- $3,194/yr
For passive investors: Depreciation is non-cash, so a rental often shows a tax loss while cash-flowing — sheltering income. Rental losses are passive: they offset passive income freely, and up to $25,000/yr can offset ordinary (W-2) income if you actively participate and your MAGI is under $100k (phasing out to $0 by $150k); unused losses carry forward. On sale, claimed depreciation is recaptured at up to 25%, and gains may owe capital-gains tax (a 1031 exchange can defer both). Figures are a year-1 estimate at your 24.0% rate — not tax advice; consult a CPA.
Schools (NCES district)
- District
- Rankin County School District
- NCES district ID
- 2803830
- Math proficiency
- 56% ▼ -4.00%
- Reading proficiency
- 48% ▼ -6.00%
- Median HH income
- $61,867
- Composite
- 45.62/100
- National rank
- #2587
- State rank
- #6 of 130 in MS
Livability — Brandon
- Score
- 81/100
- State rank
- #3
- US rank
- #1514
Category grades
Schools grade is shown separately in the Schools card above.
Census & demographics
- Census place
- Brandon, MS
- County
- Rankin County · 123,614 people
- City population
- 79,950
- Metro
- Jackson, MS
- Population (ZIP)
- 39,142
- Household income
- $88,597
- Rent vs Own
- Severe rent burden
- 474.0
Population outlook (Rankin County) Hauer SSP2
- Today (2025)
- 164,317 people
- By 2030
- 171,013 · +4.1%
- By 2040
- 182,723 · +11.2%
- By 2050
- 192,376 · +17.1%
- By 2075
- 209,535 · +27.5%
- By 2100
- 209,534 · +27.5%
Race, ethnicity, and origin ACS 2023
- Neighborhood character
- Predominantly White (75%)
- Race & ethnicity
- White 75% Black 21% Hispanic / Latino 2% Two or more races 2%
- Common ancestry
- Italian 5% Slovak 2% Iranian 2%
- Foreign-born
- 2% · Canada
- Languages at home
- 97% English-only · Spanish 2%
Political lean MEDSL · Rankin
- 2024 margin
- Solid R (+47.1) · D 25.9% · R 73.0% · Other 1.0%
- 2008→2024 swing
- +6.4pp toward D · 2008: -53.5pp · 2024: -47.1pp
- All cycles
- 2024: R+47.1 2020: R+45.4 2016: R+52.9 2012: R+51.9 2008: R+53.5
Not yet ingested
- Civics
- —
Market trends
- HPI YoY
- ▼ -90.04%
- Current HPI
- 172.5248
- Rent YoY
- ▲ 7.13%
- Metro
- Jackson, MS
- State GDP YoY
- —
- F500 in state
- 0
Price history
+100.0% since first listed18 events — show timeline
- 2026-05-19 Pending — MLSU
- 2026-05-13 Relisted — MLSU
- 2026-05-12 Pending — MLSU
- 2026-05-05 Relisted — MLSU
- 2026-05-04 Listing Removed — MLSU
- 2026-05-04 Listed $185,000 MLSU
- 2024-03-22 Rental Removed $1,645 RENTLY
- 2024-02-22 Price Changed $1,645 RENTLY
- 2024-02-16 Price Changed $1,695 RENTLY
- 2024-01-13 Price Changed $1,750 RENTLY
- 2024-01-07 Listed for Rent $1,635 RENTLY
- 2021-10-08 Listing Removed — MLSU
- 2020-02-04 Sold (Public Records) — Public Records
- 2020-01-31 Sold (MLS) — MLSU
- 2019-12-07 Listed $133,900 MLSU
- 2009-04-17 Sold (MLS) — MLSU
- 2008-11-28 Listed $110,000 MLSU
- 2000-04-18 Listed $92,500 MLSU
Property tax history
+11.4%/yrLatest (2025): $2,474 · +1.4% YoY. Source: county tax records.
Cash-flow waterfall
monthlySold comps — $/sqft
last 12 mo · ≤1 miLoading sold comps…