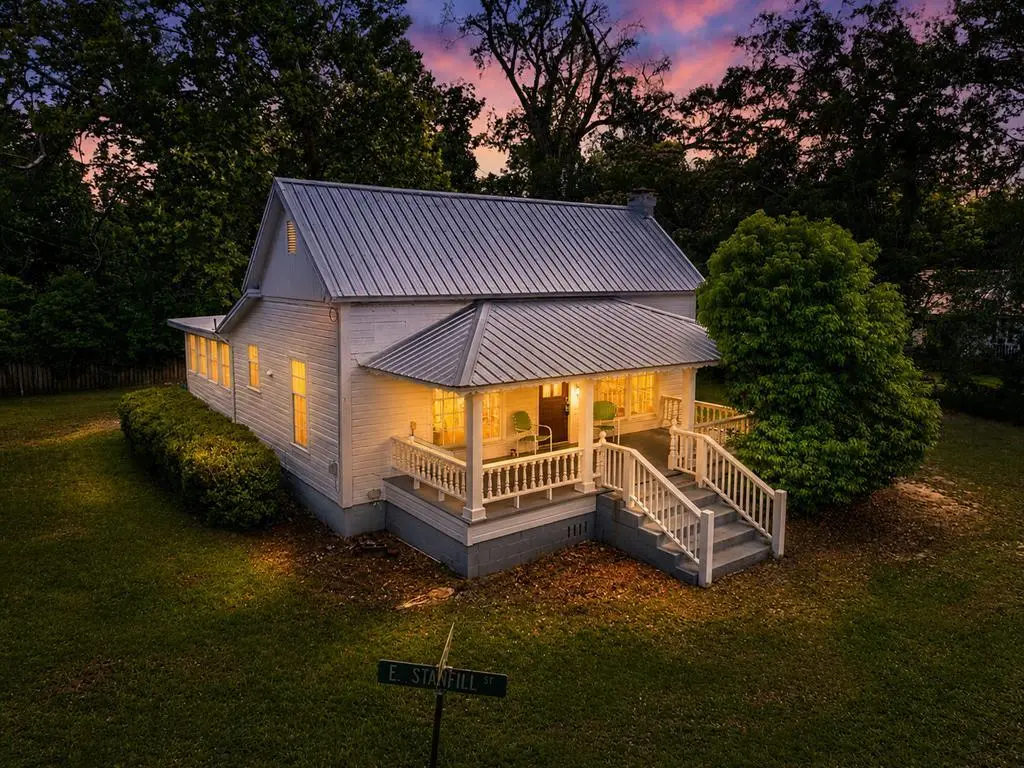
114 E Stanfill St · Hahira, GA
Flood risk 1/10 · Minimal
- FEMA flood zone
- X (unshaded)
- Chance of flooding over 30 yrs
- 0.0%
- Est. flood insurance / yr
- $507 – $1,088
Fire risk 7/10 · Major
- Est. fire insurance / yr
- $963 – $1,789
Heat risk 7/10 · Major
- Hot days now (above 108°F)
- 7 days/yr
- Hot days in 30 yrs
- 19 days/yr
Wind risk 8/10 · Major
- Chance of severe wind over 30 yrs
- 99.0%
Air-quality risk 6/10 · Moderate
- Unhealthy air days now
- 10 days/yr
- Unhealthy air days in 30 yrs
- 13 days/yr
Risk factors via First Street. Map © Google.
Why this score? — see what drove the B- grade
The composite is a weighted blend of 9 inputs, each scored 0–100. Each bar is that input's sub-score; the figure is the points it added to the 100-point composite (weight × sub-score).
- Cash flow +19.3/30.0
- ARV discount +14.1/15.0
- Appreciation +10.0/10.0
- DSCR +6.1/10.0
- Schools +4.7/10.0
- 1% rule +4.1/10.0
- Livability +3.4/5.0
- Rent growth +2.5/5.0
- Condition / age +2.5/5.0
$149,900
🖨 Deal sheet 📄 Offer letter ✓ Due diligence
Listing remarks
Step into the charm of the 1900s with this beautifully updated home located within walking distance to the train depot in Hahira! This 2 bedroom, 1 bath home blends timeless character with a fantastic rocking chair front porch, modern updates, making it the perfect place to call home. Inside, you'll find new LVP flooring throughout most of the main living areas, fresh paint, and mostly new thermopane windows that bring in plenty of natural light while improving energy efficiency. The kitchen offers an abundance of cabinet space for storage and functionality, while the bathroom features a new vanity for a fresh, updated touch. A spacious laundry room adds even more convenience. Situated on a
Key facts
- New vanity
- New lvp flooring
- 0.35 acre lot
Tags
Property features AI
Finance
- Other: Directions: From I-75 take exit 29 towards downtown Hahira. Turn left on Church St, right on E Stanfill, and the home will be on your right.
- Financial info: Property taxes listed (amount not included per instructions)
- HOA & community: Details not provided
Exterior
- Parking: Details not provided
- Security: Details not provided
- Utilities: Public water; Public sewer
- Home design: Single-family residence; One-story house; Residential property (R-10 zoning)
- Construction: Wood siding exterior; Metal roof; Built year not provided; Foundation details not provided
- Exterior features: Workshop on the property; Irregular-shaped lot
Interior
- Kitchen: Refrigerator
- Bedrooms: Details not provided
- Flooring: Laminate flooring; Vinyl flooring
- Bathrooms: 1 full bathroom
- Heating & cooling: Details not provided
- Interior features: Refrigerator
- Laundry & utility: Dedicated laundry room
Neighborhood map
What this means for you Summary
Snapshot
- This is a 2-bed/1.0-bath single-family listed at $150k.
Deal economics
- At list price, monthly cash flow is $165 ($2k/yr) — positive.
- The deal already cash-flows at list — no discount required.
- To meet the 1% rule (rent ≥ 1% of price), the offer needs to be $136k (9.0% below list).
- Recommended offer: $136k (9.0% below list) — sets the bar for 1% rule.
- Cap rate 7.6% vs local median 3.9% in Hahira — top-decile yield for the area; either an underpriced asset or a hidden risk that comps aren't pricing in. Stress-test before assuming the spread holds.
Location & tenants
- Location reads 67/100 on livability (#161 in GA) — a middle-class / working-renter tenant base. Strengths: cost of living A+, housing A+; Watch: crime C-, employment D+, health & safety D.
- Lowndes County (rural): math 59% / reading 52% proficiency, ranked #8 of 174 in GA (top 5%) — acceptable for families but not a draw, mixed tenant base, ~2y average lease.
- Market conditions: 189 active listings in the ZIP; 6 comparable units currently listed for rent nearby; rentals lingering (median 44d on market — plan ~5-8 weeks vacancy on turnover, expect pricing pressure); 67% of comp listings sitting > 30 days — soft ceiling on asking rent; solid renter incomes; 896 units permitted in Lowndes County in 2024 (0 in 5+ unit buildings).
Forward outlook
- In year one you build about $16k of equity ($1k loan paydown + $15k appreciation (10.0% local appreciation)).
- Lowndes County population projected at +10% by 2050 — modest demand growth; plan on rents tracking national, not racing it.
- At projected returns (10.0% appreciation + 3.0% rent growth), your $42k cash investment doubles in ~3 years — after that, you're playing with house money.
- By year 3, paydown + projected appreciation supports a ~$41k cash-out refi (75% LTV) — recoverable capital for the next deal without selling this one.
Negotiation context
- Only 2 days on market — expect competitive offers; lowballing is unlikely to land.
- Current owner paid $48k; list at $150k implies a 215% gain — meaningful room to come down on a strong offer.
Risks & watch-outs
- Watch-outs: built in 1900 — expect roof / HVAC / electrical / plumbing capex.
- Climate carrying-cost: severe wind risk, 99% chance of damaging wind over 30y; major wildfire risk; extreme-heat days projected 7→19/yr by 2055 (HVAC capex compounding) — expect insurance premiums to compound above CPI over the hold.
Questions for the listing agent
- Built in 1900 — when were the roof, HVAC, electrical panel, plumbing, and water heater last replaced?
- Is there a deadline driving the sale (1031 exchange, divorce, estate, relocation)? That informs how much negotiation room exists.
- What's the average days-on-market for RENTAL listings here right now (not sales)? A rising rental-DOM trend means longer vacancies and softer asking-rent achievability than the comps imply.
- What's the recent tenant-quality profile in this submarket — average credit score on applications, eviction rate, late-payment / NSF rate, and stable-employment percentage? A property-management company in the area should have these aggregated.
- How much new for-sale + rental construction is in the pipeline within 1–3 miles? Heavy new supply typically softens prices + rents 12–24 months out; constrained supply supports both.
Investment metrics
- 1% rule
- 0.91% ✗
- Cap rate
- 7.61%
- Cash-on-cash
- 4.72%
- DSCR
- 1.21
- GRM
- 9.2
CMA / ARV
- ARV (on-the-fly)
- $175,560
- Comps found
- 10
Show comp detail 10 sales within ~0.75 mi
| Address | Dist | Beds/Ba | Sqft | Sold | Price | $/sf | Match |
|---|---|---|---|---|---|---|---|
| 105 Owens St | 0.14mi | 2/2.0 | 1,118 (-2%) | 19mo | $105,000 | $94 | 70 |
| 509 South Nelson St | 0.52mi | 2/2.0 | 1,100 (-4%) | 9mo | $168,000 | $153 | 58 |
| 503 S College St | 0.52mi | 3/1.5 (+1) | 1,147 (+1%) | 14mo | $217,000 | $189 | 56 |
| 309 Barfield St | 0.34mi | 3/2.0 (+1) | 1,265 (+11%) | 7mo | $170,000 | $134 | 51 |
| 202 S Lowndes St | 0.40mi | 3/2.0 (+1) | 1,070 (-6%) | 17mo | $203,000 | $190 | 48 |
| 500 Weaver St | 0.51mi | 3/1.0 (+1) | 1,008 (-12%) | 14mo | $155,000 | $154 | 40 |
| 521 Judy Ann Dr | 0.60mi | 3/2.0 (+1) | 1,286 (+13%) | 9mo | $213,000 | $166 | 35 |
| 303 Wright St | 0.68mi | 3/2.0 (+1) | 1,293 (+13%) | 6mo | $191,000 | $148 | 31 |
| 301 Wright St | 0.69mi | 3/2.0 (+1) | 1,293 (+13%) | 7mo | $199,900 | $155 | 31 |
| 912 W Stanfill St | 0.71mi | 3/1.0 (+1) | 1,040 (-9%) | 23mo | $149,900 | $144 | 28 |
Match score weights: distance 35% · size 25% · config 20% · recency 20%. Top-matched comps best support the ARV.
Projected returns pro-forma
10.0% appreciation · 3.0% rent growth · sell at horizon
- IRR
- 27.7%
- Equity multiple
- 3.19×
- Total profit
- $92,096
- Equity at exit
- $135,042
- IRR
- 24.1%
- Equity multiple
- 7.26×
- Total profit
- $262,832
- Equity at exit
- $291,223
Cash invested: $41,972 (down + closing). Projections, not guarantees.
Landlord ↔ Tenant lean methodology
- Overall (STATE)
- 90 Strongly Landlord-Friendly
- State Georgia
- 90 Strongly Landlord-Friendly · R+3
- County
- — inherits STATE
- City
- — inherits STATE
ZIP-level market 31632
- Home prices YoY
- 8.1%
- Active inventory
- 189
- Price-to-rent
- 9.2×
Monthly cashflow live
- Estimated rent
- $1,364 high interval (Pro) →
- Mortgage (P&I)
- −$786
- Tax from tax record
- −$64 /mo · $766/yr
- Insurance
- −$62
- HOA
- −$0
- Vacancy / Maint / Mgmt
- −$286
- Net cashflow
- $165
Break-even live
UW: 25.0% down · 7.5% · 30yr · 1.5% tax · 5.0% vac · 8.0% maint · 8.0% mgmt
Financing live
Cash to close
- Down payment
- $37,475
- Closing costs
- $4,497
- Reserves months
- —
- Total cash needed
- —
Loan-product check · same deal, 3 products live
Conventional
25% down · 7.5% · 30yr
- Down + closing
- —
- Monthly P&I
- —
- Monthly cashflow
- —
- DSCR
- —
- Eligible?
- —
Personal DTI + credit; lowest rate.
DSCR
20% down · 8.5% · 30yr
- Down + closing
- —
- Monthly P&I
- —
- Monthly cashflow
- —
- DSCR
- —
- Eligible?
- —
No personal income docs; deal must DSCR.
Hard money
10% down · 12.0% · 12mo
- Down + closing
- —
- Monthly P&I
- —
- Monthly cashflow
- —
- DSCR
- —
- Eligible?
- —
Short-term bridge; refi at stabilization.
Rent comps 6 comps
| Address | Beds | Baths | Sqft | Rent | $/sqft | DOM | Units | Dist |
|---|---|---|---|---|---|---|---|---|
| 202 E Main St Apt A Hahira, GA | 2.0 | 1.0 | 800 | $850 | $1.06 | 43d | 1 | 0.18mi |
| 305 Barfield St Hahira, GA | 3.0 | 2.0 | 1361 | $1,495 | $1.10 | 43d | 1 | 0.35mi |
| 302 Lee St Hahira, GA | 3.0 | 2.0 | 950 | $1,095 | $1.15 | 21d | 1 | 0.52mi |
| 511 E Main St Apt C Hahira, GA | 2.0 | 1.0 | 864 | $895 | $1.04 | 43d | 1 | 0.53mi |
| 310 Elizabeth St Hahira, GA | 3.0 | 2.0 | 1200 | $1,195 | $1.00 | 43d | 1 | 0.54mi |
| 7410 Northcreek Cir Hahira, GA | 3.0 | 2.0 | 1460 | $1,750 | $1.20 | 21d | 1 | 1.19mi |
Listing history 3 events
-
2026-05-20$149,900 Active
-
2019-08-22soldstatus $47,519
-
1977-05-13soldstatus $25,800
ⓘ Source: listings_history table (triggers on properties + properties_extension) + one-shot
backfill from property_details.listing_events for pre-trigger history.
Tax reassessment forecast GA · Resets to sale price
- Current annual tax
- $766 · $64/mo
- Projected year-2 tax
- $1,379 · $115/mo
- Expected delta
- +$613/yr (+$51/mo · 80.0%)
ⓘ Screening estimate from a state-policy table — verify with the county assessor before closing.
Climate risk First Street
- Flood 1/10 Low FEMA zone X (unshaded) · 0% chance over 30 yrs
- Wildfire 7/10 Severe
- Heat 7/10 Severe 7 d/yr ≥108°F today · 19 d/yr by 30 yrs out
- Wind 8/10 Severe 99% chance of damaging wind over 30 yrs
- Air quality 6/10 Major 10 unhealthy d/yr today · 13 by 30 yrs out
Nearby sold comps map
Loading sold comps map…
Walkable amenities ~0.75 mi
Loading nearby amenities…
Taxation est. · year 1
- Rental income
- $16,366
- − Mortgage interest
- −$8,397
- − Property taxes
- −$766
- − Insurance
- −$750
- − Repairs & maintenance
- −$1,309
- − Management
- −$1,309
- − Depreciation
- −$4,361
- Taxable loss
- −$525
- Est. tax savings @ 24.0%
- +$126
- After-tax cash flow
- $2,107/yr
For passive investors: Depreciation is non-cash, so a rental often shows a tax loss while cash-flowing — sheltering income. Rental losses are passive: they offset passive income freely, and up to $25,000/yr can offset ordinary (W-2) income if you actively participate and your MAGI is under $100k (phasing out to $0 by $150k); unused losses carry forward. On sale, claimed depreciation is recaptured at up to 25%, and gains may owe capital-gains tax (a 1031 exchange can defer both). Figures are a year-1 estimate at your 24.0% rate — not tax advice; consult a CPA.
Schools (NCES district)
- District
- Lowndes County
- NCES district ID
- 1303390
- Math proficiency
- 59% ▼ -1.00%
- Reading proficiency
- 52% ▼ -2.00%
- Median HH income
- $48,221
- Composite
- 47.21/100
- National rank
- #2317
- State rank
- #8 of 174 in GA
Livability — Hahira
- Score
- 67/100
- State rank
- #161
- US rank
- #10280
Category grades
Schools grade is shown separately in the Schools card above.
Census & demographics
- Census place
- Hahira, GA
- County
- Lowndes County · 107,801 people
- Metro
- Valdosta, GA
- Population (ZIP)
- 15,942
- Household income
- $83,946
- Rent vs Own
- Severe rent burden
- 73.0
Population outlook (Lowndes County) Hauer SSP2
- Today (2025)
- 120,348 people
- By 2030
- 123,469 · +2.6%
- By 2040
- 128,482 · +6.8%
- By 2050
- 131,907 · +9.6%
- By 2075
- 139,080 · +15.6%
- By 2100
- 133,649 · +11.1%
Race, ethnicity, and origin ACS 2023
- Neighborhood character
- Predominantly White (79%)
- Race & ethnicity
- White 79% Black 12% Hispanic / Latino 6% Two or more races 5%
- Hispanic origin (detail)
- Mexican 2% Puerto Rican 2%
- Common ancestry
- Slovak 3% Serbian 2% Italian 1%
- Foreign-born
- 2% · Canada, Jamaica
- Languages at home
- 96% English-only · Spanish 3%
Political lean MEDSL · Lowndes
- 2024 margin
- R (+18.0) · D 40.8% · R 58.8%
- 2008→2024 swing
- -8.6pp toward R · 2008: -9.4pp · 2024: -18.0pp
- All cycles
- 2024: R+18.0 2020: R+12.0 2016: R+18.2 2012: R+10.5 2008: R+9.4
Not yet ingested
- Civics
- —
Market trends
- HPI YoY
- ▲ 19.44%
- Current HPI
- 259.01
- Rent YoY
- —
- Metro
- Valdosta, GA
- State GDP YoY
- ▲ 2.66%
- F500 in state
- 28
Industry mix (Fortune 500 HQ in GA)
| Industry | F500 HQs | Revenue |
|---|---|---|
| Paper / Packaging | 2 | $29B |
|
||
| Retail | 1 | $160B |
|
||
| Transportation / Logistics | 1 | $91B |
|
||
| Airlines | 1 | $62B |
|
||
| Consumer Goods | 1 | $47B |
|
||
| Utilities | 1 | $25B |
|
||
Price history
+481.0% since first listed3 events — show timeline
- 2026-05-20 Listed $149,900 SGMLS
- 2019-08-22 Sold (Public Records) $47,519 Public Records
- 1977-05-13 Sold (Public Records) $25,800 Public Records
Property tax history
+3.8%/yrLatest (2025): $766 · +1.0% YoY. Source: county tax records.
Cash-flow waterfall
monthlySold comps — $/sqft
last 12 mo · ≤1 miLoading sold comps…