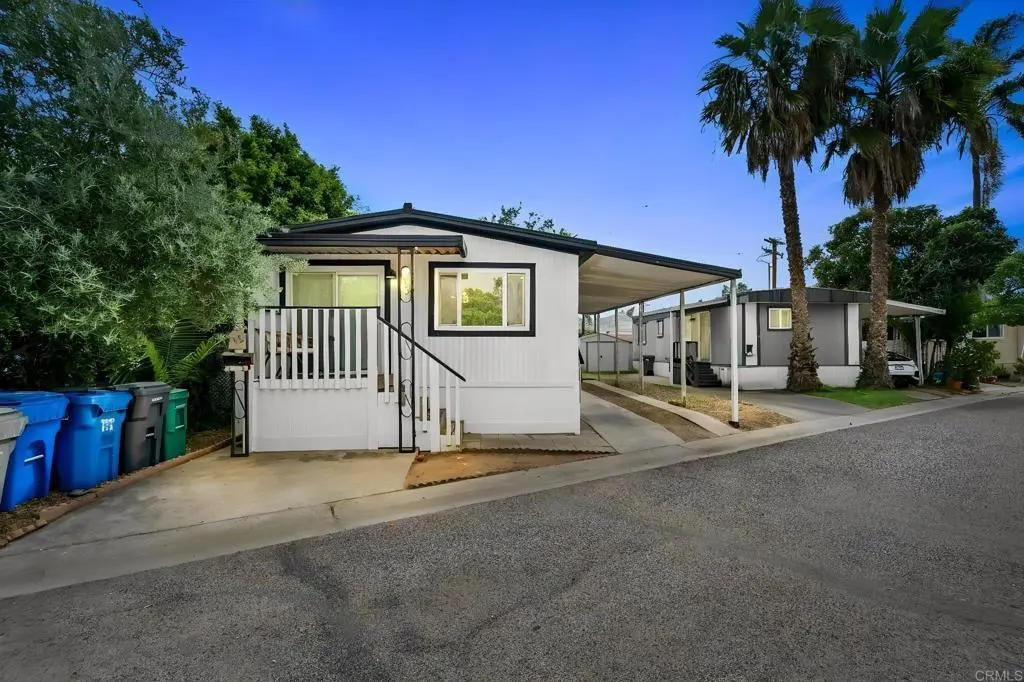
10250 PROSPECT #38 · Santee, CA
Flood risk 6/10 · Moderate
- FEMA flood zone
- X (unshaded)
- Chance of flooding over 30 yrs
- 0.72%
- Est. flood insurance / yr
- $507 – $1,088
Fire risk 1/10 · Minimal
- Est. fire insurance / yr
- $659 – $1,223
Heat risk 5/10 · Moderate
- Hot days now (above 98°F)
- 7 days/yr
- Hot days in 30 yrs
- 18 days/yr
Wind risk 1/10 · Minimal
- Chance of severe wind over 30 yrs
- —
Air-quality risk 3/10 · Minor
- Unhealthy air days now
- 4 days/yr
- Unhealthy air days in 30 yrs
- 4 days/yr
Risk factors via First Street. Map © Google.
Why this score? — see what drove the C grade
The composite is a weighted blend of 9 inputs, each scored 0–100. Each bar is that input's sub-score; the figure is the points it added to the 100-point composite (weight × sub-score).
- Cash flow +27.3/30.0
- DSCR +9.5/10.0
- 1% rule +7.4/10.0
- Schools +4.5/10.0
- Livability +3.2/5.0
- Rent growth +2.7/5.0
- Condition / age +2.5/5.0
- ARV discount +0.0/15.0
- Appreciation +0.0/10.0
$200,000
🖨 Deal sheet 📄 Offer letter ✓ Due diligence
Listing remarks
Welcome to this charming and affordable 3-bedroom, 1-bath manufactured home located in the all-ages Town & Country Mobile Lodge community in Santee. Offering approximately 800 sq ft of living space, this home features a functional layout, natural light, and comfortable living throughout. Conveniently located near shopping, restaurants, parks, and freeway access. Community amenities may include pool, clubhouse, playground, and laundry facilities. Great opportunity for first-time buyers or anyone looking for affordable living in a central Santee location. Space rent applies. Buyer and buyer’s agent to verify all information before close of escrow.
Key facts
- Community pool
- Built 1976
- Listed 34 days
Property features AI
Finance
- Financial info: Land lease property
- HOA & community: Monthly land lease of $762
Exterior
- Parking: Located in Town & Country Mobile Lodge (park name)
- Utilities: Public sewer
- Home design: Single-story mobile home; Mobile home remains on site; Mobile dimensions approximately 14 by 56; Entry on main level
- Construction: Year built per assessor; Construction details per assessor
- Exterior features: Community pool; Level with street; Near public transit; Sidewalks and park in the community
Interior
- Bedrooms: Bedroom located on the main floor
- Bathrooms: 1 full bathroom
- Heating & cooling: Cooling present (see remarks)
- Interior features: One-level home; Main floor bedroom; Entry on main level
- Laundry & utility: Inside laundry with washer hookup
Neighborhood map
What this means for you Summary
Snapshot
- This is a 2-bed/1.0-bath manufactured listed at $200k.
Deal economics
- At list price, monthly cash flow is $577 ($7k/yr) — positive.
- The deal already cash-flows at list — no discount required.
- Meets the 1% rule at list price ($2k rent vs $200k).
- Recommended offer: $194k (3.0% below list) — sets the bar for market timing.
- Cap rate 9.8% vs local median 2.6% in Santee — top-decile yield for the area; either an underpriced asset or a hidden risk that comps aren't pricing in. Stress-test before assuming the spread holds.
Location & tenants
- Location reads 65/100 on livability (#361 in CA) — a middle-class / working-renter tenant base. Strengths: commute A+, employment A+, crime A-; Watch: health & safety C-, amenities D, cost of living F.
- Santee (suburban): math 46% / reading 54% proficiency, ranked #130 of 517 in CA (top 25%) — acceptable for families but not a draw, mixed tenant base, ~2y average lease.
- Market conditions: Rents flat; 197 active listings in the ZIP; 14 comparable units currently listed for rent nearby; rentals leasing fast (median 2d on market — plan ~1-2 weeks tenant-placement turnaround); high-income renter base; 11,759 units permitted in San Diego County in 2024 (7,244 in 5+ unit buildings).
Forward outlook
- Local home prices are declining (-3.0%/yr); year-one equity from $1k of loan paydown is wiped out by about $6k of value loss. Plan a longer hold.
- San Diego County population projected at +20% by 2050 — long-run rental-demand tailwind backs the buy-and-hold thesis.
Negotiation context
- It's been on market 34 days — a 3% lower offer ($194k) is reasonable based on typical stale-listing flexibility.
Risks & watch-outs
- Climate carrying-cost: major flood risk; extreme-heat days projected 7→18/yr by 2055 (HVAC capex compounding) — expect insurance premiums to compound above CPI over the hold.
Questions for the listing agent
- It's been on market 34 days. Have you received any prior offers? Is the seller open to a 3% concession, seller financing, or rate buy-down credit?
- Built in 1976 — when were the roof, HVAC, electrical panel, plumbing, and water heater last replaced?
- Is there a deadline driving the sale (1031 exchange, divorce, estate, relocation)? That informs how much negotiation room exists.
- What's the average days-on-market for RENTAL listings here right now (not sales)? A rising rental-DOM trend means longer vacancies and softer asking-rent achievability than the comps imply.
- What's the recent tenant-quality profile in this submarket — average credit score on applications, eviction rate, late-payment / NSF rate, and stable-employment percentage? A property-management company in the area should have these aggregated.
- How much new for-sale + rental construction is in the pipeline within 1–3 miles? Heavy new supply typically softens prices + rents 12–24 months out; constrained supply supports both.
Investment metrics
- 1% rule
- 1.24% ✓
- Cap rate
- 9.75%
- Cash-on-cash
- 12.36%
- DSCR
- 1.55
- GRM
- 6.7
CMA / ARV
- ARV (on-the-fly)
- $136,000
- Comps found
- 1
Show comp detail 1 sale within ~0.75 mi
| Address | Dist | Beds/Ba | Sqft | Sold | Price | $/sf | Match |
|---|---|---|---|---|---|---|---|
| 8712 N Magnolia Ave Spc 202 | 0.59mi | 2/2.0 | 880 (+10%) | 24mo | $150,000 | $170 | 32 |
Match score weights: distance 35% · size 25% · config 20% · recency 20%. Top-matched comps best support the ARV.
Projected returns pro-forma
-3.0% appreciation · 0.85% rent growth · sell at horizon
- IRR
- -0.4%
- Equity multiple
- 0.98×
- Total profit
- $-888
- Equity at exit
- $29,821
- IRR
- 6.9%
- Equity multiple
- 1.47×
- Total profit
- $26,041
- Equity at exit
- $17,292
Cash invested: $56,000 (down + closing). Projections, not guarantees.
Landlord ↔ Tenant lean methodology
- Overall (STATE)
- 18 Strongly Tenant-Friendly
- State California
- 18 Strongly Tenant-Friendly · D+13
- County
- — inherits STATE
- City
- — inherits STATE
ZIP-level market 92071
- Rents YoY
- 0.8%
- Active inventory
- 197
- Price-to-rent
- 6.7×
Monthly cashflow live
- Estimated rent
- $2,480 high interval (Pro) →
- Mortgage (P&I)
- −$1,049
- Tax est. 1.5%
- −$250 /mo · $3,000/yr
- Insurance
- −$83
- HOA
- −$0
- Vacancy / Maint / Mgmt
- −$521
- Net cashflow
- $577
Break-even live
UW: 25.0% down · 7.5% · 30yr · 1.5% tax · 5.0% vac · 8.0% maint · 8.0% mgmt
Financing live
Cash to close
- Down payment
- $50,000
- Closing costs
- $6,000
- Reserves months
- —
- Total cash needed
- —
Loan-product check · same deal, 3 products live
Conventional
25% down · 7.5% · 30yr
- Down + closing
- —
- Monthly P&I
- —
- Monthly cashflow
- —
- DSCR
- —
- Eligible?
- —
Personal DTI + credit; lowest rate.
DSCR
20% down · 8.5% · 30yr
- Down + closing
- —
- Monthly P&I
- —
- Monthly cashflow
- —
- DSCR
- —
- Eligible?
- —
No personal income docs; deal must DSCR.
Hard money
10% down · 12.0% · 12mo
- Down + closing
- —
- Monthly P&I
- —
- Monthly cashflow
- —
- DSCR
- —
- Eligible?
- —
Short-term bridge; refi at stabilization.
Rent comps 14 comps
| Address | Beds | Baths | Sqft | Rent | $/sqft | DOM | Units | Dist |
|---|---|---|---|---|---|---|---|---|
| 8842 Tamberly Ct Santee, CA | 2.0 | 1.5 | 903 | $2,695 | $2.98 | 2d | 1 | 0.45mi |
| 10233 Mission Gorge Rd Santee, CA | 2.0–3.0 | 1.0 | 942 | $2,195 | $2.33 | 1d | 1 | 0.47mi |
| 9855 Mission Greens Ct #3 Santee, CA | 2.0 | 1.0 | 903 | $2,495 | $2.76 | 16d | 1 | 0.48mi |
| 8712 N Magnolia Ave Santee, CA | 2.0 | 2.0 | 1060 | $2,875 | $2.71 | 1d | 1 | 0.55mi |
| 8866 Donna Jean Ln Santee, CA | 1.0 | 1.0 | 650 | $1,700 | $2.62 | 1d | 1 | 0.60mi |
| 8961 N Magnolia Ave Santee, CA | 1.0–2.0 | 1.0 | 850 | $2,200 | $2.59 | 1d | 2 | 0.80mi |
| 8729 Graves Ave Santee, CA | 1.0–2.0 | 1.0 | 752 | $2,385 | $3.17 | 1d | 8 | 0.92mi |
| 8527 Graves Ave Santee, CA | 1.0–2.0 | 1.0–2.0 | 505 | $2,000 | $3.96 | 1d | 1 | 0.93mi |
| 9525 Mission Gorge Rd Santee, CA | 2.0–3.0 | 1.0–2.0 | 901 | $2,195 | $2.44 | 1d | 4 | 0.95mi |
| 359 Cascade Rd El Cajon, CA | 2.0 | 1.0 | 765 | $2,875 | $3.76 | 7d | 1 | 1.06mi |
| 1521 Graves Ave El Cajon, CA | 1.0–2.0 | 1.0–2.0 | 730 | $2,632 | $3.61 | 1d | 7 | 1.19mi |
| 310 E Bradley Ave El Cajon, CA | 1.0–2.0 | 1.0 | 664 | $2,050 | $3.09 | 1d | 1 | 1.33mi |
| 360 E Bradley Ave El Cajon, CA | 3.0 | 2.0 | 1116 | $2,934 | $2.63 | 1d | 3 | 1.38mi |
| 8320-8328 Fanita Dr Santee, CA | 1.0 | 1.0 | 600 | $1,850 | $3.08 | 1d | 3 | 1.47mi |
Listing history 16 events
-
2026-06-18days on market $200,000 Active 34 DOM
-
2026-06-17days on market $200,000 Active 33 DOM
-
2026-06-16days on market $200,000 Active 32 DOM
-
2026-06-15days on market $200,000 Active 31 DOM
-
2026-06-13days on market $200,000 Active 29 DOM
-
2026-06-13days on market $200,000 Active 28 DOM
-
2026-06-09days on market $200,000 Active 25 DOM
-
2026-06-08days on market $200,000 Active 24 DOM
-
2026-06-07days on market $200,000 Active 23 DOM
-
2026-06-04days on market $200,000 Active 20 DOM
-
2026-06-03days on market $200,000 Active 19 DOM
-
2026-06-02days on market $200,000 Active 18 DOM
-
2026-06-01days on market $200,000 Active 17 DOM
-
2026-05-31days on market $200,000 Active 16 DOM
-
2026-05-15$200,000 Active
-
2026-05-15historical $200,000
ⓘ Source: listings_history table (triggers on properties + properties_extension) + one-shot
backfill from property_details.listing_events for pre-trigger history.
Climate risk First Street
- Flood 6/10 Major FEMA zone X (unshaded) · 72% chance over 30 yrs
- Wildfire 1/10 Low
- Heat 5/10 Major 7 d/yr ≥98°F today · 18 d/yr by 30 yrs out
- Wind 1/10 Low
- Air quality 3/10 Moderate 4 unhealthy d/yr today · 4 by 30 yrs out
Nearby sold comps map
Loading sold comps map…
Walkable amenities ~0.75 mi
Loading nearby amenities…
Taxation est. · year 1
- Rental income
- $29,756
- − Mortgage interest
- −$11,203
- − Property taxes
- −$3,000
- − Insurance
- −$1,000
- − Repairs & maintenance
- −$2,380
- − Management
- −$2,380
- − Depreciation
- −$5,818
- Taxable income
- $3,974
- Est. tax owed @ 24.0%
- −$954
- After-tax cash flow
- $5,968/yr
For passive investors: Depreciation is non-cash, so a rental often shows a tax loss while cash-flowing — sheltering income. Rental losses are passive: they offset passive income freely, and up to $25,000/yr can offset ordinary (W-2) income if you actively participate and your MAGI is under $100k (phasing out to $0 by $150k); unused losses carry forward. On sale, claimed depreciation is recaptured at up to 25%, and gains may owe capital-gains tax (a 1031 exchange can defer both). Figures are a year-1 estimate at your 24.0% rate — not tax advice; consult a CPA.
Schools (NCES district)
- District
- Santee
- NCES district ID
- 0635880
- Math proficiency
- 46% ▼ -3.00%
- Reading proficiency
- 54% ▼ -2.00%
- Median HH income
- $73,452
- Composite
- 45.0/100
- National rank
- #2698
- State rank
- #130 of 517 in CA
Livability — Santee
- Score
- 65/100
- State rank
- #361
- US rank
- #12272
Category grades
Schools grade is shown separately in the Schools card above.
Census & demographics
- Census place
- Santee, CA
- County
- San Diego County · 3,178,799 people
- City population
- 59,590
- Metro
- San Diego-Chula Vista-Carlsbad, CA
- Population (ZIP)
- 59,590
- Household income
- $113,618
- Rent vs Own
- Severe rent burden
- 1719.0
Population outlook (San Diego County) Hauer SSP2
- Today (2025)
- 3,678,185 people
- By 2030
- 3,856,546 · +4.8%
- By 2040
- 4,171,407 · +13.4%
- By 2050
- 4,421,607 · +20.2%
- By 2075
- 4,831,599 · +31.4%
- By 2100
- 4,832,502 · +31.4%
Race, ethnicity, and origin ACS 2023
- Neighborhood character
- Majority White (63%)
- Race & ethnicity
- White 63% Hispanic / Latino 22% Two or more races 16% Asian 5% Black 2%
- Hispanic origin (detail)
- Mexican 18%
- Common ancestry
- Slovak 3% Italian 3% Lithuanian 2%
- Foreign-born
- 13% · Canada, Vietnam, China
- Languages at home
- 81% English-only · Spanish 8% Arabic 3% Other Asian/Pacific 1%
Political lean MEDSL · San Diego
- 2024 margin
- D (+16.8) · D 56.9% · R 40.1% · Other 2.9%
- 2008→2024 swing
- +6.6pp toward D · 2008: 10.2pp · 2024: 16.8pp
- All cycles
- 2024: D+16.8 2020: D+22.8 2016: D+17.8 2012: D+5.1 2008: D+10.2
Not yet ingested
- Civics
- —
Market trends
- HPI YoY
- ▼ -607.00%
- Current HPI
- 393.1781
- Rent YoY
- ▲ 0.85%
- Metro
- San Diego-Chula Vista-Carlsbad, CA
- State GDP YoY
- ▲ 3.21%
- F500 in state
- 116
Industry mix (Fortune 500 HQ in CA)
| Industry | F500 HQs | Revenue |
|---|---|---|
| Technology | 27 | $1,492B |
|
||
| Financial Services | 3 | $174B |
|
||
| Retail | 3 | $44B |
|
||
| Insurance | 3 | $26B |
|
||
| Media / Entertainment | 2 | $115B |
|
||
| Pharmaceuticals / Biotech | 2 | $62B |
|
||
Price history
+0.0% since first listed2 events — show timeline
- 2026-05-15 Listed $200,000 CRMLS
- 2026-05-15 Coming Soon $200,000 CRMLS
Property tax history
+1.8%/yrLatest (2014): $207 · -0.1% YoY. Source: county tax records.
Cash-flow waterfall
monthlySold comps — $/sqft
last 12 mo · ≤1 miLoading sold comps…