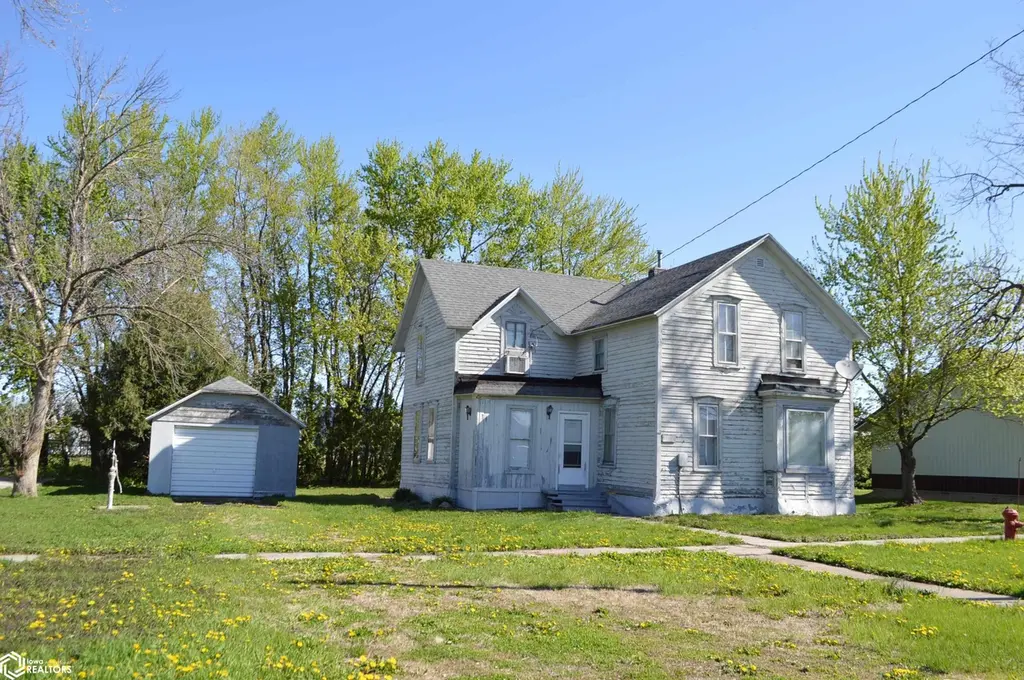
107 4th St · Grafton, IA
Flood risk 1/10 · Minimal
- FEMA flood zone
- X (unshaded)
- Chance of flooding over 30 yrs
- 0.0%
- Est. flood insurance / yr
- $507 – $1,088
Fire risk 1/10 · Minimal
- Est. fire insurance / yr
- $902 – $1,676
Heat risk 2/10 · Minimal
- Hot days now (above 99°F)
- 7 days/yr
- Hot days in 30 yrs
- 16 days/yr
Wind risk 2/10 · Minimal
- Chance of severe wind over 30 yrs
- —
Air-quality risk 1/10 · Minimal
- Unhealthy air days now
- 0 days/yr
- Unhealthy air days in 30 yrs
- 0 days/yr
Risk factors via First Street. Map © Google.
Why this score? — see what drove the C- grade
The composite is a weighted blend of 9 inputs, each scored 0–100. Each bar is that input's sub-score; the figure is the points it added to the 100-point composite (weight × sub-score).
- Cash flow +15.0/30.0
- ARV discount +7.5/15.0
- Appreciation +7.0/10.0
- Schools +7.0/10.0
- 1% rule +5.0/10.0
- DSCR +5.0/10.0
- Livability +3.2/5.0
- Rent growth +2.5/5.0
- Condition / age +2.5/5.0
$26,900
🖨 Deal sheet (PDF) 📄 Offer letter ✓ Due diligence
Listing remarks
An outstanding small town value. Property is offered with 2 lots - total 150' x 120'. Current house is older and needs rehab. This would be a great opportunity to build new on an oversized lot or rehab the current with room to expand. Nice detached 1 car garage. Quiet location the peaceful community of Grafton.
Key facts
- 0.41 acre lot
- Garage
- Built 1900
Property features AI
Exterior
- Parking: Detached 1-car garage
- Utilities: Public water; Public sewer; Electric with circuit breakers
- Home design: Single-family residence; Two-story
- Construction: Wood siding construction
- Exterior features: Shingle roof; Lot approximately 0.413 acres (150 x 120)
Interior
- Bathrooms: 1 full bathroom
- Heating & cooling: Forced air heating; No central cooling
- Interior features: Basement present
Neighborhood map
What this means for you Summary
Snapshot
- This is a 3-bed/1.0-bath single-family listed at $27k.
Deal economics
- At list price, monthly cash flow is $766 ($9k/yr) — positive.
- The deal already cash-flows at list — no discount required.
- Meets the 1% rule at list price ($1k rent vs $27k).
- Recommended offer: $26k (1.5% below list) — sets the bar for market timing.
Location & tenants
- Location reads 65/100 on livability (#556 in IA) — a middle-class / working-renter tenant base. Strengths: cost of living A+, housing A+; Watch: health & safety C-, schools F, amenities F.
- St Ansgar Community School District (rural): math 84% / reading 82% proficiency, ranked #16 of 289 in IA (top 6%) — strong family-tenant draw, lease renewals of 3-5y typical.
- Market conditions: 2 active listings in the ZIP.
Forward outlook
- In year one you build about $1k of equity ($186 loan paydown + $1k appreciation (4.0% local appreciation)).
- At projected returns (4.0% appreciation + 3.0% rent growth), your $8k cash investment doubles in ~1 year — after that, you're playing with house money.
Negotiation context
- It's been on market 15 days — a 2% lower offer ($26k) is reasonable based on typical stale-listing flexibility.
Risks & watch-outs
- Watch-outs: built in 1900 — expect roof / HVAC / electrical / plumbing capex.
Questions for the listing agent
- Built in 1900 — when were the roof, HVAC, electrical panel, plumbing, and water heater last replaced?
- Is there a deadline driving the sale (1031 exchange, divorce, estate, relocation)? That informs how much negotiation room exists.
- Schools are F-rated, which usually means shorter tenancies and higher turnover. Who's the typical renter profile here, and what's been the actual vacancy rate?
- What's the average days-on-market for RENTAL listings here right now (not sales)? A rising rental-DOM trend means longer vacancies and softer asking-rent achievability than the comps imply.
- What's the recent tenant-quality profile in this submarket — average credit score on applications, eviction rate, late-payment / NSF rate, and stable-employment percentage? A property-management company in the area should have these aggregated.
- How much new for-sale + rental construction is in the pipeline within 1–3 miles? Heavy new supply typically softens prices + rents 12–24 months out; constrained supply supports both.
Investment metrics
- 1% rule
- 4.49% ✓
- Cap rate
- 40.45%
- Cash-on-cash
- 121.99%
- DSCR
- 6.43
- GRM
- 1.9
CMA / ARV
- ARV (on-the-fly)
- $84,488
- Comps found
- 4
Show comp detail 4 sales within ~0.75 mi
| Address | Dist | Beds/Ba | Sqft | Sold | Price | $/sf | Match |
|---|---|---|---|---|---|---|---|
| 107 4th St | 0.00mi | 3/1.0 | 1,428 (-0%) | 0mo | $22,000 | $15 | 99 |
| 310 2nd St | 0.22mi | 3/1.5 | 1,435 (+0%) | 14mo | $36,000 | $25 | 76 |
| 201 3rd St | 0.07mi | 3/1.0 | 1,266 (-12%) | 16mo | $75,000 | $59 | 64 |
| 605 Iowa St | 0.51mi | 3/2.0 | 1,511 (+6%) | 12mo | $235,000 | $156 | 53 |
Match score weights: distance 35% · size 25% · config 20% · recency 20%. Top-matched comps best support the ARV.
Projected returns pro-forma
3.98% appreciation · 3.0% rent growth · sell at horizon
- IRR
- —
- Equity multiple
- 8.10×
- Total profit
- $53,454
- Equity at exit
- $13,613
- IRR
- —
- Equity multiple
- 16.97×
- Total profit
- $120,287
- Equity at exit
- $22,245
Cash invested: $7,532 (down + closing). Projections, not guarantees.
Landlord ↔ Tenant lean methodology
- Overall (STATE)
- 83 Strongly Landlord-Friendly
- State Iowa
- 83 Strongly Landlord-Friendly · R+6
- County
- — inherits STATE
- City
- — inherits STATE
ZIP-level market 50440
- Home prices YoY
- 2.6%
- Active inventory
- 2
- Price-to-rent
- 1.9×
Monthly cashflow live
- Estimated rent
- $1,208 medium interval (Pro) →
- Mortgage (P&I)
- −$141
- Tax from tax record
- −$37 /mo · $440/yr
- Insurance
- −$11
- HOA
- −$0
- Vacancy / Maint / Mgmt
- −$254
- Net cashflow
- $766
Break-even live
Sensitivity live
| Price | -10% $781 | -5% $773 | +0% $766 | +5% $758 | +10% $750 |
|---|---|---|---|---|---|
| Rent | -10% $670 | -5% $718 | +0% $766 | +5% $813 | +10% $861 |
| Rate | -1.0pp $779 | -0.5pp $773 | base $766 | +0.5pp $759 | +1.0pp $752 |
UW: 25.0% down · 7.5% · 30yr · 1.5% tax · 5.0% vac · 8.0% maint · 8.0% mgmt
Financing live
Cash to close
- Down payment
- $6,725
- Closing costs
- $807
- Reserves months
- —
- Total cash needed
- —
Loan-product check · same deal, 3 products live
Conventional
25% down · 7.5% · 30yr
- Down + closing
- —
- Monthly P&I
- —
- Monthly cashflow
- —
- DSCR
- —
- Eligible?
- —
Personal DTI + credit; lowest rate.
DSCR
20% down · 8.5% · 30yr
- Down + closing
- —
- Monthly P&I
- —
- Monthly cashflow
- —
- DSCR
- —
- Eligible?
- —
No personal income docs; deal must DSCR.
Hard money
10% down · 12.0% · 12mo
- Down + closing
- —
- Monthly P&I
- —
- Monthly cashflow
- —
- DSCR
- —
- Eligible?
- —
Short-term bridge; refi at stabilization.
Listing history 3 events
-
2026-05-20status Pending
-
2026-05-11historical Active Under Contract
-
2026-05-04$26,900 Active
ⓘ Source: listings_history table (triggers on properties + properties_extension) + one-shot
backfill from property_details.listing_events for pre-trigger history.
Tax reassessment forecast IA · Partial reset (capped growth)
- Current annual tax
- $440 · $37/mo
- Projected year-2 tax
- $440 · $37/mo
- Expected delta
- $0/yr ($0/mo · 0.0%)
ⓘ Screening estimate from a state-policy table — verify with the county assessor before closing.
Climate risk First Street
- Flood 1/10 Low FEMA zone X (unshaded) · 0% chance over 30 yrs
- Wildfire 1/10 Low
- Heat 2/10 Low 7 d/yr ≥99°F today · 16 d/yr by 30 yrs out
- Wind 2/10 Low
- Air quality 1/10 Low 0 unhealthy d/yr today · 0 by 30 yrs out
Nearby sold comps map
Loading sold comps map…
Walkable amenities ~0.75 mi
Loading nearby amenities…
Taxation est. · year 1
- Rental income
- $14,501
- − Mortgage interest
- −$1,507
- − Property taxes
- −$440
- − Insurance
- −$134
- − Repairs & maintenance
- −$1,160
- − Management
- −$1,160
- − Depreciation
- −$783
- Taxable income
- $9,317
- Est. tax owed @ 24.0%
- −$2,236
- After-tax cash flow
- $6,952/yr
For passive investors: Depreciation is non-cash, so a rental often shows a tax loss while cash-flowing — sheltering income. Rental losses are passive: they offset passive income freely, and up to $25,000/yr can offset ordinary (W-2) income if you actively participate and your MAGI is under $100k (phasing out to $0 by $150k); unused losses carry forward. On sale, claimed depreciation is recaptured at up to 25%, and gains may owe capital-gains tax (a 1031 exchange can defer both). Figures are a year-1 estimate at your 24.0% rate — not tax advice; consult a CPA.
Schools (NCES district)
- District
- St Ansgar Community School District
- NCES district ID
- 1925200
- Math proficiency
- 84% ▬ 0.00%
- Reading proficiency
- 82% ▲ 2.00%
- Median HH income
- $52,141
- Composite
- 70.36/100
- National rank
- #269
- State rank
- #16 of 289 in IA
Livability — Grafton
- Score
- 65/100
- State rank
- #556
- US rank
- #12531
Category grades
Schools grade is shown separately in the Schools card above.
Census & demographics
- Census place
- Grafton, IA
- City population
- 275
- Population (ZIP)
- 275
Population outlook (Worth County) Hauer SSP2
- Today (2025)
- 7,751 people
- By 2030
- 7,775 · +0.3%
- By 2040
- 7,722 · -0.4%
- By 2050
- 7,645 · -1.4%
- By 2075
- 7,785 · +0.4%
- By 2100
- 7,554 · -2.5%
Race, ethnicity, and origin ACS 2023
- Neighborhood character
- Predominantly White (96%)
- Race & ethnicity
- White 96% Hispanic / Latino 3% Two or more races 3%
- Common ancestry
- Portuguese 23% Iranian 9% Scottish 3%
- Foreign-born
- 1%
- Languages at home
- 98% English-only · German/W. Germanic 2%
Political lean MEDSL · Worth
- 2024 margin
- Strong R (+28.2) · D 35.2% · R 63.5% · Other 1.3%
- 2008→2024 swing
- -50.6pp toward R · 2008: 22.4pp · 2024: -28.2pp
- All cycles
- 2024: R+28.2 2020: R+25.9 2016: R+21.8 2012: D+14.5 2008: D+22.4
Not yet ingested
- Civics
- —
Market trends
- HPI YoY
- ▲ 3.98%
- Current HPI
- 157.7886
- Rent YoY
- —
- Metro
- —
- State GDP YoY
- ▲ 2.48%
- F500 in state
- 4
Industry mix (Fortune 500 HQ in IA)
| Industry | F500 HQs | Revenue |
|---|---|---|
| Financial Services | 1 | $16B |
|
||
| Retail / Convenience | 1 | $15B |
|
||
Price history
3 events — show timeline
- 2026-05-20 Pending — IAR
- 2026-05-11 Contingent — IAR
- 2026-05-04 Listed $26,900 IAR
Property tax history
+4.8%/yrLatest (2025): $440 · +5.8% YoY. Source: county tax records.
Cash-flow waterfall
monthlySold comps — $/sqft
last 12 mo · ≤1 miLoading sold comps…