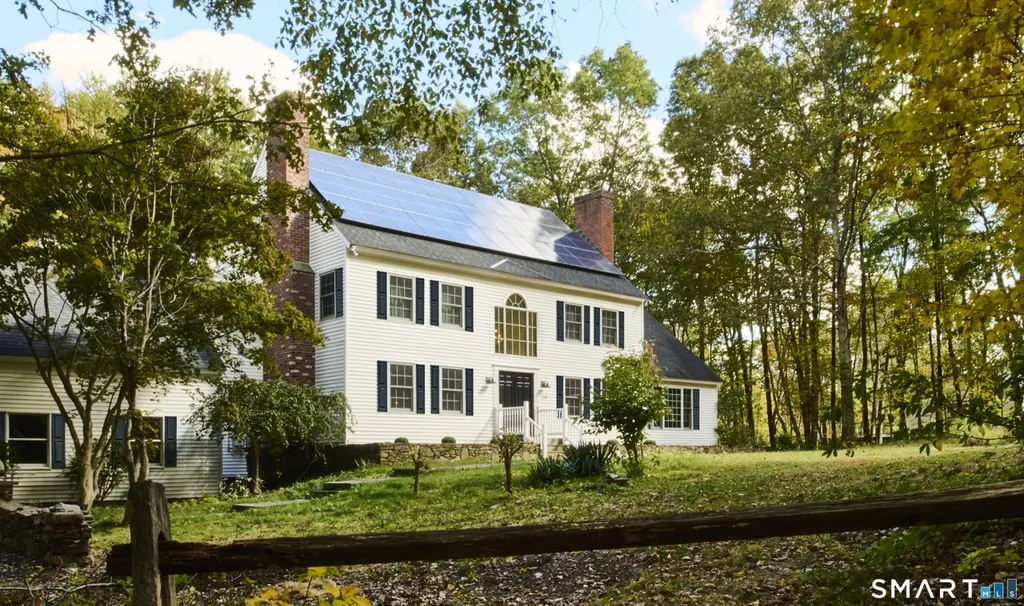
24 Hickory Ln · Heritage Village, CT
Flood risk 1/10 · Minimal
- FEMA flood zone
- X
- Chance of flooding over 30 yrs
- 0.0%
- Est. flood insurance / yr
- $473 – $860
Fire risk 4/10 · Minor
- Est. fire insurance / yr
- $829 – $1,539
Heat risk 4/10 · Minor
- Hot days now (above 96°F)
- 7 days/yr
- Hot days in 30 yrs
- 15 days/yr
Wind risk 4/10 · Minor
- Chance of severe wind over 30 yrs
- 22.0%
Air-quality risk 3/10 · Minor
- Unhealthy air days now
- 2 days/yr
- Unhealthy air days in 30 yrs
- 3 days/yr
Risk factors via First Street. Map © Google.
Why this score? — see what drove the C+ grade
The composite is a weighted blend of 9 inputs, each scored 0–100. Each bar is that input's sub-score; the figure is the points it added to the 100-point composite (weight × sub-score).
- Cash flow +30.0/30.0
- 1% rule +10.0/10.0
- DSCR +10.0/10.0
- Schools +6.3/10.0
- Livability +3.4/5.0
- Rent growth +2.5/5.0
- Condition / age +2.5/5.0
- ARV discount +0.0/15.0
- Appreciation +0.0/10.0
$1,155,000
🖨 Deal sheet 📄 Offer letter ✓ Due diligence
Listing remarks MLS
Tucked away in one of Roxbury's most desirable neighborhoods, this 4-bedroom, 2.5-bath Colonial sits at the end of a quiet dead-end road, offering exceptional privacy and a peaceful setting, with the Natalie White Preserve just down the road. This beautifully updated Post & Beam home blends timeless craftsmanship with modern amenities, featuring warm architectural details, exposed white oak beams, and a dramatic living room with soaring 27-foot ceilings, along with thoughtfully designed living spaces. The flexible layout includes a private in-law or studio space, ideal for guests, extended family, or a home office. Set on a serene, wooded 3-acre lot with mature landscaping, the property provides a tranquil retreat perfect for relaxing or entertaining. Despite its secluded feel, it's a short 15 minutes drive from fine-dining, shopping, and easy access to I-84, and ideally located just over 90 minutes to NYC and approximately 2 hours 20 minutes to Boston, offering both convenience and comfort in a truly special location.
Key facts
- Wooded 3-acre lot
- Easy access to i-84
- 90 minutes to nyc
Tags
Neighborhood map
What this means for you Summary
Snapshot
- This is a 4-bed/2.5-bath single-family listed at $1.16M.
Deal economics
- At list price, monthly cash flow is $13k ($152k/yr) — positive.
- The deal already cash-flows at list — no discount required.
- Meets the 1% rule at list price ($25k rent vs $1.16M).
- Recommended offer: $1.09M (6.0% below list) — sets the bar for market timing.
- Cap rate 19.4% vs local median 3.0% in Heritage Village — top-decile yield for the area; either an underpriced asset or a hidden risk that comps aren't pricing in. Stress-test before assuming the spread holds.
Location & tenants
- Location reads 68/100 on livability (#112 in CT) — a middle-class / working-renter tenant base. Strengths: crime A+, housing A+, health & safety A+; Watch: schools D+, employment D, amenities F.
- Regional School District 12 (rural): math 64% / reading 77% proficiency, ranked #20 of 153 in CT (top 13%) — strong family-tenant draw, lease renewals of 3-5y typical; only 8% free/reduced lunch — higher-income household profile.
- Market conditions: 48 active listings in the ZIP; 2 comparable units currently listed for rent nearby; 154 units permitted in Northwest Hills Planning Region in 2024 (6 in 5+ unit buildings).
Forward outlook
- Local home prices are declining (-3.0%/yr); year-one equity from $8k of loan paydown is wiped out by about $35k of value loss. Plan a longer hold.
- At projected returns (-3.0% appreciation + 3.0% rent growth), your $323k cash investment doubles in ~3 years — after that, you're playing with house money.
Negotiation context
- It's been on market 77 days — a 6% lower offer ($1.09M) is reasonable based on typical stale-listing flexibility.
- 5 sale attempts since 5y ago with the ask held roughly flat each time — persistent listings suggest the price (not the market) is what's stuck; bring a comps-based counter.
- Current owner paid $685k; list at $1.16M implies a 69% gain — meaningful room to come down on a strong offer.
Questions for the listing agent
- It's been on market 77 days. Have you received any prior offers? Is the seller open to a 6% concession, seller financing, or rate buy-down credit?
- Why hasn't it sold? Are there any deal-killer items the seller is aware of (foundation, flood, title, zoning, code violations)?
- Is there a deadline driving the sale (1031 exchange, divorce, estate, relocation)? That informs how much negotiation room exists.
- Schools are D-rated, which usually means shorter tenancies and higher turnover. Who's the typical renter profile here, and what's been the actual vacancy rate?
- What's the average days-on-market for RENTAL listings here right now (not sales)? A rising rental-DOM trend means longer vacancies and softer asking-rent achievability than the comps imply.
- What's the recent tenant-quality profile in this submarket — average credit score on applications, eviction rate, late-payment / NSF rate, and stable-employment percentage? A property-management company in the area should have these aggregated.
- How much new for-sale + rental construction is in the pipeline within 1–3 miles? Heavy new supply typically softens prices + rents 12–24 months out; constrained supply supports both.
Investment metrics
- 1% rule
- 2.16% ✓
- Cap rate
- 19.42%
- Cash-on-cash
- 46.88%
- DSCR
- 3.09
- GRM
- 3.9
CMA / ARV
- ARV (median comp)
- $930,170
- List price
- $1,155,000
- Delta
- 24.17%
- Verdict
- OVERPRICED
- Comps
- 11 within 1.0 mi
Show comp detail 4 sales within ~0.75 mi
| Address | Dist | Beds/Ba | Sqft | Sold | Price | $/sf | Match |
|---|---|---|---|---|---|---|---|
| 22 E Woods Rd | 0.38mi | 4/2.5 | 3,476 (+4%) | 2mo | $610,000 | $175 | 74 |
| 39 Hickory Ln | 0.21mi | 4/4.0 | 3,691 (+10%) | 4mo | $1,500,000 | $406 | 64 |
| 80 Transylvania Rd | 0.70mi | 4/2.5 | 3,088 (-8%) | 13mo | $940,000 | $304 | 44 |
| 257 Southbury Rd | 0.68mi | 3/3.0 (-1) | 3,086 (-8%) | 12mo | $1,875,000 | $608 | 38 |
Match score weights: distance 35% · size 25% · config 20% · recency 20%. Top-matched comps best support the ARV.
Projected returns pro-forma
-3.0% appreciation · 3.0% rent growth · sell at horizon
- IRR
- 44.2%
- Equity multiple
- 2.91×
- Total profit
- $617,365
- Equity at exit
- $172,214
- IRR
- 50.1%
- Equity multiple
- 5.86×
- Total profit
- $1,572,983
- Equity at exit
- $99,863
Cash invested: $323,400 (down + closing). Projections, not guarantees.
Landlord ↔ Tenant lean methodology
- Overall (STATE)
- 27 Tenant-Leaning
- State Connecticut
- 27 Tenant-Leaning · D+7
- County
- — inherits STATE
- City
- — inherits STATE
ZIP-level market 06783
- Home prices YoY
- -24.7%
- Active inventory
- 48
- Price-to-rent
- 3.9×
Monthly cashflow live
- Estimated rent
- $24,907 medium interval (Pro) →
- Mortgage (P&I)
- −$6,057
- Tax from tax record
- −$503 /mo · $6,037/yr
- Insurance
- −$481
- HOA
- −$0
- Vacancy / Maint / Mgmt
- −$5,230
- Net cashflow
- $12,635
Break-even live
UW: 25.0% down · 7.5% · 30yr · 1.5% tax · 5.0% vac · 8.0% maint · 8.0% mgmt
Financing live
Cash to close
- Down payment
- $288,750
- Closing costs
- $34,650
- Reserves months
- —
- Total cash needed
- —
Loan-product check · same deal, 3 products live
Conventional
25% down · 7.5% · 30yr
- Down + closing
- —
- Monthly P&I
- —
- Monthly cashflow
- —
- DSCR
- —
- Eligible?
- —
Personal DTI + credit; lowest rate.
DSCR
20% down · 8.5% · 30yr
- Down + closing
- —
- Monthly P&I
- —
- Monthly cashflow
- —
- DSCR
- —
- Eligible?
- —
No personal income docs; deal must DSCR.
Hard money
10% down · 12.0% · 12mo
- Down + closing
- —
- Monthly P&I
- —
- Monthly cashflow
- —
- DSCR
- —
- Eligible?
- —
Short-term bridge; refi at stabilization.
Rent comps 2 comps
| Address | Beds | Baths | Sqft | Rent | $/sqft | DOM | Units | Dist |
|---|---|---|---|---|---|---|---|---|
| 34 Old Roxbury Rd Roxbury, CT | 4.0 | 4.5 | 3996 | $35,000 | $8.76 | 43d | 1 | 1.47mi |
| 24 Old Roxbury Rd Roxbury, CT | 3.0 | 3.5 | 2862 | $15,000 | $5.24 | 23d | 1 | 1.47mi |
Listing history 29 events
-
2026-06-19days on market $1,155,000 Active 77 DOM
-
2026-06-18days on market $1,155,000 Active 76 DOM
-
2026-06-17days on market $1,155,000 Active 75 DOM
-
2026-06-16days on market $1,155,000 Active 74 DOM
-
2026-06-15days on market $1,155,000 Active 73 DOM
-
2026-06-14days on market $1,155,000 Active 71 DOM
-
2026-06-13days on market $1,155,000 Active 70 DOM
-
2026-06-10days on market $1,155,000 Active 68 DOM
-
2026-06-09days on market $1,155,000 Active 67 DOM
-
2026-06-08days on market $1,155,000 Active 66 DOM
-
2026-06-07days on market $1,155,000 Active 65 DOM
-
2026-06-05days on market $1,155,000 Active 62 DOM
-
2026-06-03days on market $1,155,000 Active 61 DOM
-
2026-06-02days on market $1,155,000 Active 60 DOM
-
2026-06-01days on market $1,155,000 Active 59 DOM
-
2026-05-31days on market $1,155,000 Active 58 DOM
-
2026-05-30days on market $1,155,000 Active 57 DOM
-
2026-04-01$1,155,000 Active 1038-char remark
Show marketing remark (1038 chars)
Tucked away in one of Roxbury's most desirable neighborhoods, this 4-bedroom, 2.5-bath Colonial sits at the end of a quiet dead-end road, offering exceptional privacy and a peaceful setting, with the Natalie White Preserve just down the road. This beautifully updated Post & Beam home blends timeless craftsmanship with modern amenities, featuring warm architectural details, exposed white oak beams, and a dramatic living room with soaring 27-foot ceilings, along with thoughtfully designed living spaces. The flexible layout includes a private in-law or studio space, ideal for guests, extended family, or a home office. Set on a serene, wooded 3-acre lot with mature landscaping, the property provides a tranquil retreat perfect for relaxing or entertaining. Despite its secluded feel, it's a short 15 minutes drive from fine-dining, shopping, and easy access to I-84, and ideally located just over 90 minutes to NYC and approximately 2 hours 20 minutes to Boston, offering both convenience and comfort in a truly special location.
-
2026-02-12historical
-
2026-02-02status Active
-
2026-02-01historical
-
2025-10-17$1,155,000 Active
-
2025-10-13historical
-
2022-03-16soldstatus $684,950 Closed
-
2022-01-29historical Under Contract - Continue to Show
-
2022-01-07$699,900 Active
-
2021-11-30historical
-
2021-08-19price $699,900
-
2021-07-16$739,900 Active
ⓘ Source: listings_history table (triggers on properties + properties_extension) + one-shot
backfill from property_details.listing_events for pre-trigger history.
Tax reassessment forecast CT · Partial reset (capped growth)
- Current annual tax
- $6,037 · $503/mo
- Projected year-2 tax
- $15,377 · $1,281/mo
- Expected delta
- +$9,340/yr (+$778/mo · 154.7%)
ⓘ Screening estimate from a state-policy table — verify with the county assessor before closing.
Climate risk First Street
- Flood 1/10 Low FEMA zone X · 0% chance over 30 yrs
- Wildfire 4/10 Moderate
- Heat 4/10 Moderate 7 d/yr ≥96°F today · 15 d/yr by 30 yrs out
- Wind 4/10 Moderate 22% chance of damaging wind over 30 yrs
- Air quality 3/10 Moderate 2 unhealthy d/yr today · 3 by 30 yrs out
Nearby sold comps map
Loading sold comps map…
Walkable amenities ~0.75 mi
Loading nearby amenities…
Taxation est. · year 1
- Rental income
- $298,879
- − Mortgage interest
- −$64,698
- − Property taxes
- −$6,037
- − Insurance
- −$5,775
- − Repairs & maintenance
- −$23,910
- − Management
- −$23,910
- − Depreciation
- −$33,600
- Taxable income
- $140,949
- Est. tax owed @ 24.0%
- −$33,828
- After-tax cash flow
- $117,792/yr
For passive investors: Depreciation is non-cash, so a rental often shows a tax loss while cash-flowing — sheltering income. Rental losses are passive: they offset passive income freely, and up to $25,000/yr can offset ordinary (W-2) income if you actively participate and your MAGI is under $100k (phasing out to $0 by $150k); unused losses carry forward. On sale, claimed depreciation is recaptured at up to 25%, and gains may owe capital-gains tax (a 1031 exchange can defer both). Figures are a year-1 estimate at your 24.0% rate — not tax advice; consult a CPA.
Schools (NCES district)
- District
- Regional School District 12
- NCES district ID
- 0903530
- Math proficiency
- 64% ▼ -9.00%
- Reading proficiency
- 77% ▬ 0.00%
- Median HH income
- $86,065
- Composite
- 63.18/100
- National rank
- #638
- State rank
- #20 of 153 in CT
Livability — Heritage Village
- Score
- 68/100
- State rank
- #112
- US rank
- #9662
Category grades
Schools grade is shown separately in the Schools card above.
Census & demographics
- City population
- 19,973
- Population (ZIP)
- 2,184
Population outlook (Northwest Hills County) Hauer SSP2
- By 2040
- 118,998
Race, ethnicity, and origin ACS 2023
- Neighborhood character
- Predominantly White (84%)
- Race & ethnicity
- White 84% Black 7% Hispanic / Latino 5% Two or more races 3% Asian 3%
- Common ancestry
- Slovak 8% Romanian 7% Hispanic 5%
- Foreign-born
- 14% · Canada
- Languages at home
- 82% English-only · French/Haitian/Cajun 6% Other Indo-European 4% Spanish 3%
Political lean MEDSL · Northwest Hills
- 2024 margin
- Toss-up / Even · D 48.6% · R 49.9% · Other 1.6%
- All cycles
- 2024: R+1.3
Not yet ingested
- Civics
- —
Market trends
- HPI YoY
- ▼ -55.80%
- Current HPI
- 170.3789
- Rent YoY
- —
- Metro
- —
- State GDP YoY
- ▲ 1.06%
- F500 in state
- 38
Industry mix (Fortune 500 HQ in CT)
| Industry | F500 HQs | Revenue |
|---|---|---|
| Industrial Machinery | 4 | $38B |
|
||
| Insurance | 3 | $71B |
|
||
| Financial Services | 2 | $25B |
|
||
| Transportation / Logistics | 2 | $18B |
|
||
| Healthcare | 1 | $247B |
|
||
| Telecommunications | 1 | $55B |
|
||
Price history
+56.1% since first listed12 events — show timeline
- 2026-04-01 Listed $1,155,000 Smart MLS
- 2026-02-12 Listing Removed — Smart MLS
- 2026-02-02 Relisted — Smart MLS
- 2026-02-01 Listing Removed — Smart MLS
- 2025-10-17 Listed $1,155,000 Smart MLS
- 2025-10-13 Coming Soon — Smart MLS
- 2022-03-16 Sold (MLS) $684,950 Smart MLS
- 2022-01-29 Contingent — Smart MLS
- 2022-01-07 Listed $699,900 Smart MLS
- 2021-11-30 Listing Removed — Smart MLS
- 2021-08-19 Price Changed $699,900 Smart MLS
- 2021-07-16 Listed $739,900 Smart MLS
Property tax history
+0.3%/yrLatest (2023): $6,037 · -3.2% YoY. Source: county tax records.
Cash-flow waterfall
monthlySold comps — $/sqft
last 12 mo · ≤1 miLoading sold comps…