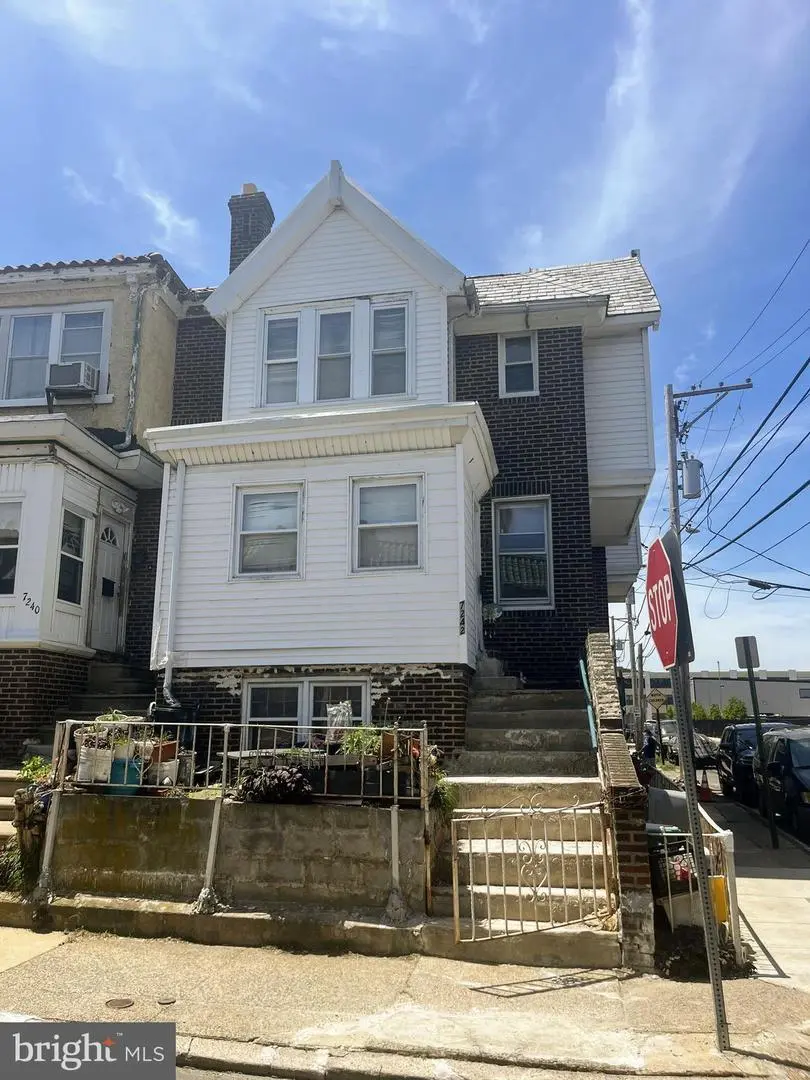
7242 Sansom St · Upper Darby, PA
Flood risk 1/10 · Minimal
- FEMA flood zone
- X (unshaded)
- Chance of flooding over 30 yrs
- 0.0%
- Est. flood insurance / yr
- $473 – $860
Fire risk 1/10 · Minimal
- Est. fire insurance / yr
- $511 – $949
Heat risk 7/10 · Major
- Hot days now (above 103°F)
- 7 days/yr
- Hot days in 30 yrs
- 15 days/yr
Wind risk 6/10 · Moderate
- Chance of severe wind over 30 yrs
- 27.0%
Air-quality risk 4/10 · Minor
- Unhealthy air days now
- 3 days/yr
- Unhealthy air days in 30 yrs
- 6 days/yr
Risk factors via First Street. Map © Google.
Why this score? — see what drove the B- grade
The composite is a weighted blend of 9 inputs, each scored 0–100. Each bar is that input's sub-score; the figure is the points it added to the 100-point composite (weight × sub-score).
- Cash flow +25.5/30.0
- ARV discount +15.0/15.0
- 1% rule +8.9/10.0
- DSCR +8.5/10.0
- Rent growth +2.9/5.0
- Livability +2.5/5.0
- Condition / age +2.5/5.0
- Schools +2.4/10.0
- Appreciation +0.0/10.0
$139,000
🖨 Deal sheet 📄 Offer letter ✓ Due diligence
Listing remarks
Investors special. Big End row house , with lot of possibilities . Property is being offer as -is , and needs full renovation . Bring your ideas and make it yours next project.
Key facts
- Built 1925
- Listed 5 days
Property features AI
Finance
- Other:
- Financial info: Assessed improvement value: $79,150 (per assessor); Assessed land value: $27,060; Total tax assessed value: $106,210 (tax year 2025); Annual taxes approximately $4,795
- HOA & community:
Exterior
- Parking: On-street parking
- Security:
- Utilities: Public water; Public sewer; Natural gas for heating and hot water; Electric for cooling
- Home design: End-of-row townhouse; Fee simple ownership
- Construction: Brick construction; Permanent foundation
- Exterior features: 17 x 70 lot dimensions; No tidal water
Interior
- Kitchen:
- Bedrooms: Four bedrooms on the main level
- Flooring:
- Bathrooms: Three full bathrooms (all on the main level)
- Heating & cooling: Hot water heating; Window air conditioning units (electric)
- Interior features: Finished above-grade living area of 1,716 (per assessor); Walkout-level basement
- Laundry & utility:
Neighborhood map
What this means for you Summary
Snapshot
- This is a 4-bed/2.5-bath townhouse listed at $139k.
Deal economics
- At list price, monthly cash flow is $325 ($4k/yr) — positive.
- The deal already cash-flows at list — no discount required.
- Meets the 1% rule at list price ($2k rent vs $139k).
Location & tenants
- Location reads: area grade B — affects rentability + tenant quality, not the cash-flow math above.
- Upper Darby SD (suburban): math 18% / reading 36% proficiency, ranked #453 of 539 in PA (top 84%) — low school quality limits family demand, transient renter base, plan for 1-2y turnover.
- Market conditions: Rents rising (+1.6%/yr); 129 active listings in the ZIP; 24 comparable units currently listed for rent nearby; rentals at typical pace (median 24d on market — plan ~3-4 weeks tenant-placement turnaround); 299 units permitted in Delaware County in 2024 (5 in 5+ unit buildings).
- This rent runs 41% of the median local income ($57k/yr) — at the standard rent-burdened threshold; future hikes will face affordability resistance.
Forward outlook
- Local home prices are declining (-3.0%/yr); year-one equity from $961 of loan paydown is wiped out by about $4k of value loss. Plan a longer hold.
Negotiation context
- Only 5 days on market — expect competitive offers; lowballing is unlikely to land.
- Current owner paid $36k; list at $139k implies a 286% gain — meaningful room to come down on a strong offer.
Risks & watch-outs
- Watch-outs: property tax is 3.6% of price; built in 1925 — expect roof / HVAC / electrical / plumbing capex.
- Climate carrying-cost: major wind risk, 27% chance of damaging wind over 30y; extreme-heat days projected 7→15/yr by 2055 (HVAC capex compounding) — expect insurance premiums to compound above CPI over the hold.
Questions for the listing agent
- Built in 1925 — when were the roof, HVAC, electrical panel, plumbing, and water heater last replaced?
- Property tax is high relative to price — has the assessment been appealed recently, and will the sale trigger a re-assessment?
- Is there a deadline driving the sale (1031 exchange, divorce, estate, relocation)? That informs how much negotiation room exists.
- What's the average days-on-market for RENTAL listings here right now (not sales)? A rising rental-DOM trend means longer vacancies and softer asking-rent achievability than the comps imply.
- What's the recent tenant-quality profile in this submarket — average credit score on applications, eviction rate, late-payment / NSF rate, and stable-employment percentage? A property-management company in the area should have these aggregated.
- How much new for-sale + rental construction is in the pipeline within 1–3 miles? Heavy new supply typically softens prices + rents 12–24 months out; constrained supply supports both.
Investment metrics
- 1% rule
- 1.39% ✓
- Cap rate
- 9.10%
- Cash-on-cash
- 10.02%
- DSCR
- 1.45
- GRM
- 6.0
CMA / ARV
- ARV (on-the-fly)
- $260,832
- Comps found
- 12
Show comp detail 12 sales within ~0.75 mi
| Address | Dist | Beds/Ba | Sqft | Sold | Price | $/sf | Match |
|---|---|---|---|---|---|---|---|
| 262 Bayard Rd | 0.30mi | 4/2.0 | 1,780 (+4%) | 7mo | $225,000 | $126 | 72 |
| 329 Sanford Rd | 0.33mi | 3/2.0 (-1) | 1,648 (-4%) | 3mo | $222,000 | $135 | 69 |
| 7425 Rogers Ave | 0.38mi | 5/1.5 (+1) | 1,642 (-4%) | 2mo | $309,999 | $189 | 64 |
| 200 Wembly Rd | 0.28mi | 3/2.5 (-1) | 1,524 (-11%) | 0mo | $165,000 | $108 | 63 |
| 35 N State Rd | 0.46mi | 3/1.0 (-1) | 1,734 (+1%) | 4mo | $181,500 | $105 | 63 |
| 432 Grace Rd | 0.47mi | 4/2.0 | 1,545 (-10%) | 1mo | $235,000 | $152 | 59 |
| 244 Wembly Rd | 0.26mi | 3/2.0 (-1) | 1,510 (-12%) | 3mo | $245,000 | $162 | 59 |
| 7409 Miller Ave | 0.36mi | 5/2.5 (+1) | 1,530 (-11%) | 5mo | $245,000 | $160 | 56 |
| 122 Crestview Rd | 0.70mi | 4/1.5 | 1,612 (-6%) | 0mo | $325,000 | $202 | 53 |
| 535 Glendale Rd | 0.57mi | 4/2.5 | 1,904 (+11%) | 5mo | $265,000 | $139 | 51 |
| 101 N Pennock Ave | 0.69mi | 3/1.5 (-1) | 1,582 (-8%) | 3mo | $231,000 | $146 | 43 |
| 291 N Wycombe Ave | 0.63mi | 3/1.0 (-1) | 1,490 (-13%) | 3mo | $257,900 | $173 | 35 |
Match score weights: distance 35% · size 25% · config 20% · recency 20%. Top-matched comps best support the ARV.
Projected returns pro-forma
-3.0% appreciation · 1.62% rent growth · sell at horizon
- IRR
- -3.0%
- Equity multiple
- 0.89×
- Total profit
- $-4,289
- Equity at exit
- $20,725
- IRR
- 4.9%
- Equity multiple
- 1.34×
- Total profit
- $13,074
- Equity at exit
- $12,018
Cash invested: $38,920 (down + closing). Projections, not guarantees.
Landlord ↔ Tenant lean methodology
- Overall (STATE)
- 62 Landlord-Friendly
- State Pennsylvania
- 62 Landlord-Friendly · EVEN
- County
- — inherits STATE
- City
- — inherits STATE
ZIP-level market 19082
- Home prices YoY
- -32.1%
- Rents YoY
- 1.6%
- Active inventory
- 129
- Price-to-rent
- 6.0×
Monthly cashflow live
- Estimated rent
- $1,936 high interval (Pro) →
- Mortgage (P&I)
- −$729
- Tax from tax record
- −$417 /mo · $5,006/yr
- Insurance
- −$58
- HOA
- −$0
- Vacancy / Maint / Mgmt
- −$406
- Net cashflow
- $325
Break-even live
UW: 25.0% down · 7.5% · 30yr · 1.5% tax · 5.0% vac · 8.0% maint · 8.0% mgmt
Financing live
Cash to close
- Down payment
- $34,750
- Closing costs
- $4,170
- Reserves months
- —
- Total cash needed
- —
Loan-product check · same deal, 3 products live
Conventional
25% down · 7.5% · 30yr
- Down + closing
- —
- Monthly P&I
- —
- Monthly cashflow
- —
- DSCR
- —
- Eligible?
- —
Personal DTI + credit; lowest rate.
DSCR
20% down · 8.5% · 30yr
- Down + closing
- —
- Monthly P&I
- —
- Monthly cashflow
- —
- DSCR
- —
- Eligible?
- —
No personal income docs; deal must DSCR.
Hard money
10% down · 12.0% · 12mo
- Down + closing
- —
- Monthly P&I
- —
- Monthly cashflow
- —
- DSCR
- —
- Eligible?
- —
Short-term bridge; refi at stabilization.
Rent comps 24 comps
| Address | Beds | Baths | Sqft | Rent | $/sqft | DOM | Units | Dist |
|---|---|---|---|---|---|---|---|---|
| 228 Bayard Rd Upper Darby, PA | 3.0 | 2.5 | 1600 | $2,095 | $1.31 | 5d | 1 | 0.29mi |
| 55 N Keystone Ave Upper Darby, PA | 3.0 | 1.0 | 1258 | $1,700 | $1.35 | 43d | 1 | 0.33mi |
| 44 Sunshine Rd Upper Darby, PA | 4.0 | 1.0 | 1481 | $1,795 | $1.21 | 21d | 1 | 0.44mi |
| 51 N State Rd Upper Darby, PA | 3.0 | 1.0 | 1244 | $1,595 | $1.28 | 43d | 1 | 0.45mi |
| 430 Glendale Rd Upper Darby, PA | 3.0 | 1.0 | 1090 | $1,650 | $1.51 | 21d | 1 | 0.49mi |
| 317 Barker Ave Lansdowne, PA | 3.0 | 2.0 | 1596 | $2,700 | $1.69 | 23d | 1 | 0.61mi |
| 31 Lamport Rd Upper Darby, PA | 3.0 | 1.0 | 1244 | $1,800 | $1.45 | 5d | 1 | 0.61mi |
| 10 Oakley Rd Upper Darby, PA | 3.0 | 1.0 | 1476 | $1,895 | $1.28 | 24d | 1 | 0.63mi |
| 177 Wellington Rd Upper Darby, PA | 3.0 | 2.0 | 1236 | $2,000 | $1.62 | 24d | 1 | 0.66mi |
| 293 Wabash Ave Lansdowne, PA | 3.0 | 1.0 | 1377 | $1,900 | $1.38 | 18d | 1 | 0.70mi |
| 7216 Clinton Rd Upper Darby, PA | 3.0 | 1.0 | 1170 | $1,815 | $1.55 | 1d | 1 | 0.75mi |
| 7139 Greenwood Ave Upper Darby, PA | 3.0 | 1.0 | 1064 | $1,600 | $1.50 | 24d | 1 | 0.88mi |
| 624 Briarcliff Rd Unit MAIN UNIT Upper Darby Township, PA | 3.0 | 1.0 | 1307 | $1,700 | $1.30 | 24d | 1 | 0.89mi |
| 624 Briarcliff Rd Upper Darby, PA | 3.0 | 1.0 | 1307 | $1,700 | $1.30 | 43d | 1 | 0.89mi |
| 7111 Greenwood Ave Upper Darby, PA | 3.0 | 1.5 | 1064 | $1,800 | $1.69 | 43d | 1 | 0.89mi |
| 6839 Radbourne Rd Upper Darby, PA | 3.0 | 1.5 | 1242 | $1,750 | $1.41 | 24d | 1 | 0.92mi |
| 7147 Radbourne Rd Upper Darby, PA | 3.0 | 1.0 | 1096 | $1,850 | $1.69 | 12d | 1 | 0.93mi |
| 110 N Union Ave Lansdowne, PA | 4.0 | 1.5 | 1678 | $2,345 | $1.40 | 20d | 1 | 1.05mi |
| 58 Suburban Ln Upper Darby, PA | 3.0 | 1.0 | 1152 | $2,300 | $2.00 | 24d | 1 | 1.30mi |
| 2204 Lynn Blvd Drexel Hill, PA | 3.0 | 2.0 | 1120 | $2,300 | $2.05 | 44d | 1 | 1.33mi |
| 249 N Linden Ave Upper Darby, PA | 3.0 | 1.0 | 1237 | $1,700 | $1.37 | 5d | 1 | 1.34mi |
| 261 S Bayberry Ln Upper Darby, PA | 3.0 | 1.0 | 1248 | $2,200 | $1.76 | 2d | 1 | 1.38mi |
| 130 Ivy Ct Upper Darby, PA | 3.0 | 1.0 | 1420 | $2,000 | $1.41 | 2d | 1 | 1.39mi |
| 2219 Ardmore Ave Drexel Hill, PA | 3.0 | 1.0 | 1120 | $2,000 | $1.79 | 43d | 1 | 1.40mi |
Listing history 5 events
-
2026-06-18status $139,000 Pending 5 DOM
-
2026-06-15days on market $139,000 Active 5 DOM
-
2026-06-13days on market $139,000 Active 3 DOM
-
2026-06-13remarks 181-char remark
-
2026-06-13$139,000 Active 2 DOM
ⓘ Source: listings_history table (triggers on properties + properties_extension) + one-shot
backfill from property_details.listing_events for pre-trigger history.
Tax reassessment forecast PA · Partial reset (capped growth)
- Current annual tax
- $5,006 · $417/mo
- Projected year-2 tax
- $5,006 · $417/mo
- Expected delta
- $0/yr ($0/mo · 0.0%)
ⓘ Screening estimate from a state-policy table — verify with the county assessor before closing.
Climate risk First Street
- Flood 1/10 Low FEMA zone X (unshaded) · 0% chance over 30 yrs
- Wildfire 1/10 Low
- Heat 7/10 Severe 7 d/yr ≥103°F today · 15 d/yr by 30 yrs out
- Wind 6/10 Major 27% chance of damaging wind over 30 yrs
- Air quality 4/10 Moderate 3 unhealthy d/yr today · 6 by 30 yrs out
Nearby sold comps map
Loading sold comps map…
Walkable amenities ~0.75 mi
Loading nearby amenities…
Taxation est. · year 1
- Rental income
- $23,227
- − Mortgage interest
- −$7,786
- − Property taxes
- −$5,006
- − Insurance
- −$695
- − Repairs & maintenance
- −$1,858
- − Management
- −$1,858
- − Depreciation
- −$4,044
- Taxable income
- $1,980
- Est. tax owed @ 24.0%
- −$475
- After-tax cash flow
- $3,426/yr
For passive investors: Depreciation is non-cash, so a rental often shows a tax loss while cash-flowing — sheltering income. Rental losses are passive: they offset passive income freely, and up to $25,000/yr can offset ordinary (W-2) income if you actively participate and your MAGI is under $100k (phasing out to $0 by $150k); unused losses carry forward. On sale, claimed depreciation is recaptured at up to 25%, and gains may owe capital-gains tax (a 1031 exchange can defer both). Figures are a year-1 estimate at your 24.0% rate — not tax advice; consult a CPA.
Schools (NCES district)
- District
- Upper Darby SD
- NCES district ID
- 4224320
- Math proficiency
- 18% ▼ -8.00%
- Reading proficiency
- 36% ▼ -10.00%
- Median HH income
- $50,341
- Composite
- 23.68/100
- National rank
- #7837
- State rank
- #453 of 539 in PA
Livability — Upper Darby
No livability data for this city. (Only ~50 U.S. cities are tracked.)
Census & demographics
- County
- Delaware County · 399,863 people
- City population
- 41,541
- Metro
- Philadelphia-Camden-Wilmington, PA-NJ-DE-MD
- Population (ZIP)
- 41,541
- Household income
- $57,108
- Rent vs Own
- Severe rent burden
- 2416.0
Population outlook (Delaware County) Hauer SSP2
- Today (2025)
- 577,490 people
- By 2030
- 581,243 · +0.6%
- By 2040
- 584,700 · +1.2%
- By 2050
- 586,581 · +1.6%
- By 2075
- 598,706 · +3.7%
- By 2100
- 590,823 · +2.3%
Race, ethnicity, and origin ACS 2023
- Neighborhood character
- Highly diverse neighborhood (Simpson 0.71)
- Race & ethnicity
- Black 44% White 21% Asian 17% Hispanic / Latino 13% Two or more races 5%
- Hispanic origin (detail)
- Mexican 3% Puerto Rican 2%
- Common ancestry
- Hispanic 2% Swiss 2% Romanian 1%
- Foreign-born
- 34% · Canada, Vietnam, South Korea
- Languages at home
- 62% English-only · Spanish 11% Other Indo-European 10% French/Haitian/Cajun 5%
Political lean MEDSL · Delaware
- 2024 margin
- Strong D (+23.7) · D 61.4% · R 37.6% · Other 1.0%
- 2008→2024 swing
- +2.3pp toward D · 2008: 21.4pp · 2024: 23.7pp
- All cycles
- 2024: D+23.7 2020: D+26.7 2016: D+22.0 2012: D+21.8 2008: D+21.4
Not yet ingested
- Civics
- —
Market trends
- HPI YoY
- ▼ -161.05%
- Current HPI
- 341.2957
- Rent YoY
- ▲ 1.62%
- Metro
- Philadelphia-Camden-Wilmington, PA-NJ-DE-MD
- State GDP YoY
- ▲ 1.68%
- F500 in state
- 34
Industry mix (Fortune 500 HQ in PA)
| Industry | F500 HQs | Revenue |
|---|---|---|
| Healthcare | 2 | $309B |
|
||
| Insurance | 2 | $27B |
|
||
| Telecommunications / Media | 1 | $124B |
|
||
| Industrial Distribution | 1 | $22B |
|
||
| Financial Services | 1 | $20B |
|
||
| Chemicals / Materials | 1 | $18B |
|
||
Price history
+286.1% since first listed2 events — show timeline
- 2026-06-10 Listed $139,000 BRIGHT MLS
- 1985-05-01 Sold (Public Records) $36,000 Public Records
Property tax history
+3.3%/yrLatest (2026): $5,006 · +7.7% YoY. Source: county tax records.
Cash-flow waterfall
monthlySold comps — $/sqft
last 12 mo · ≤1 miLoading sold comps…