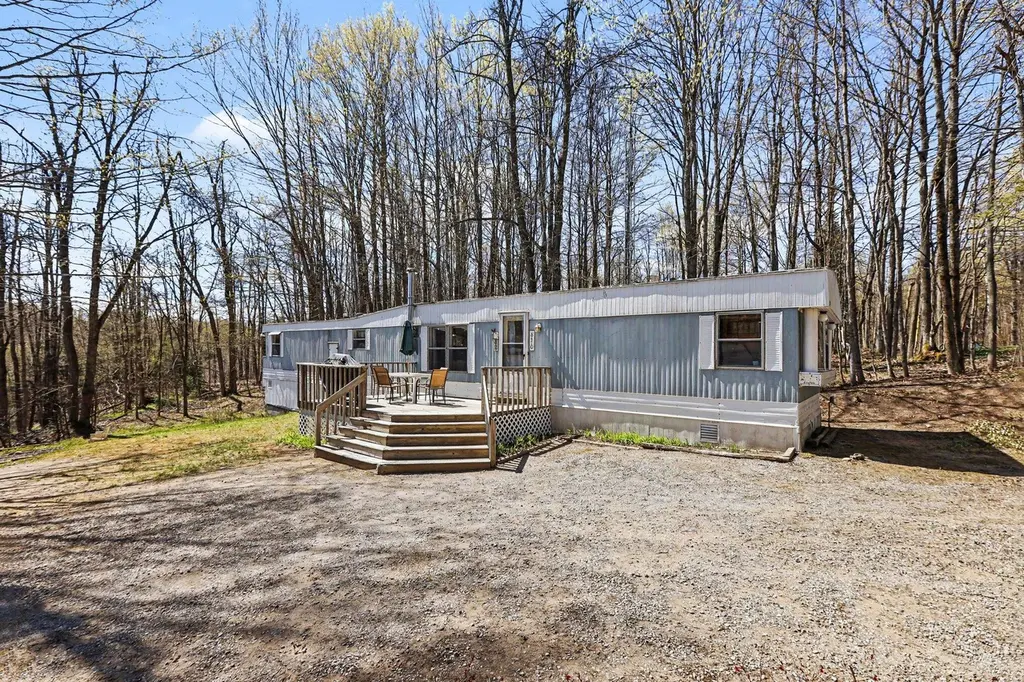
8470 Heatherton Cir · Mancelona, MI
Flood risk 1/10 · Minimal
- FEMA flood zone
- —
- Chance of flooding over 30 yrs
- 0.0%
- Est. flood insurance / yr
- —
Fire risk 3/10 · Minor
- Est. fire insurance / yr
- $784 – $1,456
Heat risk 1/10 · Minimal
- Hot days now (above 93°F)
- 7 days/yr
- Hot days in 30 yrs
- 13 days/yr
Wind risk 1/10 · Minimal
- Chance of severe wind over 30 yrs
- —
Air-quality risk 2/10 · Minimal
- Unhealthy air days now
- 0 days/yr
- Unhealthy air days in 30 yrs
- 1 days/yr
Risk factors via First Street. Map © Google.
Why this score? — see what drove the B- grade
The composite is a weighted blend of 9 inputs, each scored 0–100. Each bar is that input's sub-score; the figure is the points it added to the 100-point composite (weight × sub-score).
- Cash flow +25.6/30.0
- ARV discount +15.0/15.0
- DSCR +8.5/10.0
- 1% rule +6.4/10.0
- Livability +3.9/5.0
- Schools +2.9/10.0
- Rent growth +2.5/5.0
- Condition / age +2.5/5.0
- Appreciation +0.0/10.0
$89,000
🖨 Deal sheet (PDF) 📄 Offer letter ✓ Due diligence
Listing remarks
Affordably priced 3-bedroom, 1.5-bath home located on a double lot in Lakes of the North. This home features a desirable split floorplan with the half bath conveniently located between the second and third bedrooms. Stay cozy during the winter months with the wood stove, while enjoying the flexibility of a layout that would make a great primary residence or vacation getaway. Enjoy the outdoors from the 16x12 front deck overlooking the sloping lot that backs up to HOA common area for added privacy. The property also offers a pull-through driveway, parking space for a trailer, a firepit area, and a 10x10 storage shed. An exterior-access storage basement/crawl space provides extra room for toy
Key facts
- Firepit area
- Front deck
- Wood stove
Tags
Property features AI
Finance
- Other:
- Financial info:
- HOA & community: Homeowners association with an annual fee of $605 (approximately $50.42/month)
Exterior
- Parking:
- Security:
- Utilities: Well water; Septic tank; Propane service
- Home design: Single-family residence; Residential property
- Construction:
- Exterior features: Deck; Shed(s); On waterfront (Harold/Pencil); Paved road access
Interior
- Kitchen: Dishwasher; Microwave; Refrigerator; Oven; Range
- Bedrooms: Master downstairs
- Flooring: Simulated wood
- Bathrooms: 1 full bathroom; 1 half bathroom
- Heating & cooling: Forced air heating; Propane heating; Wood heating (wood stove/firewood); Ceiling fan(s); Has cooling
- Interior features: Primary bedroom on the main level; Blinds on windows; Fireplace; Basement with crawl space
- Laundry & utility: Washer; Dryer; Laundry on the main level
Neighborhood map
What this means for you Summary
Snapshot
- This is a 3-bed/1.5-bath manufactured listed at $89k.
Deal economics
- At list price, monthly cash flow is $212 ($3k/yr) — positive.
- The deal already cash-flows at list — no discount required.
- Meets the 1% rule at list price ($1k rent vs $89k).
- Recommended offer: $86k (3.0% below list) — sets the bar for market timing.
- Cap rate 9.1% vs local median 3.4% in Mancelona — top-decile yield for the area; either an underpriced asset or a hidden risk that comps aren't pricing in. Stress-test before assuming the spread holds.
Location & tenants
- Location reads 78/100 on livability (#105 in MI, #2,568 nationally) — a middle-class / working-renter tenant base. Strengths: cost of living A+, housing A+, health & safety A+; Watch: amenities F, commute F, employment D-.
- Mancelona Public Schools (rural): math 28% / reading 41% proficiency, ranked #310 of 540 in MI (top 57%) — families likely to look elsewhere, expect single-tenant / working-renter base with shorter leases; 60% free/reduced lunch — lower-income household profile, screen leases tightly.
- Zoned schools: Mancelona Elementary School (math 32% / reading 27%, grade F, #866 of 1,397 statewide, top 65%, 328 students, 75% FRL); Mancelona Middle School (math 27% / reading 47%, grade F, #248 of 493 statewide, top 53%, 244 students, 78% FRL); Mancelona High School (math 24% / reading 34%, grade F, #441 of 713 statewide, top 64%, 286 students, 73% FRL) — zoned schools average 76% FRL vs 60% district-wide (15 pts higher); higher-poverty schools than district average — tighter screening recommended.
- Market conditions: 155 active listings in the ZIP; 101 units permitted in Antrim County in 2024 (0 in 5+ unit buildings).
Forward outlook
- Local home prices are declining (-3.0%/yr); year-one equity from $615 of loan paydown is wiped out by about $3k of value loss. Plan a longer hold.
- Antrim County population projected at -27% by 2050 — secular population decline; favor cash flow + early exit over multi-decade hold.
Negotiation context
- It's been on market 38 days — a 3% lower offer ($86k) is reasonable based on typical stale-listing flexibility.
- Current owner paid $35k; list at $89k implies a 154% gain — meaningful room to come down on a strong offer.
Questions for the listing agent
- It's been on market 38 days. Have you received any prior offers? Is the seller open to a 3% concession, seller financing, or rate buy-down credit?
- What does the HOA fee cover, when was the last increase, and are there any pending special assessments or reserve-fund shortfalls?
- Is there a deadline driving the sale (1031 exchange, divorce, estate, relocation)? That informs how much negotiation room exists.
- Schools are D-rated, which usually means shorter tenancies and higher turnover. Who's the typical renter profile here, and what's been the actual vacancy rate?
- What's the average days-on-market for RENTAL listings here right now (not sales)? A rising rental-DOM trend means longer vacancies and softer asking-rent achievability than the comps imply.
- What's the recent tenant-quality profile in this submarket — average credit score on applications, eviction rate, late-payment / NSF rate, and stable-employment percentage? A property-management company in the area should have these aggregated.
- How much new for-sale + rental construction is in the pipeline within 1–3 miles? Heavy new supply typically softens prices + rents 12–24 months out; constrained supply supports both.
Investment metrics
- 1% rule
- 1.14% ✓
- Cap rate
- 9.15%
- Cash-on-cash
- 10.19%
- DSCR
- 1.45
- GRM
- 7.3
CMA / ARV
- ARV (median comp)
- $114,376
- List price
- $89,000
- Delta
- -22.19%
- Verdict
- UNDERPRICED
- Comps
- 16 within 1.0 mi
Projected returns pro-forma
-3.0% appreciation · 3.0% rent growth · sell at horizon
- IRR
- -1.0%
- Equity multiple
- 0.96×
- Total profit
- $-940
- Equity at exit
- $13,270
- IRR
- 8.7%
- Equity multiple
- 1.66×
- Total profit
- $16,542
- Equity at exit
- $7,695
Cash invested: $24,920 (down + closing). Projections, not guarantees.
Landlord ↔ Tenant lean methodology
- Overall (STATE)
- 62 Landlord-Friendly
- State Michigan
- 62 Landlord-Friendly · EVEN
- County
- — inherits STATE
- City
- — inherits STATE
ZIP-level market 49659
- Home prices YoY
- -29.7%
- Active inventory
- 155
- Price-to-rent
- 7.3×
Monthly cashflow live
- Estimated rent
- $1,015 medium interval (Pro) →
- Mortgage (P&I)
- −$467
- Tax from tax record
- −$36 /mo · $436/yr
- Insurance
- −$37
- HOA
- −$50
- Vacancy / Maint / Mgmt
- −$213
- Net cashflow
- $212
Break-even live
Sensitivity live
| Price | -10% $262 | -5% $237 | +0% $212 | +5% $186 | +10% $161 |
|---|---|---|---|---|---|
| Rent | -10% $132 | -5% $172 | +0% $212 | +5% $252 | +10% $292 |
| Rate | -1.0pp $257 | -0.5pp $234 | base $212 | +0.5pp $189 | +1.0pp $165 |
UW: 25.0% down · 7.5% · 30yr · 1.5% tax · 5.0% vac · 8.0% maint · 8.0% mgmt
Financing live
Cash to close
- Down payment
- $22,250
- Closing costs
- $2,670
- Reserves months
- —
- Total cash needed
- —
Loan-product check · same deal, 3 products live
Conventional
25% down · 7.5% · 30yr
- Down + closing
- —
- Monthly P&I
- —
- Monthly cashflow
- —
- DSCR
- —
- Eligible?
- —
Personal DTI + credit; lowest rate.
DSCR
20% down · 8.5% · 30yr
- Down + closing
- —
- Monthly P&I
- —
- Monthly cashflow
- —
- DSCR
- —
- Eligible?
- —
No personal income docs; deal must DSCR.
Hard money
10% down · 12.0% · 12mo
- Down + closing
- —
- Monthly P&I
- —
- Monthly cashflow
- —
- DSCR
- —
- Eligible?
- —
Short-term bridge; refi at stabilization.
HOA detail
- Monthly dues
- $50 · $600/yr
Listing history 20 events
-
2026-06-21days on market $89,000 Active 38 DOM
-
2026-06-21days on market $89,000 Active 37 DOM
-
2026-06-18days on market $89,000 Active 35 DOM
-
2026-06-17days on market $89,000 Active 34 DOM
-
2026-06-16days on market $89,000 Active 33 DOM
-
2026-06-15days on market $89,000 Active 32 DOM
-
2026-06-13days on market $89,000 Active 30 DOM
-
2026-06-12days on market $89,000 Active 29 DOM
-
2026-06-09days on market $89,000 Active 26 DOM
-
2026-06-08days on market $89,000 Active 25 DOM
-
2026-06-07days on market $89,000 Active 24 DOM
-
2026-06-05days on market $89,000 Active 22 DOM
-
2026-06-04days on market $89,000 Active 20 DOM
-
2026-06-02days on market $89,000 Active 19 DOM
-
2026-06-01days on market $89,000 Active 18 DOM
-
2026-05-31days on market $89,000 Active 17 DOM
-
2026-05-31days on market $89,000 Active 16 DOM
-
2026-05-14$89,000 Active 795-char remark
-
2003-11-24soldstatus $35,000
-
2000-10-09soldstatus $34,000
ⓘ Source: listings_history table (triggers on properties + properties_extension) + one-shot
backfill from property_details.listing_events for pre-trigger history.
Tax reassessment forecast MI · Partial reset (capped growth)
- Current annual tax
- $436 · $36/mo
- Projected year-2 tax
- $903 · $75/mo
- Expected delta
- +$467/yr (+$39/mo · 107.1%)
ⓘ Screening estimate from a state-policy table — verify with the county assessor before closing.
Climate risk First Street
- Flood 1/10 Low 0% chance over 30 yrs
- Wildfire 3/10 Moderate
- Heat 1/10 Low 7 d/yr ≥93°F today · 13 d/yr by 30 yrs out
- Wind 1/10 Low
- Air quality 2/10 Low 0 unhealthy d/yr today · 1 by 30 yrs out
Nearby sold comps map
Loading sold comps map…
Walkable amenities ~0.75 mi
Loading nearby amenities…
Taxation est. · year 1
- Rental income
- $12,180
- − Mortgage interest
- −$4,985
- − Property taxes
- −$436
- − Insurance
- −$445
- − Repairs & maintenance
- −$974
- − Management
- −$974
- − HOA
- −$600
- − Depreciation
- −$2,589
- Taxable income
- $1,175
- Est. tax owed @ 24.0%
- −$282
- After-tax cash flow
- $2,258/yr
For passive investors: Depreciation is non-cash, so a rental often shows a tax loss while cash-flowing — sheltering income. Rental losses are passive: they offset passive income freely, and up to $25,000/yr can offset ordinary (W-2) income if you actively participate and your MAGI is under $100k (phasing out to $0 by $150k); unused losses carry forward. On sale, claimed depreciation is recaptured at up to 25%, and gains may owe capital-gains tax (a 1031 exchange can defer both). Figures are a year-1 estimate at your 24.0% rate — not tax advice; consult a CPA.
Schools (NCES district)
- District
- Mancelona Public Schools
- NCES district ID
- 2622350
- Math proficiency
- 28% ▼ -5.00%
- Reading proficiency
- 41% ▼ -9.00%
- Median HH income
- $39,613
- Composite
- 28.89/100
- National rank
- #6639
- State rank
- #310 of 540 in MI
Livability — Mancelona
- Score
- 78/100
- State rank
- #105
- US rank
- #2568
Category grades
Schools grade is shown separately in the Schools card above.
Census & demographics
- Census place
- Lakes of the North, MI
- Population (ZIP)
- 7,226
Population outlook (Antrim County) Hauer SSP2
- Today (2025)
- 21,804 people
- By 2030
- 20,814 · -4.5%
- By 2040
- 18,394 · -15.6%
- By 2050
- 15,981 · -26.7%
- By 2075
- 11,712 · -46.3%
- By 2100
- 7,651 · -64.9%
Race, ethnicity, and origin ACS 2023
- Neighborhood character
- Predominantly White (93%)
- Race & ethnicity
- White 93% Two or more races 4% Hispanic / Latino 3%
- Common ancestry
- Lithuanian 7% Romanian 5% Italian 4%
- Foreign-born
- 1% · Canada
Political lean MEDSL · Antrim
- 2024 margin
- Strong R (+23.8) · D 37.5% · R 61.2% · Other 1.2%
- 2008→2024 swing
- -13.4pp toward R · 2008: -10.3pp · 2024: -23.8pp
- All cycles
- 2024: R+23.8 2020: R+23.8 2016: R+29.6 2012: R+21.3 2008: R+10.3
Not yet ingested
- Civics
- —
Market trends
- HPI YoY
- ▼ -103.79%
- Current HPI
- 245.5937
- Rent YoY
- —
- Metro
- —
- State GDP YoY
- ▲ 1.37%
- F500 in state
- 28
Industry mix (Fortune 500 HQ in MI)
| Industry | F500 HQs | Revenue |
|---|---|---|
| Automotive Parts | 3 | $48B |
|
||
| Automotive | 2 | $372B |
|
||
| Chemicals | 1 | $45B |
|
||
| Automotive Retail | 1 | $29B |
|
||
| Healthcare / Medical Devices | 1 | $23B |
|
||
| Automotive Technology | 1 | $20B |
|
||
Price history
+161.8% since first listed3 events — show timeline
- 2026-05-14 Listed $89,000 WWMLS
- 2003-11-24 Sold (Public Records) $35,000 Public Records
- 2000-10-09 Sold (Public Records) $34,000 Public Records
Property tax history
+2.5%/yrLatest (2025): $436 · +3.1% YoY. Source: county tax records.
Cash-flow waterfall
monthlySold comps — $/sqft
last 12 mo · ≤1 miLoading sold comps…