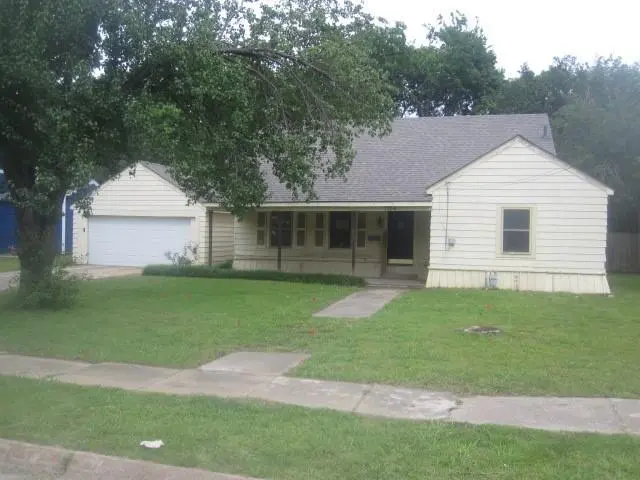
1104 Park Ave · Bonham, TX
Flood risk 1/10 · Minimal
- FEMA flood zone
- X (unshaded)
- Chance of flooding over 30 yrs
- 0.0%
- Est. flood insurance / yr
- $507 – $1,088
Fire risk 6/10 · Moderate
- Est. fire insurance / yr
- $1,222 – $2,270
Heat risk 7/10 · Major
- Hot days now (above 111°F)
- 7 days/yr
- Hot days in 30 yrs
- 22 days/yr
Wind risk 4/10 · Minor
- Chance of severe wind over 30 yrs
- 24.0%
Air-quality risk 2/10 · Minimal
- Unhealthy air days now
- 1 days/yr
- Unhealthy air days in 30 yrs
- 1 days/yr
Risk factors via First Street. Map © Google.
Why this score? — see what drove the B+ grade
The composite is a weighted blend of 9 inputs, each scored 0–100. Each bar is that input's sub-score; the figure is the points it added to the 100-point composite (weight × sub-score).
- Cash flow +30.0/30.0
- ARV discount +15.0/15.0
- DSCR +10.0/10.0
- 1% rule +9.8/10.0
- Schools +3.2/10.0
- Livability +3.2/5.0
- Rent growth +2.5/5.0
- Condition / age +2.5/5.0
- Appreciation +0.0/10.0
$100,000
🖨 Deal sheet 📄 Offer letter ✓ Due diligence
Listing remarks
Large home offering 2 bedrooms, 1 bath large living and dining areas and bonus room or third bedroom on second level needing some TLC. 2 car garage, large semi private backyard with small deck with patio area. Case # 491-882140 More properties may be found on HudHomeStore. gov. The Seller is selling this property in As Is condition. Seller nor its representatives make any representations or warranties regarding the Property. Visit rainecompany.com for information. Information deemed reliable but not guaranteed.
Key facts
- 0.24 acre lot
- 2 garage spots
- Built 1941
Property features AI
Finance
- Other: HUD-owned property; keys must not be given to buyer and home will be re-keyed after closing; Possession at closing/funding
- Financial info: Treat as clear loan type; No second mortgage
- HOA & community: No homeowners association
Exterior
- Parking: Attached garage with 2 covered spaces (2-car garage)
- Security: No specific security features provided
- Utilities: City water; City sewer; Cable available; Electric service available
- Home design: Single-family residence; Attached property; One and one-half story; Built in 1941; Located in Inglish Add subdivision
- Construction: Year built: 1941; No additional construction material or roof/foundation details provided
- Exterior features: Lot under 0.5 acre (approx. 0.235 acre); All-weather road
Interior
- Kitchen: Plumbed for gas in kitchen; Garbage disposal
- Bedrooms: 3 bedrooms (primary bedroom on main level)
- Flooring: No flooring details provided
- Bathrooms: 1 full bathroom
- Heating & cooling: No heating or cooling details provided
- Interior features: Cable TV available; Plumbed for gas in kitchen; Garbage disposal
- Laundry & utility: No specific laundry details provided
Neighborhood map
What this means for you Summary
Snapshot
- This is a 3-bed/1.0-bath single-family listed at $100k.
Deal economics
- At list price, monthly cash flow is $404 ($5k/yr) — positive.
- The deal already cash-flows at list — no discount required.
- Meets the 1% rule at list price ($1k rent vs $100k).
- Recommended offer: $98k (1.5% below list) — sets the bar for market timing.
- Cap rate 11.1% vs local median 3.5% in Bonham — top-decile yield for the area; either an underpriced asset or a hidden risk that comps aren't pricing in. Stress-test before assuming the spread holds.
Location & tenants
- Location reads 64/100 on livability (#785 in TX) — a middle-class / working-renter tenant base. Strengths: crime A+, cost of living A+, housing A+; Watch: employment D, schools D-, amenities F.
- Bonham ISD (town): math 37% / reading 38% proficiency, ranked #477 of 826 in TX (top 58%) — families likely to look elsewhere, expect single-tenant / working-renter base with shorter leases.
- Market conditions: 277 active listings in the ZIP; 12 comparable units currently listed for rent nearby; rentals lingering (median 44d on market — plan ~5-8 weeks vacancy on turnover, expect pricing pressure); 83% of comp listings sitting > 30 days — soft ceiling on asking rent; 82 units permitted in Fannin County in 2024 (0 in 5+ unit buildings).
Forward outlook
- Local home prices are declining (-3.0%/yr); year-one equity from $691 of loan paydown is wiped out by about $3k of value loss. Plan a longer hold.
- Fannin County population projected to shrink 6% by 2050 — rents likely to lag national; underwrite the cash flow, not the appreciation.
- At projected returns (-3.0% appreciation + 3.0% rent growth), your $28k cash investment doubles in ~7 years — after that, you're playing with house money.
Negotiation context
- It's been on market 25 days — a 2% lower offer ($98k) is reasonable based on typical stale-listing flexibility.
- 6 sale attempts since 21y ago with the ask held roughly flat each time — persistent listings suggest the price (not the market) is what's stuck; bring a comps-based counter.
Risks & watch-outs
- Watch-outs: built in 1941 — expect roof / HVAC / electrical / plumbing capex.
- Climate carrying-cost: major wildfire risk; extreme-heat days projected 7→22/yr by 2055 (HVAC capex compounding) — expect insurance premiums to compound above CPI over the hold.
Questions for the listing agent
- Built in 1941 — when were the roof, HVAC, electrical panel, plumbing, and water heater last replaced?
- Is there a deadline driving the sale (1031 exchange, divorce, estate, relocation)? That informs how much negotiation room exists.
- Schools are D-rated, which usually means shorter tenancies and higher turnover. Who's the typical renter profile here, and what's been the actual vacancy rate?
- What's the average days-on-market for RENTAL listings here right now (not sales)? A rising rental-DOM trend means longer vacancies and softer asking-rent achievability than the comps imply.
- What's the recent tenant-quality profile in this submarket — average credit score on applications, eviction rate, late-payment / NSF rate, and stable-employment percentage? A property-management company in the area should have these aggregated.
- How much new for-sale + rental construction is in the pipeline within 1–3 miles? Heavy new supply typically softens prices + rents 12–24 months out; constrained supply supports both.
Investment metrics
- 1% rule
- 1.48% ✓
- Cap rate
- 11.15%
- Cash-on-cash
- 17.33%
- DSCR
- 1.77
- GRM
- 5.6
CMA / ARV
- ARV (on-the-fly)
- $195,730
- Comps found
- 12
Show comp detail 12 sales within ~0.75 mi
| Address | Dist | Beds/Ba | Sqft | Sold | Price | $/sf | Match |
|---|---|---|---|---|---|---|---|
| 1320 Elm St | 0.20mi | 3/2.0 | 1,549 (-9%) | 1mo | $185,000 | $119 | 70 |
| 417 E 8th St | 0.21mi | 2/1.5 (-1) | 1,622 (-5%) | 6mo | $159,000 | $98 | 70 |
| 204 W Boyd Ave | 0.53mi | 3/2.0 | 1,680 (-1%) | 4mo | $155,000 | $92 | 66 |
| 820 Lipscomb St | 0.49mi | 3/2.0 | 1,769 (+4%) | 4mo | $225,000 | $127 | 63 |
| 621 W 12th St | 0.62mi | 3/2.0 | 1,708 (+0%) | 6mo | $99,900 | $58 | 61 |
| 1016 Poplar St | 0.48mi | 3/2.5 | 1,680 (-1%) | 12mo | $169,900 | $101 | 60 |
| 608 W 6th St | 0.67mi | 3/2.0 | 1,699 (-0%) | 13mo | $185,000 | $109 | 54 |
| 1820 Franklin Ave | 0.74mi | 3/3.0 | 1,693 (-0%) | 12mo | $230,000 | $136 | 46 |
| 1313 Franklin Ave | 0.41mi | 3/2.0 | 1,446 (-15%) | 9mo | $264,500 | $183 | 45 |
| 520 Allen Ave | 0.63mi | 2/1.0 (-1) | 1,594 (-6%) | 13mo | $75,000 | $47 | 44 |
| 709 Beech St | 0.67mi | 2/2.0 (-1) | 1,563 (-8%) | 3mo | $180,000 | $115 | 44 |
| 328 Boyd Loop | 0.60mi | 3/1.5 | 1,452 (-15%) | 7mo | $195,000 | $134 | 40 |
Match score weights: distance 35% · size 25% · config 20% · recency 20%. Top-matched comps best support the ARV.
Projected returns pro-forma
-3.0% appreciation · 3.0% rent growth · sell at horizon
- IRR
- 8.7%
- Equity multiple
- 1.34×
- Total profit
- $9,626
- Equity at exit
- $14,910
- IRR
- 18.0%
- Equity multiple
- 2.49×
- Total profit
- $41,836
- Equity at exit
- $8,646
Cash invested: $28,000 (down + closing). Projections, not guarantees.
Landlord ↔ Tenant lean methodology
- Overall (STATE)
- 87 Strongly Landlord-Friendly
- State Texas
- 87 Strongly Landlord-Friendly · R+5
- County
- — inherits STATE
- City
- — inherits STATE
ZIP-level market 75418
- Home prices YoY
- -8.9%
- Active inventory
- 277
- Price-to-rent
- 5.6×
Monthly cashflow live
- Estimated rent
- $1,484 high interval (Pro) →
- Mortgage (P&I)
- −$524
- Tax from tax record
- −$202 /mo · $2,419/yr
- Insurance
- −$42
- HOA
- −$0
- Vacancy / Maint / Mgmt
- −$312
- Net cashflow
- $404
Break-even live
UW: 25.0% down · 7.5% · 30yr · 1.5% tax · 5.0% vac · 8.0% maint · 8.0% mgmt
Financing live
Cash to close
- Down payment
- $25,000
- Closing costs
- $3,000
- Reserves months
- —
- Total cash needed
- —
Loan-product check · same deal, 3 products live
Conventional
25% down · 7.5% · 30yr
- Down + closing
- —
- Monthly P&I
- —
- Monthly cashflow
- —
- DSCR
- —
- Eligible?
- —
Personal DTI + credit; lowest rate.
DSCR
20% down · 8.5% · 30yr
- Down + closing
- —
- Monthly P&I
- —
- Monthly cashflow
- —
- DSCR
- —
- Eligible?
- —
No personal income docs; deal must DSCR.
Hard money
10% down · 12.0% · 12mo
- Down + closing
- —
- Monthly P&I
- —
- Monthly cashflow
- —
- DSCR
- —
- Eligible?
- —
Short-term bridge; refi at stabilization.
Rent comps 12 comps
| Address | Beds | Baths | Sqft | Rent | $/sqft | DOM | Units | Dist |
|---|---|---|---|---|---|---|---|---|
| 1014 Pine St Bonham, TX | 3.0 | 2.0 | 1200 | $1,475 | $1.23 | 44d | 1 | 0.13mi |
| 808 E 12th St Bonham, TX | 3.0 | 2.0 | 1234 | $1,595 | $1.29 | 19d | 1 | 0.27mi |
| 412 E 7th St Unit 2 Bonham, TX | 3.0 | 2.5 | 1366 | $1,500 | $1.10 | 44d | 1 | 0.29mi |
| 317 Jones St Bonham, TX | 3.0 | 2.0 | 1067 | $1,500 | $1.41 | 44d | 1 | 0.40mi |
| 224 E Boyd St Bonham, TX | 3.0 | 1.0 | 1196 | $1,245 | $1.04 | 44d | 1 | 0.50mi |
| 613 E 3rd St Bonham, TX | 3.0 | 2.0 | 1197 | $1,299 | $1.09 | 22d | 1 | 0.53mi |
| 406 W 6th St Bonham, TX | 3.0 | 2.0 | 1198 | $1,350 | $1.13 | 44d | 1 | 0.56mi |
| 608 E 3rd St Unit 2 Bonham, TX | 3.0 | 2.0 | 1197 | $1,295 | $1.08 | 44d | 1 | 0.57mi |
| 229 E Evans Ave Bonham, TX | 3.0 | 2.0 | 1090 | $1,264 | $1.16 | 44d | 1 | 0.69mi |
| 913 W 12th St Bonham, TX | 3.0 | 2.0 | 1355 | $1,700 | $1.25 | 44d | 1 | 0.78mi |
| 406 S 6th St Unit 1 Bonham, TX | 3.0 | 2.0 | 1198 | $1,300 | $1.09 | 44d | 1 | 0.98mi |
| 805 S 6th St Unit 1 Bonham, TX | 3.0 | 2.5 | 1229 | $1,450 | $1.18 | 44d | 1 | 1.07mi |
Listing history 27 events
-
2026-06-13status $100,000 Pending 25 DOM
-
2026-06-12days on market $100,000 Active Contingent 25 DOM
-
2026-06-09days on market $100,000 Active Contingent 22 DOM
-
2026-06-08days on market $100,000 Active Contingent 21 DOM
-
2026-06-07days on market $100,000 Active Contingent 20 DOM
-
2026-06-05statusdays on market $100,000 Active Contingent 18 DOM
-
2026-06-04days on market $100,000 Active 16 DOM
-
2026-06-02days on market $100,000 Active 15 DOM
-
2026-06-01days on market $100,000 Active 14 DOM
-
2026-05-31days on market $100,000 Active 13 DOM
-
2026-05-31days on market $100,000 Active 12 DOM
-
2026-05-18$100,000 Active
-
2022-08-19status Active
-
2022-08-17historical Active Option Contract
-
2022-07-01status Active
-
2022-06-13status Pending
-
2022-06-07historical Active Option Contract
-
2022-06-03$139,000 Active
-
2022-03-31soldstatus
-
2022-01-24historical
-
2022-01-07price $150,000
-
2021-11-23price $165,000
-
2021-09-15$175,000 Active
-
2006-05-18soldstatus
-
2006-05-12soldstatus
-
2006-05-01historical
-
2005-12-15$64,000
ⓘ Source: listings_history table (triggers on properties + properties_extension) + one-shot
backfill from property_details.listing_events for pre-trigger history.
Tax reassessment forecast TX · Resets to sale price
- Current annual tax
- $2,419 · $202/mo
- Projected year-2 tax
- $2,419 · $202/mo
- Expected delta
- $0/yr ($0/mo · 0.0%)
ⓘ Screening estimate from a state-policy table — verify with the county assessor before closing.
Climate risk First Street
- Flood 1/10 Low FEMA zone X (unshaded) · 0% chance over 30 yrs
- Wildfire 6/10 Major
- Heat 7/10 Severe 7 d/yr ≥111°F today · 22 d/yr by 30 yrs out
- Wind 4/10 Moderate 24% chance of damaging wind over 30 yrs
- Air quality 2/10 Low 1 unhealthy d/yr today · 1 by 30 yrs out
Nearby sold comps map
Loading sold comps map…
Walkable amenities ~0.75 mi
Loading nearby amenities…
Taxation est. · year 1
- Rental income
- $17,805
- − Mortgage interest
- −$5,602
- − Property taxes
- −$2,419
- − Insurance
- −$500
- − Repairs & maintenance
- −$1,424
- − Management
- −$1,424
- − Depreciation
- −$2,909
- Taxable income
- $3,526
- Est. tax owed @ 24.0%
- −$846
- After-tax cash flow
- $4,007/yr
For passive investors: Depreciation is non-cash, so a rental often shows a tax loss while cash-flowing — sheltering income. Rental losses are passive: they offset passive income freely, and up to $25,000/yr can offset ordinary (W-2) income if you actively participate and your MAGI is under $100k (phasing out to $0 by $150k); unused losses carry forward. On sale, claimed depreciation is recaptured at up to 25%, and gains may owe capital-gains tax (a 1031 exchange can defer both). Figures are a year-1 estimate at your 24.0% rate — not tax advice; consult a CPA.
Schools (NCES district)
- District
- Bonham ISD
- NCES district ID
- 4810800
- Math proficiency
- 37% ▼ -1.00%
- Reading proficiency
- 38% ▼ -2.00%
- Median HH income
- $41,740
- Composite
- 31.63/100
- National rank
- #5937
- State rank
- #477 of 826 in TX
Livability — Bonham
- Score
- 64/100
- State rank
- #785
- US rank
- #14360
Category grades
Schools grade is shown separately in the Schools card above.
Census & demographics
- Census place
- Bonham, TX
- County
- Fannin County · 15,155 people
- City population
- 15,155
- Metro
- Bonham, TX
- Population (ZIP)
- 15,155
- Household income
- $68,918
- Rent vs Own
- Severe rent burden
- 281.0
Population outlook (Fannin County) Hauer SSP2
- Today (2025)
- 33,423 people
- By 2030
- 33,035 · -1.2%
- By 2040
- 32,250 · -3.5%
- By 2050
- 31,462 · -5.9%
- By 2075
- 29,447 · -11.9%
- By 2100
- 25,459 · -23.8%
Race, ethnicity, and origin ACS 2023
- Neighborhood character
- Predominantly White (68%)
- Race & ethnicity
- White 68% Hispanic / Latino 17% Black 10% Two or more races 8%
- Hispanic origin (detail)
- Mexican 16%
- Common ancestry
- Lithuanian 3% Slovak 1% Italian 1%
- Foreign-born
- 7% · Canada, Philippines
- Languages at home
- 85% English-only · Spanish 14%
Political lean MEDSL · Fannin
- 2024 margin
- Solid R (+67.4) · D 15.9% · R 83.3%
- 2008→2024 swing
- -27.8pp toward R · 2008: -39.6pp · 2024: -67.4pp
- All cycles
- 2024: R+67.4 2020: R+63.4 2016: R+61.9 2012: R+52.5 2008: R+39.6
Not yet ingested
- Civics
- —
Market trends
- HPI YoY
- ▼ -25.59%
- Current HPI
- 262.7177
- Rent YoY
- —
- Metro
- Bonham, TX
- State GDP YoY
- ▲ 3.95%
- F500 in state
- 110
Industry mix (Fortune 500 HQ in TX)
| Industry | F500 HQs | Revenue |
|---|---|---|
| Energy | 16 | $1,198B |
|
||
| Technology | 5 | $198B |
|
||
| Engineering / Construction | 4 | $72B |
|
||
| Energy Services | 3 | $60B |
|
||
| Utilities | 3 | $41B |
|
||
| Healthcare | 2 | $330B |
|
||
Price history
+56.2% since first listed16 events — show timeline
- 2026-05-18 Listed $100,000 NTREIS
- 2022-08-19 Relisted — NTREIS
- 2022-08-17 Contingent — NTREIS
- 2022-07-01 Relisted — NTREIS
- 2022-06-13 Pending — NTREIS
- 2022-06-07 Contingent — NTREIS
- 2022-06-03 Listed $139,000 NTREIS
- 2022-03-31 Sold (Public Records) — Public Records
- 2022-01-24 Listing Removed — NTREIS
- 2022-01-07 Price Changed $150,000 NTREIS
- 2021-11-23 Price Changed $165,000 NTREIS
- 2021-09-15 Listed $175,000 NTREIS
- 2006-05-18 Sold (Public Records) — Public Records
- 2006-05-12 Sold (MLS) — NTREIS
- 2006-05-01 Listing Removed — NTREIS
- 2005-12-15 Listed $64,000 NTREIS
Property tax history
+6.5%/yrLatest (2025): $2,419 · +0.2% YoY. Source: county tax records.
Cash-flow waterfall
monthlySold comps — $/sqft
last 12 mo · ≤1 miLoading sold comps…