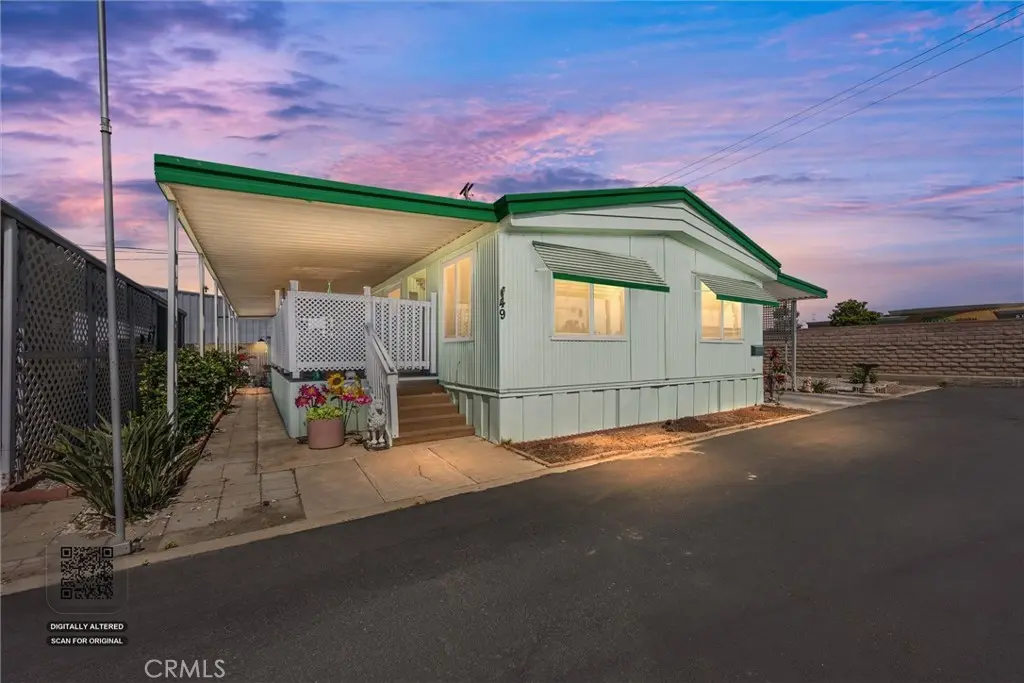
9131 Rosedale Hwy #49 · Greenacres, CA
Flood risk 1/10 · Minimal
- FEMA flood zone
- X (unshaded)
- Chance of flooding over 30 yrs
- 0.0%
- Est. flood insurance / yr
- $507 – $1,088
Fire risk 4/10 · Minor
- Est. fire insurance / yr
- $659 – $1,223
Heat risk 8/10 · Major
- Hot days now (above 104°F)
- 7 days/yr
- Hot days in 30 yrs
- 16 days/yr
Wind risk 1/10 · Minimal
- Chance of severe wind over 30 yrs
- —
Air-quality risk 10/10 · Severe
- Unhealthy air days now
- 42 days/yr
- Unhealthy air days in 30 yrs
- 45 days/yr
Risk factors via First Street. Map © Google.
Why this score? — see what drove the C+ grade
The composite is a weighted blend of 9 inputs, each scored 0–100. Each bar is that input's sub-score; the figure is the points it added to the 100-point composite (weight × sub-score).
- Cash flow +30.0/30.0
- 1% rule +10.0/10.0
- DSCR +10.0/10.0
- Condition / age +3.8/5.0
- Livability +3.1/5.0
- Rent growth +3.0/5.0
- Schools +2.4/10.0
- ARV discount +0.0/15.0
- Appreciation +0.0/10.0
$104,000
🖨 Deal sheet 📄 Offer letter ✓ Due diligence
Listing remarks
Welcome to Greenacres 55+ community living! Located just minutes from major retail centers, popular restaurants, grocery stores, a movie theater, and everyday conveniences, this property places everything you need close to home. This well-maintained home has seen numerous updates, including a beautifully remodeled kitchen in 2023 featuring quartz countertops, a custom tile backsplash, and stainless-steel appliances. New vinyl flooring was installed throughout in 2021, and the primary bathroom was updated with a walk-in shower and handicap-accessible safety rails for added comfort and convenience. Additional improvements include a new HVAC system installed in 2022, as well as exterior paint
Key facts
- Quartz countertops
- Vinyl flooring
- Remodeled kitchen
Tags
Property features AI
Finance
- Other: Directions: From Coffee and Rosedale Hwy, head west on Rosedale Hwy and south into park
- Financial info: Monthly land lease of $619 (park); Rent includes trash, water, sewer (see remarks)
- HOA & community: Senior community; Suburban setting; Park name: Greenacres Estates; Manager approval required
Exterior
- Parking: Carport; Has parking; Located in Greenacres Estates mobile home park
- Utilities: Public sewer; District/public water
- Home design: Mobile home (double-wide); Single-story; Mobile home remains on site; 56 x 24 mobile dimensions
- Construction: Year built per assessor; Assessor-provided living area
- Exterior features: No pool; No fencing; Rectangular lot shape
Interior
- Kitchen: Microwave; Range/stove hood; Dishwasher
- Bathrooms: 2 full bathrooms
- Heating & cooling: Central cooling; Central furnace heating
- Interior features: Front entry; Single-level (entry on main level)
- Laundry & utility: Inside laundry
Neighborhood map
What this means for you Summary
Snapshot
- This is a 2-bed/2.0-bath manufactured listed at $104k. Condition is rated good.
Deal economics
- At list price, monthly cash flow is $990 ($12k/yr) — positive.
- The deal already cash-flows at list — no discount required.
- Meets the 1% rule at list price ($2k rent vs $104k).
Location & tenants
- Location reads 61/100 on livability (#552 in CA) — a middle-class / working-renter tenant base. Strengths: housing A+, employment B+; Watch: schools D, health & safety D, crime D-.
- Fruitvale Elementary (urban): math 25% / reading 25% proficiency, ranked #369 of 517 in CA (top 71%) — low school quality limits family demand, transient renter base, plan for 1-2y turnover.
- Market conditions: Rents rising (+1.9%/yr); 203 active listings in the ZIP; 14 comparable units currently listed for rent nearby; rentals leasing fast (median 11d on market — plan ~1-2 weeks tenant-placement turnaround); high-income renter base; 3,244 units permitted in Kern County in 2024 (73 in 5+ unit buildings).
Forward outlook
- Local home prices are declining (-3.0%/yr); year-one equity from $719 of loan paydown is wiped out by about $3k of value loss. Plan a longer hold.
- Kern County population projected at +17% by 2050 — long-run rental-demand tailwind backs the buy-and-hold thesis.
- At projected returns (-3.0% appreciation + 1.9% rent growth), your $29k cash investment doubles in ~3 years — after that, you're playing with house money.
Negotiation context
- Only 10 days on market — expect competitive offers; lowballing is unlikely to land.
- 4 sale attempts with the ask held roughly flat each time — persistent listings suggest the price (not the market) is what's stuck; bring a comps-based counter.
Risks & watch-outs
- Climate carrying-cost: extreme-heat days projected 7→16/yr by 2055 (HVAC capex compounding) — expect insurance premiums to compound above CPI over the hold.
Questions for the listing agent
- Built in 1976 — when were the roof, HVAC, electrical panel, plumbing, and water heater last replaced?
- Is there a deadline driving the sale (1031 exchange, divorce, estate, relocation)? That informs how much negotiation room exists.
- Schools are D-rated, which usually means shorter tenancies and higher turnover. Who's the typical renter profile here, and what's been the actual vacancy rate?
- Crime grade is D in this area — have there been break-ins, vandalism, or insurance claims at this property in the last 3 years? What carrier currently insures it and at what premium?
- What's the average days-on-market for RENTAL listings here right now (not sales)? A rising rental-DOM trend means longer vacancies and softer asking-rent achievability than the comps imply.
- What's the recent tenant-quality profile in this submarket — average credit score on applications, eviction rate, late-payment / NSF rate, and stable-employment percentage? A property-management company in the area should have these aggregated.
- How much new for-sale + rental construction is in the pipeline within 1–3 miles? Heavy new supply typically softens prices + rents 12–24 months out; constrained supply supports both.
Investment metrics
- 1% rule
- 2.08% ✓
- Cap rate
- 17.71%
- Cash-on-cash
- 40.79%
- DSCR
- 2.81
- GRM
- 4.0
CMA / ARV
- ARV (median comp)
- $80,000
- List price
- $104,000
- Delta
- 55.00%
- Verdict
- OVERPRICED
- Comps
- 5 within 1.0 mi
Show comp detail 2 sales within ~0.75 mi
| Address | Dist | Beds/Ba | Sqft | Sold | Price | $/sf | Match |
|---|---|---|---|---|---|---|---|
| 9131 Rosedale Hwy #33 | 0.02mi | 2/2.0 | 1,391 (+4%) | 6mo | $115,000 | $83 | 88 |
| 9131 Rosedale Hwy #54 | 0.04mi | 3/2.0 (+1) | 1,498 (+12%) | 0mo | $145,000 | $97 | 73 |
Match score weights: distance 35% · size 25% · config 20% · recency 20%. Top-matched comps best support the ARV.
Projected returns pro-forma
-3.0% appreciation · 1.86% rent growth · sell at horizon
- IRR
- 36.0%
- Equity multiple
- 2.50×
- Total profit
- $43,771
- Equity at exit
- $15,507
- IRR
- 42.1%
- Equity multiple
- 4.76×
- Total profit
- $109,590
- Equity at exit
- $8,992
Cash invested: $29,120 (down + closing). Projections, not guarantees.
Landlord ↔ Tenant lean methodology
- Overall (STATE)
- 18 Strongly Tenant-Friendly
- State California
- 18 Strongly Tenant-Friendly · D+13
- County
- — inherits STATE
- City
- — inherits STATE
ZIP-level market 93312
- Rents YoY
- 1.9%
- Active inventory
- 203
- Price-to-rent
- 4.0×
Monthly cashflow live
- Estimated rent
- $2,163 high interval (Pro) →
- Mortgage (P&I)
- −$545
- Tax est. 1.5%
- −$130 /mo · $1,560/yr
- Insurance
- −$43
- HOA
- −$0
- Vacancy / Maint / Mgmt
- −$454
- Net cashflow
- $990
Break-even live
UW: 25.0% down · 7.5% · 30yr · 1.5% tax · 5.0% vac · 8.0% maint · 8.0% mgmt
Financing live
Cash to close
- Down payment
- $26,000
- Closing costs
- $3,120
- Reserves months
- —
- Total cash needed
- —
Loan-product check · same deal, 3 products live
Conventional
25% down · 7.5% · 30yr
- Down + closing
- —
- Monthly P&I
- —
- Monthly cashflow
- —
- DSCR
- —
- Eligible?
- —
Personal DTI + credit; lowest rate.
DSCR
20% down · 8.5% · 30yr
- Down + closing
- —
- Monthly P&I
- —
- Monthly cashflow
- —
- DSCR
- —
- Eligible?
- —
No personal income docs; deal must DSCR.
Hard money
10% down · 12.0% · 12mo
- Down + closing
- —
- Monthly P&I
- —
- Monthly cashflow
- —
- DSCR
- —
- Eligible?
- —
Short-term bridge; refi at stabilization.
Rent comps 14 comps
| Address | Beds | Baths | Sqft | Rent | $/sqft | DOM | Units | Dist |
|---|---|---|---|---|---|---|---|---|
| 9109 Chattaroy St Bakersfield, CA | 3.0 | 2.0 | 1375 | $2,200 | $1.60 | 3d | 1 | 0.42mi |
| 8706 Hoodsport Ave Bakersfield, CA | 3.0 | 2.0 | 1417 | $2,250 | $1.59 | 21d | 1 | 0.58mi |
| 9131 Anchor Island Ct Bakersfield, CA | 3.0 | 2.0 | 1360 | $2,499 | $1.84 | 3d | 1 | 0.60mi |
| 3900 Riverlakes Dr Bakersfield, CA | 1.0–3.0 | 1.0–2.0 | 974 | $1,900 | $1.95 | 3d | 6 | 1.06mi |
| 10909 Baron Ave Bakersfield, CA | 3.0 | 2.0 | 1132 | $2,300 | $2.03 | 10d | 1 | 1.19mi |
| 8207 Pebble Cove Ct Apt A Bakersfield, CA | 3.0 | 2.0 | 1100 | $1,875 | $1.70 | 44d | 1 | 1.25mi |
| 8105 Pebble Cove Ct Unit C Bakersfield, CA | 2.0 | 2.0 | 900 | $1,550 | $1.72 | 23d | 1 | 1.28mi |
| 4302 Pebble Creek Dr Unit A Bakersfield, CA | 3.0 | 2.0 | 1100 | $1,875 | $1.70 | 3d | 1 | 1.31mi |
| 4510 Pebble Creek Dr Apt C Bakersfield, CA | 2.0 | 2.0 | 950 | $1,675 | $1.76 | 44d | 1 | 1.45mi |
| 4510 Pebble Creek Dr Apt C Bakersfield, CA | 2.0 | 2.0 | 950 | $1,675 | $1.76 | 3d | 1 | 1.45mi |
| 4510 Pebble Creek Dr Apt C Bakersfield, CA | 2.0 | 2.0 | 1000 | $1,500 | $1.50 | 10d | 1 | 1.45mi |
| 10217 Polo Saddle Dr Bakersfield, CA | 3.0 | 2.0 | 1281 | $2,103 | $1.64 | 14d | 1 | 1.45mi |
| 10302 Polo Saddle Dr Bakersfield, CA | 3.0 | 2.0 | 1492 | $2,395 | $1.61 | 3d | 1 | 1.48mi |
| 3301 Chuckwagon St Bakersfield, CA | 3.0 | 2.5 | 1689 | $2,350 | $1.39 | 3d | 1 | 1.49mi |
Listing history 17 events
-
2026-06-18days on market $104,000 Active 10 DOM
-
2026-06-17days on market $104,000 Active 9 DOM
-
2026-06-16days on market $104,000 Active 8 DOM
-
2026-06-15days on market $104,000 Active 7 DOM
-
2026-06-14days on market $104,000 Active 5 DOM
-
2026-06-13days on market $104,000 Active 4 DOM
-
2026-06-10days on market $104,000 Active 2 DOM
-
2026-06-09pricedays on market $104,000 Active 1 DOM
-
2026-06-08days on market $124,000 Active 25 DOM
-
2026-06-07days on market $124,000 Active 24 DOM
-
2026-06-05days on market $124,000 Active 21 DOM
-
2026-06-03days on market $124,000 Active 20 DOM
-
2026-06-03days on market $124,000 Active 19 DOM
-
2026-06-02remarks 699-char remark
-
2026-06-01days on market $124,000 Active 18 DOM
-
2026-05-31days on market $124,000 Active 17 DOM
-
2026-05-14$124,000 Active 1012-char remark
ⓘ Source: listings_history table (triggers on properties + properties_extension) + one-shot
backfill from property_details.listing_events for pre-trigger history.
Climate risk First Street
- Flood 1/10 Low FEMA zone X (unshaded) · 0% chance over 30 yrs
- Wildfire 4/10 Moderate
- Heat 8/10 Severe 7 d/yr ≥104°F today · 16 d/yr by 30 yrs out
- Wind 1/10 Low
- Air quality 10/10 Extreme 42 unhealthy d/yr today · 45 by 30 yrs out
Nearby sold comps map
Loading sold comps map…
Walkable amenities ~0.75 mi
Loading nearby amenities…
Taxation est. · year 1
- Rental income
- $25,953
- − Mortgage interest
- −$5,826
- − Property taxes
- −$1,560
- − Insurance
- −$520
- − Repairs & maintenance
- −$2,076
- − Management
- −$2,076
- − Depreciation
- −$3,025
- Taxable income
- $10,869
- Est. tax owed @ 24.0%
- −$2,609
- After-tax cash flow
- $9,270/yr
For passive investors: Depreciation is non-cash, so a rental often shows a tax loss while cash-flowing — sheltering income. Rental losses are passive: they offset passive income freely, and up to $25,000/yr can offset ordinary (W-2) income if you actively participate and your MAGI is under $100k (phasing out to $0 by $150k); unused losses carry forward. On sale, claimed depreciation is recaptured at up to 25%, and gains may owe capital-gains tax (a 1031 exchange can defer both). Figures are a year-1 estimate at your 24.0% rate — not tax advice; consult a CPA.
Condition & rehab AI · 30 photos
This manufactured home is in good condition with recent updates, making it a good investment for both resale and rental.
Value-add opportunities
- Both paint the exterior siding — enhances curb appeal and value
- Both replace the ceiling fans — improves comfort and energy efficiency
Renovation cost estimate screening
Value-add ROI direction
- Both paint the exterior siding — enhances curb appeal and value ↑
- Both replace the ceiling fans — improves comfort and energy efficiency ↑
ⓘ Cost ranges are severity-bucket heuristics (US national rule-of-thumb). Get contractor quotes + a written scope before underwriting a rehab budget.
Schools (NCES district)
- District
- Fruitvale Elementary
- NCES district ID
- 0614700
- Math proficiency
- 25% ▼ -29.00%
- Reading proficiency
- 25% ▼ -33.00%
- Median HH income
- $70,941
- Composite
- 24.07/100
- National rank
- #7759
- State rank
- #369 of 517 in CA
Livability — Greenacres
- Score
- 61/100
- State rank
- #552
- US rank
- #18334
Category grades
Schools grade is shown separately in the Schools card above.
Census & demographics
- Census place
- Greenacres, CA
- County
- Kern County · 710,371 people
- City population
- 58,265
- Metro
- Bakersfield, CA
- Population (ZIP)
- 58,384
- Household income
- $114,195
- Rent vs Own
- Severe rent burden
- 964.0
Population outlook (Kern County) Hauer SSP2
- Today (2025)
- 947,286 people
- By 2030
- 978,984 · +3.3%
- By 2040
- 1,045,018 · +10.3%
- By 2050
- 1,105,232 · +16.7%
- By 2075
- 1,229,538 · +29.8%
- By 2100
- 1,238,059 · +30.7%
Race, ethnicity, and origin ACS 2023
- Neighborhood character
- Diverse neighborhood (Simpson 0.61)
- Race & ethnicity
- White 53% Hispanic / Latino 33% Two or more races 21% Asian 6% Black 2% Native American 1%
- Hispanic origin (detail)
- Mexican 26%
- Common ancestry
- Lithuanian 2% Italian 2% Russian 1%
- Foreign-born
- 12% · Canada, China, Vietnam
- Languages at home
- 76% English-only · Spanish 16% Arabic 2% Other Indo-European 2%
Political lean MEDSL · Kern
- 2024 margin
- Strong R (+21.1) · D 38.2% · R 59.3% · Other 2.5%
- 2008→2024 swing
- -3.3pp toward R · 2008: -17.8pp · 2024: -21.1pp
- All cycles
- 2024: R+21.1 2020: R+10.2 2016: R+15.0 2012: R+20.9 2008: R+17.8
Not yet ingested
- Civics
- —
Market trends
- HPI YoY
- ▼ -194.46%
- Current HPI
- 325.3919
- Rent YoY
- ▲ 1.86%
- Metro
- Bakersfield, CA
- State GDP YoY
- ▲ 3.21%
- F500 in state
- 116
Industry mix (Fortune 500 HQ in CA)
| Industry | F500 HQs | Revenue |
|---|---|---|
| Technology | 27 | $1,492B |
|
||
| Financial Services | 3 | $174B |
|
||
| Retail | 3 | $44B |
|
||
| Insurance | 3 | $26B |
|
||
| Media / Entertainment | 2 | $115B |
|
||
| Pharmaceuticals / Biotech | 2 | $62B |
|
||
Price history
-16.1% since first listed5 events — show timeline
- 2026-06-08 Listed $104,000 CRMLS
- 2026-06-08 Listed $104,000 GEMLS
- 2026-06-08 Listing Removed — CRMLS
- 2026-05-20 Listed $124,000 GEMLS
- 2026-05-14 Listed $124,000 CRMLS
Cash-flow waterfall
monthlySold comps — $/sqft
last 12 mo · ≤1 miLoading sold comps…