2141 Alaska St · Savannah, GA
Flood risk 1/10 · Minimal
- FEMA flood zone
- X (unshaded)
- Chance of flooding over 30 yrs
- 0.0%
- Est. flood insurance / yr
- $507 – $1,088
Fire risk 3/10 · Minor
- Est. fire insurance / yr
- $963 – $1,789
Heat risk 10/10 · Severe
- Hot days now (above 107°F)
- 7 days/yr
- Hot days in 30 yrs
- 18 days/yr
Wind risk 9/10 · Severe
- Chance of severe wind over 30 yrs
- 99.0%
Air-quality risk 5/10 · Moderate
- Unhealthy air days now
- 7 days/yr
- Unhealthy air days in 30 yrs
- 8 days/yr
Risk factors via First Street. Map © Google.
Why this score? — see what drove the D+ grade
The composite is a weighted blend of 9 inputs, each scored 0–100. Each bar is that input's sub-score; the figure is the points it added to the 100-point composite (weight × sub-score).
- ARV discount +15.0/15.0
- Cash flow +14.8/30.0
- DSCR +4.5/10.0
- Livability +4.3/5.0
- 1% rule +3.5/10.0
- Rent growth +3.4/5.0
- Condition / age +2.5/5.0
- Schools +2.0/10.0
- Appreciation +0.0/10.0
$285,000
🖨 Deal sheet 📄 Offer letter ✓ Due diligence
Listing remarks MLS
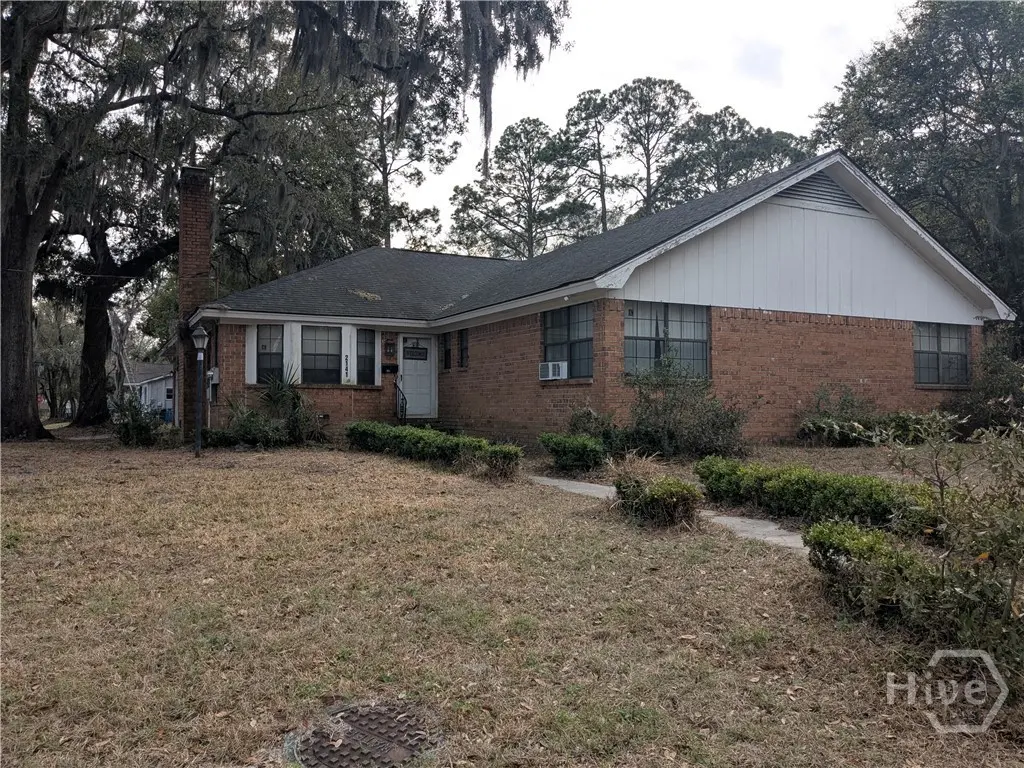
Low maintenance exterior with this handsome brick home in Avondale. Open floor plan and hardwood floors in dining and second living/bonus room. Great drive through garage with 2 roll up doors. Off ground foundation on a corner lot. This home could be a showplace. Sold "as is".
Key facts
- Open floor plan
- Brick home
- Drive through garage
Tags
Neighborhood map
What this means for you Summary
Snapshot
- This is a 3-bed/2.5-bath single-family listed at $285k.
Deal economics
- At list price, monthly cash flow is $76 ($915/yr) — positive.
- The deal already cash-flows at list — no discount required.
- To meet the 1% rule (rent ≥ 1% of price), the offer needs to be $242k (14.9% below list).
- Recommended offer: $242k (14.9% below list) — sets the bar for 1% rule.
- Cap rate 6.6% vs local median 4.0% in Savannah — top-decile yield for the area; either an underpriced asset or a hidden risk that comps aren't pricing in. Stress-test before assuming the spread holds.
Location & tenants
- Location reads 86/100 on livability (#1 in GA, #397 nationally) — a professional / high-income tenant draw. Strengths: crime A+, amenities A+, commute A+; Watch: employment D, schools F.
- Savannah-Chatham County (urban): math 20% / reading 26% proficiency, ranked #134 of 174 in GA (top 77%) — low school quality limits family demand, transient renter base, plan for 1-2y turnover.
- Market conditions: Rents rising (+3.6%/yr); 226 active listings in the ZIP; 22 comparable units currently listed for rent nearby; rentals lingering (median 44d on market — plan ~5-8 weeks vacancy on turnover, expect pricing pressure); 64% of comp listings sitting > 30 days — soft ceiling on asking rent; 2,694 units permitted in Chatham County in 2024 (973 in 5+ unit buildings).
- At $2,424/mo this rent would consume 55% of the median local household income ($53k/yr) (locally 1649% of renters already pay >50% of income on rent) — very limited rent-growth headroom before tenants either downsize or default.
Forward outlook
- Local home prices are declining (-3.0%/yr); year-one equity from $2k of loan paydown is wiped out by about $9k of value loss. Plan a longer hold.
- Chatham County population projected at +33% by 2050 — long-run rental-demand tailwind backs the buy-and-hold thesis.
Negotiation context
- It's been on market 115 days — a 9% lower offer ($259k) is reasonable based on typical stale-listing flexibility.
- 4 sale attempts since 13y ago with the ask held roughly flat each time — persistent listings suggest the price (not the market) is what's stuck; bring a comps-based counter.
Risks & watch-outs
- Climate carrying-cost: severe wind risk, 99% chance of damaging wind over 30y; extreme-heat days projected 7→18/yr by 2055 (HVAC capex compounding) — expect insurance premiums to compound above CPI over the hold.
Questions for the listing agent
- It's been on market 115 days. Have you received any prior offers? Is the seller open to a 15% concession, seller financing, or rate buy-down credit?
- Why hasn't it sold? Are there any deal-killer items the seller is aware of (foundation, flood, title, zoning, code violations)?
- Is there a deadline driving the sale (1031 exchange, divorce, estate, relocation)? That informs how much negotiation room exists.
- Schools are F-rated, which usually means shorter tenancies and higher turnover. Who's the typical renter profile here, and what's been the actual vacancy rate?
- The area grade is low — what's the realistic commute time and amenity access for the typical tenant pool here? Any planned neighborhood developments (good or bad) we should know about?
- What's the average days-on-market for RENTAL listings here right now (not sales)? A rising rental-DOM trend means longer vacancies and softer asking-rent achievability than the comps imply.
- What's the recent tenant-quality profile in this submarket — average credit score on applications, eviction rate, late-payment / NSF rate, and stable-employment percentage? A property-management company in the area should have these aggregated.
- How much new for-sale + rental construction is in the pipeline within 1–3 miles? Heavy new supply typically softens prices + rents 12–24 months out; constrained supply supports both.
Investment metrics
- 1% rule
- 0.85% ✗
- Cap rate
- 6.61%
- Cash-on-cash
- 1.15%
- DSCR
- 1.05
- GRM
- 9.8
CMA / ARV
- ARV (median comp)
- $366,444
- List price
- $285,000
- Delta
- -22.23%
- Verdict
- UNDERPRICED
- Comps
- 20 within 1.0 mi
Show comp detail 12 sales within ~0.75 mi
| Address | Dist | Beds/Ba | Sqft | Sold | Price | $/sf | Match |
|---|---|---|---|---|---|---|---|
| 1895 Downing Ave | 0.69mi | 3/2.5 | 2,200 (-1%) | 9mo | $607,000 | $276 | 59 |
| 518 Gordonston Ave | 0.26mi | 4/3.0 (+1) | 2,458 (+11%) | 5mo | $500,000 | $203 | 59 |
| 512 Gordonston Ave | 0.29mi | 3/2.0 | 2,398 (+8%) | 15mo | $550,000 | $229 | 59 |
| 109 Daisy Ct | 0.67mi | 4/2.5 (+1) | 2,216 (0%) | 7mo | $640,000 | $289 | 58 |
| 2229 Tennessee Ave | 0.38mi | 4/3.0 (+1) | 2,250 (+2%) | 20mo | $285,000 | $127 | 56 |
| 420 Lawton Ave | 0.59mi | 3/2.5 | 2,300 (+4%) | 13mo | $546,000 | $237 | 55 |
| 2011 E 38th St | 0.73mi | 4/3.5 (+1) | 2,306 (+4%) | 7mo | $540,000 | $234 | 44 |
| 103 Daisy Ct | 0.68mi | 3/3.5 | 2,027 (-8%) | 10mo | $575,000 | $284 | 42 |
| 414 Atkinson Ave | 0.51mi | 4/3.5 (+1) | 2,497 (+13%) | 5mo | $628,000 | $252 | 42 |
| 2113 E 37th St | 0.64mi | 3/2.0 | 2,045 (-8%) | 22mo | $385,000 | $188 | 37 |
| 1723 E Duffy St | 0.63mi | 4/2.0 (+1) | 2,430 (+10%) | 20mo | $487,500 | $201 | 31 |
| 104 Daisy Ct | 0.65mi | 4/2.0 (+1) | 1,932 (-13%) | 17mo | $595,000 | $308 | 27 |
Match score weights: distance 35% · size 25% · config 20% · recency 20%. Top-matched comps best support the ARV.
Projected returns pro-forma
-3.0% appreciation · 3.62% rent growth · sell at horizon
- IRR
- -13.8%
- Equity multiple
- 0.50×
- Total profit
- $-39,846
- Equity at exit
- $42,494
- IRR
- -4.1%
- Equity multiple
- 0.72×
- Total profit
- $-22,297
- Equity at exit
- $24,642
Cash invested: $79,800 (down + closing). Projections, not guarantees.
Landlord ↔ Tenant lean methodology
- Overall (STATE)
- 90 Strongly Landlord-Friendly
- State Georgia
- 90 Strongly Landlord-Friendly · R+3
- County
- — inherits STATE
- City
- — inherits STATE
ZIP-level market 31404
- Rents YoY
- 3.6%
- Active inventory
- 226
- Price-to-rent
- 9.8×
Monthly cashflow live
- Estimated rent
- $2,424 high interval (Pro) →
- Mortgage (P&I)
- −$1,495
- Tax from tax record
- −$226 /mo · $2,706/yr
- Insurance
- −$119
- HOA
- −$0
- Vacancy / Maint / Mgmt
- −$509
- Net cashflow
- $76
Break-even live
UW: 25.0% down · 7.5% · 30yr · 1.5% tax · 5.0% vac · 8.0% maint · 8.0% mgmt
Financing live
Cash to close
- Down payment
- $71,250
- Closing costs
- $8,550
- Reserves months
- —
- Total cash needed
- —
Loan-product check · same deal, 3 products live
Conventional
25% down · 7.5% · 30yr
- Down + closing
- —
- Monthly P&I
- —
- Monthly cashflow
- —
- DSCR
- —
- Eligible?
- —
Personal DTI + credit; lowest rate.
DSCR
20% down · 8.5% · 30yr
- Down + closing
- —
- Monthly P&I
- —
- Monthly cashflow
- —
- DSCR
- —
- Eligible?
- —
No personal income docs; deal must DSCR.
Hard money
10% down · 12.0% · 12mo
- Down + closing
- —
- Monthly P&I
- —
- Monthly cashflow
- —
- DSCR
- —
- Eligible?
- —
Short-term bridge; refi at stabilization.
Rent comps 22 comps
| Address | Beds | Baths | Sqft | Rent | $/sqft | DOM | Units | Dist |
|---|---|---|---|---|---|---|---|---|
| 513 Kentucky Ave Savannah, GA | 4.0 | 3.0 | 2828 | $3,500 | $1.24 | 23d | 1 | 0.31mi |
| 404 Gordonston Ave Savannah, GA | 3.0 | 2.0 | 2028 | $2,800 | $1.38 | 13d | 1 | 0.39mi |
| 1804 Georgia Ave Savannah, GA | 3.0 | 2.0 | 1528 | $2,950 | $1.93 | 43d | 1 | 0.42mi |
| 1315 Bonaventure Rd Unit upstair Savannah, GA | 2.0 | 1.0 | 1650 | $1,500 | $0.91 | 13d | 1 | 0.58mi |
| 430 Lawton Ave Savannah, GA | 4.0 | 2.5 | 2000 | $3,400 | $1.70 | 43d | 1 | 0.60mi |
| 2201 E 37th St Savannah, GA | 3.0 | 1.5 | 1424 | $1,800 | $1.26 | 23d | 1 | 0.64mi |
| 1612 Skidaway Rd Savannah, GA | 2.0 | 1.0 | 1453 | $1,800 | $1.24 | 43d | 1 | 0.73mi |
| 2800 Capital St Savannah, GA | 1.0–3.0 | 1.0 | 980 | $1,650 | $1.68 | 43d | 1 | 0.73mi |
| 1611 E Henry St Unit A Savannah, GA | 3.0 | 2.0 | 2226 | $1,850 | $0.83 | 44d | 1 | 0.79mi |
| 2033 E 41st St Savannah, GA | 4.0 | 2.0 | 1448 | $2,800 | $1.93 | 43d | 1 | 0.87mi |
| 2637 Evergreen Ave Savannah, GA | 3.0 | 2.0 | 1642 | $2,000 | $1.22 | 43d | 1 | 1.09mi |
| 2112 Clars Ave Unit A Savannah, GA | 2.0 | 1.0 | 1500 | $1,700 | $1.13 | 43d | 1 | 1.22mi |
| 1436 E 42nd St Savannah, GA | 3.0 | 2.0 | 1447 | $2,290 | $1.58 | 13d | 1 | 1.28mi |
| 2840 Wicklow St Savannah, GA | 1.0–3.0 | 1.0–2.0 | 1071 | $2,869 | $2.68 | 13d | 50 | 1.28mi |
| 1112 E Anderson St Savannah, GA | 4.0 | 2.0 | 1488 | $2,300 | $1.55 | 43d | 1 | 1.35mi |
| 1202 E 37th St Unit A Savannah, GA | 4.0 | 2.0 | 1480 | $2,295 | $1.55 | 13d | 1 | 1.40mi |
| 1014 E Anderson St Savannah, GA | 2.0 | 1.0 | 1642 | $2,200 | $1.34 | 43d | 1 | 1.44mi |
| 1122 E 37th St Unit 1/2 Savannah, GA | 2.0 | 1.0 | 2492 | $1,710 | $0.69 | 43d | 1 | 1.45mi |
| 1302 E Victory Dr Unit 2 Savannah, GA | 3.0 | 1.5 | 1600 | $1,995 | $1.25 | 43d | 1 | 1.47mi |
| 1904 E 51st St Savannah, GA | 4.0 | 2.5 | 1800 | $2,300 | $1.28 | 13d | 1 | 1.47mi |
| 27 Stirling St Savannah, GA | 2.0 | 1.0 | 2000 | $2,500 | $1.25 | 43d | 1 | 1.49mi |
| 3601 Eastgate Dr Savannah, GA | 3.0 | 2.0 | 1400 | $2,500 | $1.79 | 43d | 1 | 1.50mi |
Listing history 23 events
-
2026-06-18days on market $285,000 Active 115 DOM
-
2026-06-17days on market $285,000 Active 114 DOM
-
2026-06-16days on market $285,000 Active 113 DOM
-
2026-06-15days on market $285,000 Active 112 DOM
-
2026-06-14days on market $285,000 Active 110 DOM
-
2026-06-13days on market $285,000 Active 109 DOM
-
2026-06-10days on market $285,000 Active 107 DOM
-
2026-06-09days on market $285,000 Active 106 DOM
-
2026-06-08days on market $285,000 Active 105 DOM
-
2026-06-07days on market $285,000 Active 104 DOM
-
2026-06-05days on market $285,000 Active 101 DOM
-
2026-06-03days on market $285,000 Active 100 DOM
-
2026-06-02days on market $285,000 Active 99 DOM
-
2026-06-01days on market $285,000 Active 98 DOM
-
2026-05-31days on market $285,000 Active 97 DOM
-
2026-05-30days on market $285,000 Active 96 DOM
-
2026-02-23$285,000 Active 287-char remark
Show marketing remark (287 chars)
Low maintenance exterior with this handsome brick home in Avondale. Open floor plan and hardwood floors in dining and second living/bonus room. Great drive through garage with 2 roll up doors. Off ground foundation on a corner lot. This home could be a showplace. Sold "as is".
-
2023-05-23soldstatus $250,000
-
2023-05-22soldstatus $250,000
-
2023-01-07$249,000
-
2023-01-07$249,000
-
2014-03-07historical
-
2013-07-25$165,000
ⓘ Source: listings_history table (triggers on properties + properties_extension) + one-shot
backfill from property_details.listing_events for pre-trigger history.
Tax reassessment forecast GA · Resets to sale price
- Current annual tax
- $2,706 · $226/mo
- Projected year-2 tax
- $2,706 · $226/mo
- Expected delta
- $0/yr ($0/mo · 0.0%)
ⓘ Screening estimate from a state-policy table — verify with the county assessor before closing.
Climate risk First Street
- Flood 1/10 Low FEMA zone X (unshaded) · 0% chance over 30 yrs
- Wildfire 3/10 Moderate
- Heat 10/10 Extreme 7 d/yr ≥107°F today · 18 d/yr by 30 yrs out
- Wind 9/10 Extreme 99% chance of damaging wind over 30 yrs
- Air quality 5/10 Major 7 unhealthy d/yr today · 8 by 30 yrs out
Nearby sold comps map
Loading sold comps map…
Walkable amenities ~0.75 mi
Loading nearby amenities…
Taxation est. · year 1
- Rental income
- $29,090
- − Mortgage interest
- −$15,964
- − Property taxes
- −$2,706
- − Insurance
- −$1,425
- − Repairs & maintenance
- −$2,327
- − Management
- −$2,327
- − Depreciation
- −$8,291
- Taxable loss
- −$3,951
- Est. tax savings @ 24.0%
- +$948
- After-tax cash flow
- $1,863/yr
For passive investors: Depreciation is non-cash, so a rental often shows a tax loss while cash-flowing — sheltering income. Rental losses are passive: they offset passive income freely, and up to $25,000/yr can offset ordinary (W-2) income if you actively participate and your MAGI is under $100k (phasing out to $0 by $150k); unused losses carry forward. On sale, claimed depreciation is recaptured at up to 25%, and gains may owe capital-gains tax (a 1031 exchange can defer both). Figures are a year-1 estimate at your 24.0% rate — not tax advice; consult a CPA.
Schools (NCES district)
- District
- Savannah-Chatham County
- NCES district ID
- 1301020
- Math proficiency
- 20% ▼ -11.00%
- Reading proficiency
- 26% ▼ -5.00%
- Median HH income
- $47,443
- Composite
- 20.14/100
- National rank
- #8639
- State rank
- #134 of 174 in GA
Livability — Savannah
- Score
- 86/100
- State rank
- #1
- US rank
- #397
Category grades
Schools grade is shown separately in the Schools card above.
Census & demographics
- Census place
- Savannah, GA
- County
- Chatham County · 271,602 people
- City population
- 216,564
- Metro
- Savannah, GA
- Population (ZIP)
- 30,062
- Household income
- $53,303
- Rent vs Own
- Severe rent burden
- 1649.0
Population outlook (Chatham County) Hauer SSP2
- Today (2025)
- 332,584 people
- By 2030
- 355,508 · +6.9%
- By 2040
- 400,030 · +20.3%
- By 2050
- 443,019 · +33.2%
- By 2075
- 534,579 · +60.7%
- By 2100
- 583,863 · +75.6%
Race, ethnicity, and origin ACS 2023
- Neighborhood character
- Majority Black (60%)
- Race & ethnicity
- Black 60% White 33% Two or more races 4% Hispanic / Latino 3% Asian 1%
- Common ancestry
- Romanian 2% Lithuanian 1% Slovak 1%
- Foreign-born
- 4% · Canada, Vietnam
- Languages at home
- 93% English-only · Spanish 3% Other Asian/Pacific 1% French/Haitian/Cajun 1%
Political lean MEDSL · Chatham
- 2024 margin
- D (+18.0) · D 58.6% · R 40.6%
- 2008→2024 swing
- +3.6pp toward D · 2008: 14.4pp · 2024: 18.0pp
- All cycles
- 2024: D+18.0 2020: D+18.8 2016: D+14.5 2012: D+12.0 2008: D+14.4
Not yet ingested
- Civics
- —
Market trends
- HPI YoY
- ▼ -187.86%
- Current HPI
- 310.0764
- Rent YoY
- ▲ 3.62%
- Metro
- Savannah, GA
- State GDP YoY
- ▲ 2.66%
- F500 in state
- 28
Industry mix (Fortune 500 HQ in GA)
| Industry | F500 HQs | Revenue |
|---|---|---|
| Paper / Packaging | 2 | $29B |
|
||
| Retail | 1 | $160B |
|
||
| Transportation / Logistics | 1 | $91B |
|
||
| Airlines | 1 | $62B |
|
||
| Consumer Goods | 1 | $47B |
|
||
| Utilities | 1 | $25B |
|
||
Price history
+72.7% since first listed7 events — show timeline
- 2026-02-23 Listed $285,000 Hive MLS
- 2023-05-23 Sold (Public Records) $250,000 Public Records
- 2023-05-22 Sold (MLS) $250,000 Hive MLS
- 2023-01-07 Listed $249,000 Hive MLS
- 2023-01-07 Listed $249,000 Hive MLS
- 2014-03-07 Listing Removed — Hive MLS
- 2013-07-25 Listed $165,000 Hive MLS
Property tax history
+12.1%/yrLatest (2025): $2,706 · -9.8% YoY. Source: county tax records.
Cash-flow waterfall
monthlySold comps — $/sqft
last 12 mo · ≤1 miLoading sold comps…