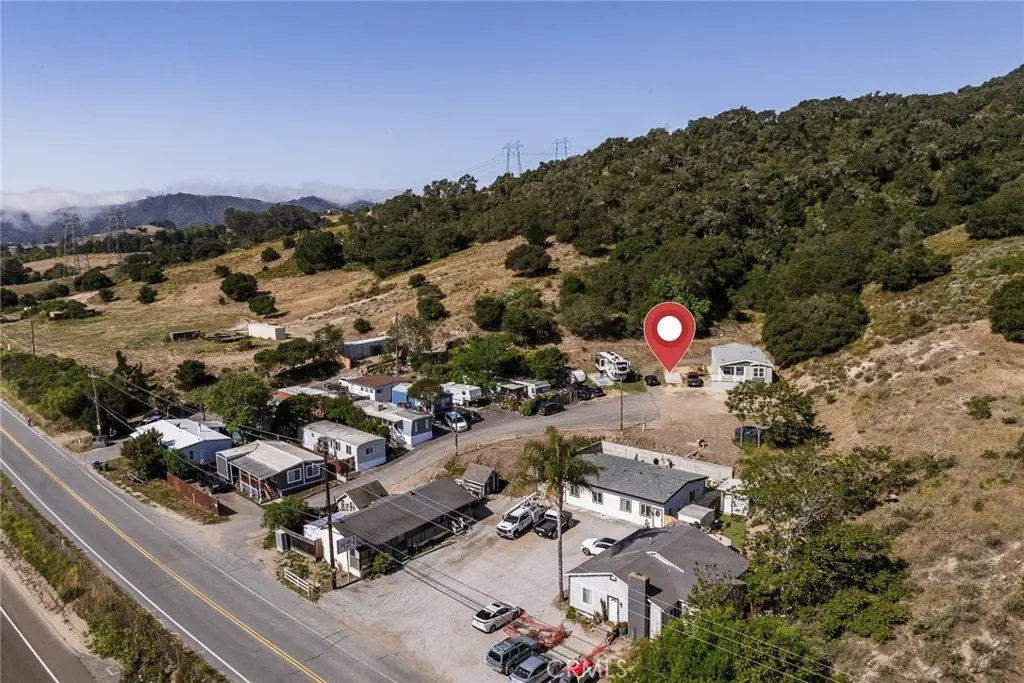
365 David · Avila Beach, CA
Flood risk 1/10 · Minimal
- FEMA flood zone
- X (unshaded)
- Chance of flooding over 30 yrs
- 0.0%
- Est. flood insurance / yr
- $507 – $1,088
Fire risk 4/10 · Minor
- Est. fire insurance / yr
- $659 – $1,223
Heat risk 4/10 · Minor
- Hot days now (above 81°F)
- 7 days/yr
- Hot days in 30 yrs
- 18 days/yr
Wind risk 1/10 · Minimal
- Chance of severe wind over 30 yrs
- —
Air-quality risk 6/10 · Moderate
- Unhealthy air days now
- 11 days/yr
- Unhealthy air days in 30 yrs
- 11 days/yr
Risk factors via First Street. Map © Google.
Why this score? — see what drove the C- grade
The composite is a weighted blend of 9 inputs, each scored 0–100. Each bar is that input's sub-score; the figure is the points it added to the 100-point composite (weight × sub-score).
- ARV discount +15.0/15.0
- Cash flow +11.9/30.0
- Condition / age +5.0/5.0
- Schools +4.6/10.0
- Rent growth +4.2/5.0
- DSCR +3.5/10.0
- 1% rule +3.4/10.0
- Livability +3.1/5.0
- Appreciation +0.0/10.0
$495,000
🖨 Deal sheet 📄 Offer letter ✓ Due diligence
Listing remarks
Welcome to Hillcrest - minutes to San Luis Obispo and Avila Beach! This listing is for a brand new manufactured home encompassing approximately 1,482 square feet with three bedrooms and two baths. The unit will be installed in the next two months, and will be ready for its first owner. The home will come complete with Stainless Steel Whirlpool® Appliances, Including Dishwasher and Built-in Microwave, designer sink and upgraded lighting in the kitchen. The primary bedroom has a spacious closet and en suite bath including walk-in shower, teak shower seat and contemporary black hardware. This is your opportunity to purchase a comfortable home in a premier location! Don't wait.
Key facts
- Upgraded lighting
- Designer sink
- Walk-in shower
Tags
Property features AI
Finance
- Other: Park name: Hillcrest; Pets: contact for details
- Financial info: Land lease: $1,200 monthly (seller provided)
- HOA & community: Land lease in effect
Exterior
- Parking: Located in Hillcrest park
- Utilities: Community septic system; District/public water
- Home design: Manufactured/mobile home; Double wide (28 ft by 60 ft); Single story
- Construction: Mobile home remains on site; Year built: seller-provided
- Exterior features: No pool; Near public transit; Suburban community
Interior
- Kitchen: Energy Star appliances; Microwave; Refrigerator; Gas range; Dishwasher; Energy Star water heater
- Bathrooms: 2 full bathrooms
- Heating & cooling: Forced air heating; Energy Star-rated heating
- Interior features: One-level home; Entry at main level
- Laundry & utility: Inside laundry
Neighborhood map
What this means for you Summary
Snapshot
- This is a 3-bed/2.0-bath manufactured listed at $495k. Condition is rated excellent.
Deal economics
- At list price, monthly cash flow is $-123 ($-1k/yr) — negative.
- To cash-flow at today's rent, offer at most $477k (3.6% below list).
- To meet the 1% rule (rent ≥ 1% of price), the offer needs to be $417k (15.7% below list).
- Recommended offer: $417k (15.7% below list) — sets the bar for 1% rule.
Location & tenants
- Location reads 62/100 on livability (#477 in CA) — a middle-class / working-renter tenant base. Strengths: crime A+, employment A+; Watch: amenities D-, commute F, cost of living F.
- San Luis Coastal Unified (urban): math 50% / reading 58% proficiency, ranked #118 of 517 in CA (top 23%) — acceptable for families but not a draw, mixed tenant base, ~2y average lease.
- Market conditions: Rents rising fast (+7.0%/yr); 51 active listings in the ZIP; 1,104 units permitted in San Luis Obispo County in 2024 (273 in 5+ unit buildings).
- At $4,175/mo this rent would consume 83% of the median local household income ($60k/yr) (locally 3368% of renters already pay >50% of income on rent) — very limited rent-growth headroom before tenants either downsize or default.
Forward outlook
- Local home prices are declining (-3.0%/yr); year-one equity from $3k of loan paydown is wiped out by about $15k of value loss. Plan a longer hold.
- San Luis Obispo County population projected at +20% by 2050 — long-run rental-demand tailwind backs the buy-and-hold thesis.
Negotiation context
- It's been on market 37 days — a 3% lower offer ($480k) is reasonable based on typical stale-listing flexibility.
Questions for the listing agent
- What do current leases actually rent for vs. the listed asking? Can we see a recent rent roll and the last 12 months of T-12 income?
- It's been on market 37 days. Have you received any prior offers? Is the seller open to a 16% concession, seller financing, or rate buy-down credit?
- Is there a deadline driving the sale (1031 exchange, divorce, estate, relocation)? That informs how much negotiation room exists.
- What's the average days-on-market for RENTAL listings here right now (not sales)? A rising rental-DOM trend means longer vacancies and softer asking-rent achievability than the comps imply.
- What's the recent tenant-quality profile in this submarket — average credit score on applications, eviction rate, late-payment / NSF rate, and stable-employment percentage? A property-management company in the area should have these aggregated.
- How much new for-sale + rental construction is in the pipeline within 1–3 miles? Heavy new supply typically softens prices + rents 12–24 months out; constrained supply supports both.
Investment metrics
- 1% rule
- 0.84% ✗
- Cap rate
- 6.00%
- Cash-on-cash
- -1.06%
- DSCR
- 0.95
- GRM
- 9.9
CMA / ARV
- ARV (median comp)
- $711,533
- List price
- $495,000
- Delta
- -30.43%
- Verdict
- UNDERPRICED
- Comps
- 20 within 2.0 mi
Projected returns pro-forma
-3.0% appreciation · 6.97% rent growth · sell at horizon
- IRR
- -13.7%
- Equity multiple
- 0.49×
- Total profit
- $-70,614
- Equity at exit
- $73,806
- IRR
- 0.5%
- Equity multiple
- 1.04×
- Total profit
- $5,949
- Equity at exit
- $42,799
Cash invested: $138,600 (down + closing). Projections, not guarantees.
Landlord ↔ Tenant lean methodology
- Overall (STATE)
- 18 Strongly Tenant-Friendly
- State California
- 18 Strongly Tenant-Friendly · D+13
- County
- — inherits STATE
- City
- — inherits STATE
ZIP-level market 93405
- Rents YoY
- 7.0%
- Active inventory
- 51
- Price-to-rent
- 9.9×
Monthly cashflow live
- Estimated rent
- $4,175 medium interval (Pro) →
- Mortgage (P&I)
- −$2,596
- Tax est. 1.5%
- −$619 /mo · $7,425/yr
- Insurance
- −$206
- HOA
- −$0
- Vacancy / Maint / Mgmt
- −$877
- Net cashflow
- $-123
Break-even live
UW: 25.0% down · 7.5% · 30yr · 1.5% tax · 5.0% vac · 8.0% maint · 8.0% mgmt
Financing live
Cash to close
- Down payment
- $123,750
- Closing costs
- $14,850
- Reserves months
- —
- Total cash needed
- —
Loan-product check · same deal, 3 products live
Conventional
25% down · 7.5% · 30yr
- Down + closing
- —
- Monthly P&I
- —
- Monthly cashflow
- —
- DSCR
- —
- Eligible?
- —
Personal DTI + credit; lowest rate.
DSCR
20% down · 8.5% · 30yr
- Down + closing
- —
- Monthly P&I
- —
- Monthly cashflow
- —
- DSCR
- —
- Eligible?
- —
No personal income docs; deal must DSCR.
Hard money
10% down · 12.0% · 12mo
- Down + closing
- —
- Monthly P&I
- —
- Monthly cashflow
- —
- DSCR
- —
- Eligible?
- —
Short-term bridge; refi at stabilization.
Listing history 16 events
-
2026-06-18days on market $495,000 Active 37 DOM
-
2026-06-17days on market $495,000 Active 36 DOM
-
2026-06-16days on market $495,000 Active 35 DOM
-
2026-06-15days on market $495,000 Active 34 DOM
-
2026-06-14days on market $495,000 Active 32 DOM
-
2026-06-13days on market $495,000 Active 31 DOM
-
2026-06-10days on market $495,000 Active 29 DOM
-
2026-06-09days on market $495,000 Active 28 DOM
-
2026-06-08days on market $495,000 Active 27 DOM
-
2026-06-07days on market $495,000 Active 26 DOM
-
2026-06-03days on market $495,000 Active 22 DOM
-
2026-06-02days on market $495,000 Active 21 DOM
-
2026-06-01days on market $495,000 Active 20 DOM
-
2026-05-31days on market $495,000 Active 19 DOM
-
2026-05-30days on market $495,000 Active 18 DOM
-
2026-05-12$495,000 Active 686-char remark
ⓘ Source: listings_history table (triggers on properties + properties_extension) + one-shot
backfill from property_details.listing_events for pre-trigger history.
Climate risk First Street
- Flood 1/10 Low FEMA zone X (unshaded) · 0% chance over 30 yrs
- Wildfire 4/10 Moderate
- Heat 4/10 Moderate 7 d/yr ≥81°F today · 18 d/yr by 30 yrs out
- Wind 1/10 Low
- Air quality 6/10 Major 11 unhealthy d/yr today · 11 by 30 yrs out
Nearby sold comps map
Loading sold comps map…
Walkable amenities ~0.75 mi
Loading nearby amenities…
Taxation est. · year 1
- Rental income
- $50,100
- − Mortgage interest
- −$27,728
- − Property taxes
- −$7,425
- − Insurance
- −$2,475
- − Repairs & maintenance
- −$4,008
- − Management
- −$4,008
- − Depreciation
- −$14,400
- Taxable loss
- −$9,944
- Est. tax savings @ 24.0%
- +$2,387
- After-tax cash flow
- $915/yr
For passive investors: Depreciation is non-cash, so a rental often shows a tax loss while cash-flowing — sheltering income. Rental losses are passive: they offset passive income freely, and up to $25,000/yr can offset ordinary (W-2) income if you actively participate and your MAGI is under $100k (phasing out to $0 by $150k); unused losses carry forward. On sale, claimed depreciation is recaptured at up to 25%, and gains may owe capital-gains tax (a 1031 exchange can defer both). Figures are a year-1 estimate at your 24.0% rate — not tax advice; consult a CPA.
Condition & rehab AI · 20 photos
This brand new manufactured home is move-in ready with excellent condition and no visible repairs needed. It offers a great opportunity for a comfortable and modern living space in a premier location.
Value-add opportunities
- Both Landscaping and curb appeal improvements — Enhances curb appeal and resale value
- Both Addition of smart home features — Improves convenience and marketability
- Resale Update to kitchen appliances — Modernizes the kitchen and enhances appeal
Renovation cost estimate screening
Value-add ROI direction
- Both Landscaping and curb appeal improvements — Enhances curb appeal and resale value ↑
- Both Addition of smart home features — Improves convenience and marketability ↑
- Resale Update to kitchen appliances — Modernizes the kitchen and enhances appeal ↑
ⓘ Cost ranges are severity-bucket heuristics (US national rule-of-thumb). Get contractor quotes + a written scope before underwriting a rehab budget.
Schools (NCES district)
- District
- San Luis Coastal Unified
- NCES district ID
- 0634800
- Math proficiency
- 50% ▼ -14.00%
- Reading proficiency
- 58% ▼ -12.00%
- Median HH income
- $53,428
- Composite
- 46.4/100
- National rank
- #2455
- State rank
- #118 of 517 in CA
Livability — Avila Beach
- Score
- 62/100
- State rank
- #477
- US rank
- #16167
Category grades
Schools grade is shown separately in the Schools card above.
Census & demographics
- Census place
- Avila Beach, CA
- County
- San Luis Obispo County · 224,651 people
- Metro
- San Luis Obispo-Paso Robles, CA
- Population (ZIP)
- 25,002
- Household income
- $60,399
- Rent vs Own
- Severe rent burden
- 3368.0
Population outlook (San Luis Obispo County) Hauer SSP2
- Today (2025)
- 306,977 people
- By 2030
- 320,378 · +4.4%
- By 2040
- 343,933 · +12.0%
- By 2050
- 366,853 · +19.5%
- By 2075
- 428,329 · +39.5%
- By 2100
- 460,687 · +50.1%
Race, ethnicity, and origin ACS 2023
- Neighborhood character
- Predominantly White (72%)
- Race & ethnicity
- White 72% Hispanic / Latino 15% Two or more races 10% Asian 6% Black 1%
- Hispanic origin (detail)
- Mexican 11%
- Common ancestry
- Italian 4% Lithuanian 2% Portuguese 2%
- Foreign-born
- 6% · Canada, China
- Languages at home
- 84% English-only · Spanish 8% Other Indo-European 2% Chinese 1%
Political lean MEDSL · San Luis Obispo
- 2024 margin
- D (+10.9) · D 53.9% · R 43.1% · Other 3.0%
- 2008→2024 swing
- +5.5pp toward D · 2008: 5.4pp · 2024: 10.9pp
- All cycles
- 2024: D+10.9 2020: D+13.1 2016: D+8.3 2012: D+1.0 2008: D+5.4
Not yet ingested
- Civics
- —
Market trends
- HPI YoY
- ▼ -840.08%
- Current HPI
- 379.5701
- Rent YoY
- ▲ 6.97%
- Metro
- San Luis Obispo-Paso Robles, CA
- State GDP YoY
- ▲ 3.21%
- F500 in state
- 116
Industry mix (Fortune 500 HQ in CA)
| Industry | F500 HQs | Revenue |
|---|---|---|
| Technology | 27 | $1,492B |
|
||
| Financial Services | 3 | $174B |
|
||
| Retail | 3 | $44B |
|
||
| Insurance | 3 | $26B |
|
||
| Media / Entertainment | 2 | $115B |
|
||
| Pharmaceuticals / Biotech | 2 | $62B |
|
||
Price history
1 event — show timeline
- 2026-05-12 Listed $495,000 CRMLS
Cash-flow waterfall
monthlySold comps — $/sqft
last 12 mo · ≤1 miLoading sold comps…