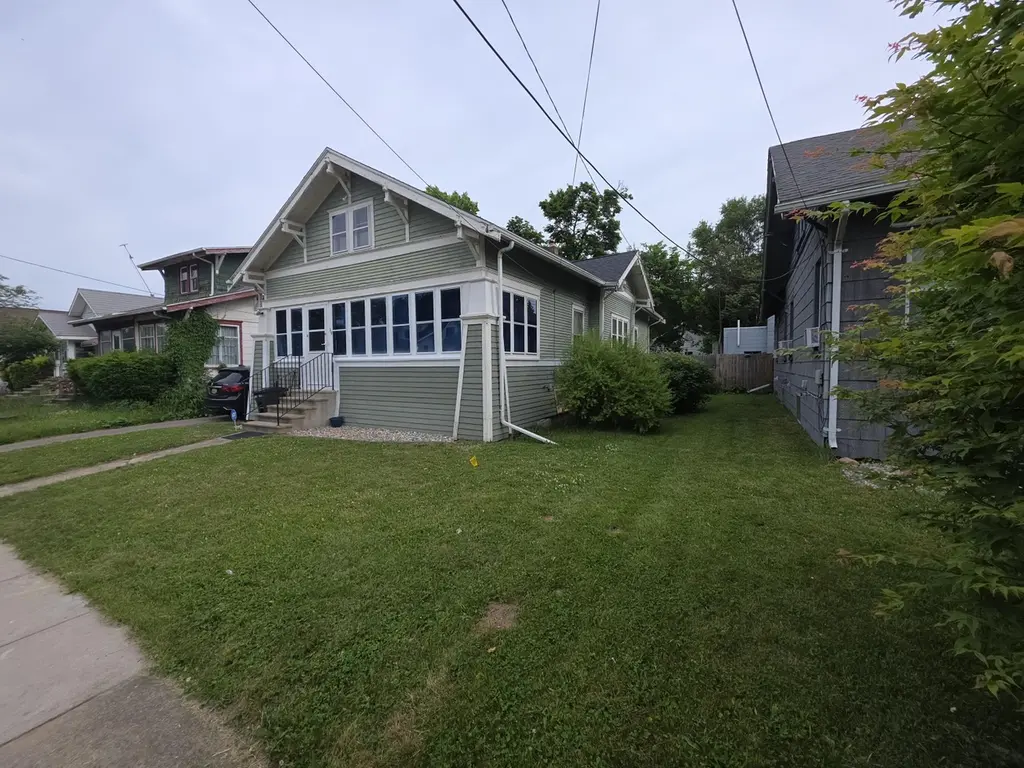
29 Richards Pl · Battle Creek, MI
Flood risk 1/10 · Minimal
- FEMA flood zone
- X (unshaded)
- Chance of flooding over 30 yrs
- 0.0%
- Est. flood insurance / yr
- $473 – $860
Fire risk 1/10 · Minimal
- Est. fire insurance / yr
- $784 – $1,456
Heat risk 3/10 · Minor
- Hot days now (above 97°F)
- 7 days/yr
- Hot days in 30 yrs
- 16 days/yr
Wind risk 2/10 · Minimal
- Chance of severe wind over 30 yrs
- —
Air-quality risk 3/10 · Minor
- Unhealthy air days now
- 2 days/yr
- Unhealthy air days in 30 yrs
- 3 days/yr
Risk factors via First Street. Map © Google.
Why this score? — see what drove the C- grade
The composite is a weighted blend of 9 inputs, each scored 0–100. Each bar is that input's sub-score; the figure is the points it added to the 100-point composite (weight × sub-score).
- Cash flow +18.7/30.0
- ARV discount +10.8/15.0
- DSCR +5.9/10.0
- Rent growth +5.0/5.0
- 1% rule +4.5/10.0
- Livability +3.7/5.0
- Schools +3.0/10.0
- Condition / age +2.5/5.0
- Appreciation +0.0/10.0
$133,500
🖨 Deal sheet (PDF) 📄 Offer letter ✓ Due diligence
Listing remarks MLS
Welcome to 29 Richards Place, a delightful bungalow that seamlessly blends classic 1940s craftsmanship with modern upgrades. Offering 2 bedrooms, 1.5 bathrooms, and approximately 1,036 square feet of functional living space, this home greets you with beautiful original woodwork, timeless hardwood flooring, and exquisite built-in cabinetry separating the bright living and formal dining areas. Unwind on your cozy three-season porch, enjoy a fully fenced backyard perfect for entertaining, and take advantage of the convenience of a detached garage and central air conditioning. Located in a quiet pocket of Battle Creek, this solid, well-maintained home offers the perfect balance of historic soul and everyday modern peace of mind.
Key facts
- Hardwood flooring
- Built-in cabinetry
- Three-season porch
Tags
Property features AI
Exterior
- Parking: Detached 1-car garage
- Utilities: Public water
- Home design: Single-family residence; Residential property; Built in 1940
- Construction: Wood siding; Shingle roof
- Exterior features: 0.12-acre lot
Interior
- Bathrooms: 1 full bathroom; 1 half bathroom
- Heating & cooling: Forced air heating; Has cooling
- Interior features: 5 total rooms; Full basement
Neighborhood map
What this means for you Summary
Snapshot
- This is a 2-bed/1.0-bath single-family listed at $134k.
Deal economics
- At list price, monthly cash flow is $133 ($2k/yr) — positive.
- The deal already cash-flows at list — no discount required.
- To meet the 1% rule (rent ≥ 1% of price), the offer needs to be $127k (4.9% below list).
- Recommended offer: $127k (4.9% below list) — sets the bar for 1% rule.
- Cap rate 7.5% vs local median 5.2% in Battle Creek — top-decile yield for the area; either an underpriced asset or a hidden risk that comps aren't pricing in. Stress-test before assuming the spread holds.
Location & tenants
- Location reads 73/100 on livability (#198 in MI) — a middle-class / working-renter tenant base. Strengths: cost of living A+, housing A+, health & safety A+; Watch: schools C-, amenities C-, crime F.
- Lakeview School District (Calhoun) (urban): math 28% / reading 40% proficiency, ranked #291 of 540 in MI (top 54%) — families likely to look elsewhere, expect single-tenant / working-renter base with shorter leases.
- Market conditions: Rents rising fast (+11.1%/yr); 165 active listings in the ZIP; 1 comparable units currently listed for rent nearby; 132 units permitted in Calhoun County in 2024 (0 in 5+ unit buildings).
Forward outlook
- Local home prices are declining (-3.0%/yr); year-one equity from $923 of loan paydown is wiped out by about $4k of value loss. Plan a longer hold.
- Calhoun County population projected at -16% by 2050 — secular population decline; favor cash flow + early exit over multi-decade hold.
- At projected returns (-3.0% appreciation + 8.0% rent growth), your $37k cash investment doubles in ~10 years — after that, you're playing with house money.
Negotiation context
- Only 12 days on market — expect competitive offers; lowballing is unlikely to land.
- 11 sale attempts since 5y ago with the ask held roughly flat each time — persistent listings suggest the price (not the market) is what's stuck; bring a comps-based counter.
- Current owner paid $110k; 21% above their basis — modest negotiation headroom, anchor on the comps not their cost.
Risks & watch-outs
- Watch-outs: built in 1940 — expect roof / HVAC / electrical / plumbing capex.
Questions for the listing agent
- Built in 1940 — when were the roof, HVAC, electrical panel, plumbing, and water heater last replaced?
- Is there a deadline driving the sale (1031 exchange, divorce, estate, relocation)? That informs how much negotiation room exists.
- Crime grade is F in this area — have there been break-ins, vandalism, or insurance claims at this property in the last 3 years? What carrier currently insures it and at what premium?
- What's the average days-on-market for RENTAL listings here right now (not sales)? A rising rental-DOM trend means longer vacancies and softer asking-rent achievability than the comps imply.
- What's the recent tenant-quality profile in this submarket — average credit score on applications, eviction rate, late-payment / NSF rate, and stable-employment percentage? A property-management company in the area should have these aggregated.
- How much new for-sale + rental construction is in the pipeline within 1–3 miles? Heavy new supply typically softens prices + rents 12–24 months out; constrained supply supports both.
Investment metrics
- 1% rule
- 0.95% ✗
- Cap rate
- 7.49%
- Cash-on-cash
- 4.27%
- DSCR
- 1.19
- GRM
- 8.8
CMA / ARV
- ARV (on-the-fly)
- $144,004
- Comps found
- 12
Show comp detail 12 sales within ~0.75 mi
| Address | Dist | Beds/Ba | Sqft | Sold | Price | $/sf | Match |
|---|---|---|---|---|---|---|---|
| 99 Winter St | 0.40mi | 2/1.0 | 964 (-7%) | 2mo | $130,000 | $135 | 68 |
| 236 Surby Ave | 0.36mi | 3/1.0 (+1) | 1,144 (+10%) | 2mo | $159,900 | $140 | 60 |
| 409 Weeks Ave | 0.51mi | 3/1.0 (+1) | 962 (-7%) | 2mo | $179,900 | $187 | 58 |
| 61 Harris Ave | 0.74mi | 2/1.0 | 1,000 (-4%) | 3mo | $95,000 | $95 | 57 |
| 564 Riverside Dr | 0.71mi | 3/1.0 (+1) | 1,005 (-3%) | 0mo | $180,000 | $179 | 56 |
| 514 Iroquois Ave | 0.55mi | 2/1.0 | 1,168 (+13%) | 2mo | $168,000 | $144 | 51 |
| 21 Foster Dr | 0.45mi | 2/1.5 | 880 (-15%) | 2mo | $122,000 | $139 | 50 |
| 228 Summer St | 0.65mi | 3/2.0 (+1) | 1,090 (+5%) | 3mo | $118,750 | $109 | 50 |
| 243 Winter St | 0.71mi | 3/1.0 (+1) | 960 (-7%) | 0mo | $97,000 | $101 | 49 |
| 57 Seivour Ave | 0.68mi | 2/1.0 | 926 (-11%) | 2mo | $22,000 | $24 | 48 |
| 172 Riverside Dr | 0.63mi | 3/1.0 (+1) | 1,151 (+11%) | 1mo | $156,000 | $136 | 46 |
| 109 Golden Ave | 0.72mi | 3/1.0 (+1) | 936 (-10%) | 4mo | $182,000 | $194 | 42 |
Match score weights: distance 35% · size 25% · config 20% · recency 20%. Top-matched comps best support the ARV.
Projected returns pro-forma
-3.0% appreciation · 8.0% rent growth · sell at horizon
- IRR
- -4.4%
- Equity multiple
- 0.83×
- Total profit
- $-6,466
- Equity at exit
- $19,905
- IRR
- 10.1%
- Equity multiple
- 1.96×
- Total profit
- $35,771
- Equity at exit
- $11,543
Cash invested: $37,380 (down + closing). Projections, not guarantees.
Landlord ↔ Tenant lean methodology
- Overall (STATE)
- 62 Landlord-Friendly
- State Michigan
- 62 Landlord-Friendly · EVEN
- County
- — inherits STATE
- City
- — inherits STATE
ZIP-level market 49015
- Rents YoY
- 11.1%
- Active inventory
- 165
- Price-to-rent
- 8.8×
Monthly cashflow live
- Estimated rent
- $1,270 medium interval (Pro) →
- Mortgage (P&I)
- −$700
- Tax from tax record
- −$115 /mo · $1,377/yr
- Insurance
- −$56
- HOA
- −$0
- Vacancy / Maint / Mgmt
- −$267
- Net cashflow
- $133
Break-even live
Sensitivity live
| Price | -10% $209 | -5% $171 | +0% $133 | +5% $95 | +10% $57 |
|---|---|---|---|---|---|
| Rent | -10% $33 | -5% $83 | +0% $133 | +5% $183 | +10% $233 |
| Rate | -1.0pp $200 | -0.5pp $167 | base $133 | +0.5pp $98 | +1.0pp $63 |
UW: 25.0% down · 7.5% · 30yr · 1.5% tax · 5.0% vac · 8.0% maint · 8.0% mgmt
Financing live
Cash to close
- Down payment
- $33,375
- Closing costs
- $4,005
- Reserves months
- —
- Total cash needed
- —
Loan-product check · same deal, 3 products live
Conventional
25% down · 7.5% · 30yr
- Down + closing
- —
- Monthly P&I
- —
- Monthly cashflow
- —
- DSCR
- —
- Eligible?
- —
Personal DTI + credit; lowest rate.
DSCR
20% down · 8.5% · 30yr
- Down + closing
- —
- Monthly P&I
- —
- Monthly cashflow
- —
- DSCR
- —
- Eligible?
- —
No personal income docs; deal must DSCR.
Hard money
10% down · 12.0% · 12mo
- Down + closing
- —
- Monthly P&I
- —
- Monthly cashflow
- —
- DSCR
- —
- Eligible?
- —
Short-term bridge; refi at stabilization.
Rent comps 1 comps
| Address | Beds | Baths | Sqft | Rent | $/sqft | DOM | Units | Dist |
|---|---|---|---|---|---|---|---|---|
| 226 Taft Ct Battle Creek, MI | 1.0–2.0 | 1.0 | 762 | $985 | $1.29 | 44d | 8 | 1.07mi |
Listing history 9 events
-
2026-06-15days on market $133,500 Active 12 DOM
-
2026-06-14days on market $133,500 Active 10 DOM
-
2026-06-13days on market $133,500 Active 9 DOM
-
2026-06-10days on market $133,500 Active 7 DOM
-
2026-06-09days on market $133,500 Active 6 DOM
-
2026-06-08days on market $133,500 Active 5 DOM
-
2026-06-07days on market $133,500 Active 4 DOM
-
2026-06-05remarks 699-char remark
-
2026-06-05$133,500 Active 1 DOM
ⓘ Source: listings_history table (triggers on properties + properties_extension) + one-shot
backfill from property_details.listing_events for pre-trigger history.
Tax reassessment forecast MI · Partial reset (capped growth)
- Current annual tax
- $1,377 · $115/mo
- Projected year-2 tax
- $1,716 · $143/mo
- Expected delta
- +$340/yr (+$28/mo · 24.7%)
ⓘ Screening estimate from a state-policy table — verify with the county assessor before closing.
Climate risk First Street
- Flood 1/10 Low FEMA zone X (unshaded) · 0% chance over 30 yrs
- Wildfire 1/10 Low
- Heat 3/10 Moderate 7 d/yr ≥97°F today · 16 d/yr by 30 yrs out
- Wind 2/10 Low
- Air quality 3/10 Moderate 2 unhealthy d/yr today · 3 by 30 yrs out
Nearby sold comps map
Loading sold comps map…
Walkable amenities ~0.75 mi
Loading nearby amenities…
Taxation est. · year 1
- Rental income
- $15,241
- − Mortgage interest
- −$7,478
- − Property taxes
- −$1,377
- − Insurance
- −$668
- − Repairs & maintenance
- −$1,219
- − Management
- −$1,219
- − Depreciation
- −$3,884
- Taxable loss
- −$603
- Est. tax savings @ 24.0%
- +$145
- After-tax cash flow
- $1,740/yr
For passive investors: Depreciation is non-cash, so a rental often shows a tax loss while cash-flowing — sheltering income. Rental losses are passive: they offset passive income freely, and up to $25,000/yr can offset ordinary (W-2) income if you actively participate and your MAGI is under $100k (phasing out to $0 by $150k); unused losses carry forward. On sale, claimed depreciation is recaptured at up to 25%, and gains may owe capital-gains tax (a 1031 exchange can defer both). Figures are a year-1 estimate at your 24.0% rate — not tax advice; consult a CPA.
Schools (NCES district)
- District
- Lakeview School District (Calhoun)
- NCES district ID
- 2620850
- Math proficiency
- 28% ▼ -10.00%
- Reading proficiency
- 40% ▼ -6.00%
- Median HH income
- $52,353
- Composite
- 29.7/100
- National rank
- #6455
- State rank
- #291 of 540 in MI
Livability — Battle Creek
- Score
- 73/100
- State rank
- #198
- US rank
- #5031
Category grades
Schools grade is shown separately in the Schools card above.
Census & demographics
- Census place
- Battle Creek, MI
- County
- Calhoun County · 91,590 people
- City population
- 91,590
- Metro
- Battle Creek, MI
- Population (ZIP)
- 27,765
- Household income
- $68,821
- Rent vs Own
- Severe rent burden
- 755.0
Population outlook (Calhoun County) Hauer SSP2
- Today (2025)
- 130,157 people
- By 2030
- 126,691 · -2.7%
- By 2040
- 118,517 · -8.9%
- By 2050
- 109,855 · -15.6%
- By 2075
- 90,486 · -30.5%
- By 2100
- 70,766 · -45.6%
Race, ethnicity, and origin ACS 2023
- Neighborhood character
- Predominantly White (71%)
- Race & ethnicity
- White 71% Two or more races 11% Hispanic / Latino 7% Asian 7% Black 7%
- Hispanic origin (detail)
- Mexican 5%
- Common ancestry
- Iranian 4% Lithuanian 4% Romanian 3%
- Foreign-born
- 10% · Philippines, Canada
- Languages at home
- 86% English-only · Other Asian/Pacific 7% Spanish 4% Other Indo-European 1%
Political lean MEDSL · Calhoun
- 2024 margin
- R (+14.1) · D 42.3% · R 56.4% · Other 1.3%
- 2008→2024 swing
- -23.4pp toward R · 2008: 9.4pp · 2024: -14.1pp
- All cycles
- 2024: R+14.1 2020: R+11.1 2016: R+12.5 2012: D+1.6 2008: D+9.4
Not yet ingested
- Civics
- —
Market trends
- HPI YoY
- ▼ -116.20%
- Current HPI
- 206.7754
- Rent YoY
- ▲ 11.13%
- Metro
- Battle Creek, MI
- State GDP YoY
- ▲ 1.37%
- F500 in state
- 28
Industry mix (Fortune 500 HQ in MI)
| Industry | F500 HQs | Revenue |
|---|---|---|
| Automotive Parts | 3 | $48B |
|
||
| Automotive | 2 | $372B |
|
||
| Chemicals | 1 | $45B |
|
||
| Automotive Retail | 1 | $29B |
|
||
| Healthcare / Medical Devices | 1 | $23B |
|
||
| Automotive Technology | 1 | $20B |
|
||
Price history
+85.4% since first listed27 events — show timeline
- 2026-06-03 Listed $133,500 REALCOMP
- 2026-06-03 Listed $133,500 SW Michigan MLS
- 2026-06-03 Listed $133,500 MiRealSource-MiMLS
- 2025-07-30 Sold (Public Records) $110,000 Public Records
- 2025-07-25 Sold (MLS) $110,000 SW Michigan MLS
- 2025-07-25 Sold (MLS) $110,000 MiRealSource-MiMLS
- 2025-07-25 Sold (MLS) $110,000 REALCOMP
- 2025-07-17 Pending — REALCOMP
- 2025-07-17 Pending — MiRealSource-MiMLS
- 2025-07-17 Pending — SW Michigan MLS
- 2025-07-08 Listed $120,000 REALCOMP
- 2025-07-08 Listed $120,000 MiRealSource-MiMLS
- 2025-07-08 Listed $120,000 SW Michigan MLS
- 2025-07-05 Coming Soon $120,000 MiRealSource-MiMLS
- 2025-07-05 Coming Soon $120,000 SW Michigan MLS
- 2025-07-05 Listed $120,000 REALCOMP
- 2025-07-05 Listed $120,000 MiRealSource-MiMLS
- 2025-07-05 Listing Removed — MiRealSource-MiMLS
- 2025-07-05 Listing Removed — REALCOMP
- 2021-03-02 Sold (Public Records) $75,000 Public Records
- 2021-02-25 Sold (MLS) $75,000 SW Michigan MLS
- 2021-02-25 Sold (MLS) $75,000 REALCOMP
- 2021-01-23 Pending — REALCOMP
- 2021-01-23 Pending — SW Michigan MLS
- 2021-01-21 Listed $72,000 MiRealSource-MiMLS
- 2021-01-21 Listed $72,000 SW Michigan MLS
- 2021-01-21 Listed $72,000 REALCOMP
Property tax history
+2.5%/yrLatest (2025): $1,377 · -26.6% YoY. Source: county tax records.
Cash-flow waterfall
monthlySold comps — $/sqft
last 12 mo · ≤1 miLoading sold comps…