117 Crestwood Dr · Payne Springs, TX
Flood risk No data
- FEMA flood zone
- —
- Chance of flooding over 30 yrs
- —
- Est. flood insurance / yr
- —
Fire risk No data
- Est. fire insurance / yr
- —
Heat risk No data
- Hot days now (above threshold)
- —
- Hot days in 30 yrs
- —
Wind risk No data
- Chance of severe wind over 30 yrs
- —
Air-quality risk No data
- Unhealthy air days now
- —
- Unhealthy air days in 30 yrs
- —
Risk factors via First Street. Map © Google.
Why this score? — see what drove the C+ grade
The composite is a weighted blend of 9 inputs, each scored 0–100. Each bar is that input's sub-score; the figure is the points it added to the 100-point composite (weight × sub-score).
- Cash flow +27.3/30.0
- DSCR +9.5/10.0
- 1% rule +7.5/10.0
- ARV discount +7.5/15.0
- Schools +3.8/10.0
- Condition / age +3.8/5.0
- Livability +3.1/5.0
- Rent growth +1.1/5.0
- Appreciation +0.0/10.0
$115,000
🖨 Deal sheet 📄 Offer letter ✓ Due diligence
Listing remarks
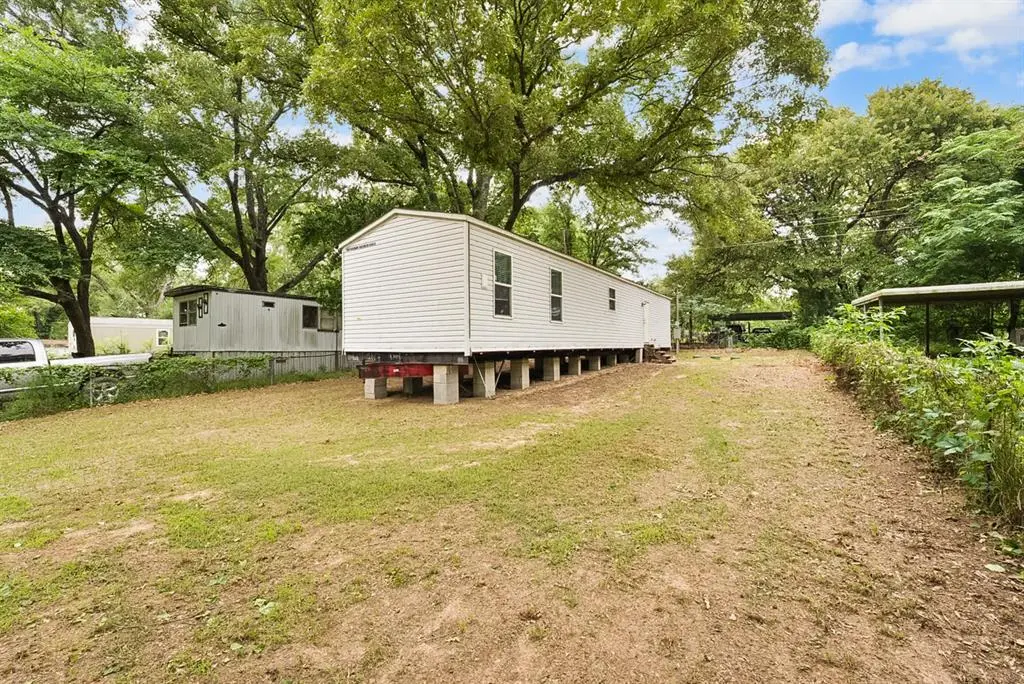
Escape the city and enjoy peaceful living near beautiful Cedar Lake in the quiet Baywood community. This never-lived-in 3-bedroom, 2-bath home is surrounded by mature trees and offers the perfect blend of comfort, privacy, and convenience. Fully furnished and move-in ready, this home includes central heat and air conditioning, refrigerator, stove, all utilities already connected, and a brand-new septic system for added peace of mind. Located just about an hour and a half from Dallas, you can enjoy a serene retreat while still being close to shopping centers, restaurants, and everyday conveniences. Whether you're looking for a full-time residence, weekend getaway, or investment opportunity,
Key facts
- Cedar lake
- Serene retreat
- Baywood community
Tags
Property features AI
Finance
- Other: Parcel number 20850000053A50
- Financial info: Treat as clear loan type; No second mortgage
- HOA & community: Mandatory association with Baywood Estates; Annual HOA fee of $100 (includes management fees)
Exterior
- Parking: Driveway; Gravel parking; Off-street parking
- Utilities: City water; Septic; Electricity connected
- Home design: Residential mobile home; Single-story
- Construction: Built in 2017
- Exterior features: Located on Cedar Creek; Less than 0.5 acre lot; Lot in Baywood Estate subdivision
Interior
- Kitchen: Electric range; Refrigerator
- Bedrooms: Primary bedroom (Level 1) — 12 x 16; Bedroom (Level 1) — 12 x 12; Bedroom (Level 1) — 12 x 16
- Bathrooms: 2 full bathrooms
- Interior features: Open floorplan; One living area; One dining area; 4 total rooms
Neighborhood map
What this means for you Summary
Snapshot
- This is a 3-bed/2.0-bath manufactured listed at $115k. Condition is rated good.
Deal economics
- At list price, monthly cash flow is $332 ($4k/yr) — positive.
- The deal already cash-flows at list — no discount required.
- Meets the 1% rule at list price ($1k rent vs $115k).
- Recommended offer: $112k (3.0% below list) — sets the bar for market timing.
- Cap rate 9.8% vs local median 3.9% in Payne Springs — top-decile yield for the area; either an underpriced asset or a hidden risk that comps aren't pricing in. Stress-test before assuming the spread holds.
Location & tenants
- Location reads 61/100 on livability (#985 in TX) — a middle-class / working-renter tenant base. Strengths: crime A+, cost of living A+, housing A; Watch: amenities F, commute F, employment D-.
- Mabank ISD (town): math 47% / reading 44% proficiency, ranked #273 of 826 in TX (top 33%) — families likely to look elsewhere, expect single-tenant / working-renter base with shorter leases.
- Zoned schools: Lakeview El (math 47% / reading 47%, grade D-, #1,006 of 4,322 statewide, top 25%, 431 students, 74% FRL) — zoned schools average 74% FRL vs 54% district-wide (20 pts higher); higher-poverty schools than district average — tighter screening recommended.
- Market conditions: Rents falling (-5.8%/yr); 694 active listings in the ZIP; 1 comparable units currently listed for rent nearby; 263 units permitted in Henderson County in 2024 (0 in 5+ unit buildings).
Forward outlook
- Local home prices are declining (-3.0%/yr); year-one equity from $795 of loan paydown is wiped out by about $3k of value loss. Plan a longer hold.
Negotiation context
- It's been on market 43 days — a 3% lower offer ($112k) is reasonable based on typical stale-listing flexibility.
- 5 sale attempts since 4y ago with the ask held roughly flat each time — persistent listings suggest the price (not the market) is what's stuck; bring a comps-based counter.
Questions for the listing agent
- It's been on market 43 days. Have you received any prior offers? Is the seller open to a 3% concession, seller financing, or rate buy-down credit?
- What does the HOA fee cover, when was the last increase, and are there any pending special assessments or reserve-fund shortfalls?
- Is there a deadline driving the sale (1031 exchange, divorce, estate, relocation)? That informs how much negotiation room exists.
- Schools are F-rated, which usually means shorter tenancies and higher turnover. Who's the typical renter profile here, and what's been the actual vacancy rate?
- What's the average days-on-market for RENTAL listings here right now (not sales)? A rising rental-DOM trend means longer vacancies and softer asking-rent achievability than the comps imply.
- What's the recent tenant-quality profile in this submarket — average credit score on applications, eviction rate, late-payment / NSF rate, and stable-employment percentage? A property-management company in the area should have these aggregated.
- How much new for-sale + rental construction is in the pipeline within 1–3 miles? Heavy new supply typically softens prices + rents 12–24 months out; constrained supply supports both.
Investment metrics
- 1% rule
- 1.25% ✓
- Cap rate
- 9.76%
- Cash-on-cash
- 12.37%
- DSCR
- 1.55
- GRM
- 6.7
CMA / ARV
- ARV (median comp)
- $54,950
- List price
- $115,000
- Delta
- 109.28%
- Verdict
- OVERPRICED
- Comps
- 2 within 2.0 mi
Projected returns pro-forma
-3.0% appreciation · 0.0% rent growth · sell at horizon
- IRR
- -1.4%
- Equity multiple
- 0.95×
- Total profit
- $-1,675
- Equity at exit
- $17,147
- IRR
- 4.7%
- Equity multiple
- 1.30×
- Total profit
- $9,606
- Equity at exit
- $9,943
Cash invested: $32,200 (down + closing). Projections, not guarantees.
Landlord ↔ Tenant lean methodology
- Overall (STATE)
- 87 Strongly Landlord-Friendly
- State Texas
- 87 Strongly Landlord-Friendly · R+5
- County
- — inherits STATE
- City
- — inherits STATE
ZIP-level market 75156
- Rents YoY
- -5.8%
- Active inventory
- 694
- Price-to-rent
- 6.7×
Monthly cashflow live
- Estimated rent
- $1,436 medium interval (Pro) →
- Mortgage (P&I)
- −$603
- Tax est. 1.5%
- −$144 /mo · $1,725/yr
- Insurance
- −$48
- HOA
- −$8
- Vacancy / Maint / Mgmt
- −$302
- Net cashflow
- $332
Break-even live
UW: 25.0% down · 7.5% · 30yr · 1.5% tax · 5.0% vac · 8.0% maint · 8.0% mgmt
Financing live
Cash to close
- Down payment
- $28,750
- Closing costs
- $3,450
- Reserves months
- —
- Total cash needed
- —
Loan-product check · same deal, 3 products live
Conventional
25% down · 7.5% · 30yr
- Down + closing
- —
- Monthly P&I
- —
- Monthly cashflow
- —
- DSCR
- —
- Eligible?
- —
Personal DTI + credit; lowest rate.
DSCR
20% down · 8.5% · 30yr
- Down + closing
- —
- Monthly P&I
- —
- Monthly cashflow
- —
- DSCR
- —
- Eligible?
- —
No personal income docs; deal must DSCR.
Hard money
10% down · 12.0% · 12mo
- Down + closing
- —
- Monthly P&I
- —
- Monthly cashflow
- —
- DSCR
- —
- Eligible?
- —
Short-term bridge; refi at stabilization.
Rent comps 1 comps
| Address | Beds | Baths | Sqft | Rent | $/sqft | DOM | Units | Dist |
|---|---|---|---|---|---|---|---|---|
| 114 Timber Crst Mabank, TX | 2.0 | 2.0 | 950 | $1,300 | $1.37 | 43d | 1 | 0.06mi |
HOA detail
- Monthly dues
- $8 · $96/yr
Listing history 28 events
-
2026-06-19days on market $115,000 Active 43 DOM
-
2026-06-18days on market $115,000 Active 42 DOM
-
2026-06-17days on market $115,000 Active 41 DOM
-
2026-06-16days on market $115,000 Active 40 DOM
-
2026-06-15days on market $115,000 Active 39 DOM
-
2026-06-14days on market $115,000 Active 37 DOM
-
2026-06-12days on market $115,000 Active 36 DOM
-
2026-06-09days on market $115,000 Active 33 DOM
-
2026-06-08days on market $115,000 Active 32 DOM
-
2026-06-07days on market $115,000 Active 31 DOM
-
2026-06-05days on market $115,000 Active 28 DOM
-
2026-06-03days on market $115,000 Active 27 DOM
-
2026-06-02days on market $115,000 Active 26 DOM
-
2026-06-01days on market $115,000 Active 25 DOM
-
2026-05-31days on market $115,000 Active 24 DOM
-
2026-05-30days on market $115,000 Active 23 DOM
-
2026-05-01$115,000 Active 769-char remark
-
2025-11-23historical
-
2025-10-03price $99,000
-
2025-08-14price $120,000
-
2025-06-17price $125,000
-
2025-05-23$130,000 Active
-
2025-02-16historical
-
2024-09-17status Active
-
2024-08-16$80,000 Active
-
2022-07-29soldstatus Closed
-
2022-06-27status Pending
-
2022-06-22$44,900 Active
ⓘ Source: listings_history table (triggers on properties + properties_extension) + one-shot
backfill from property_details.listing_events for pre-trigger history.
Nearby sold comps map
Loading sold comps map…
Walkable amenities ~0.75 mi
Loading nearby amenities…
Taxation est. · year 1
- Rental income
- $17,236
- − Mortgage interest
- −$6,442
- − Property taxes
- −$1,725
- − Insurance
- −$575
- − Repairs & maintenance
- −$1,379
- − Management
- −$1,379
- − HOA
- −$96
- − Depreciation
- −$3,345
- Taxable income
- $2,295
- Est. tax owed @ 24.0%
- −$551
- After-tax cash flow
- $3,433/yr
For passive investors: Depreciation is non-cash, so a rental often shows a tax loss while cash-flowing — sheltering income. Rental losses are passive: they offset passive income freely, and up to $25,000/yr can offset ordinary (W-2) income if you actively participate and your MAGI is under $100k (phasing out to $0 by $150k); unused losses carry forward. On sale, claimed depreciation is recaptured at up to 25%, and gains may owe capital-gains tax (a 1031 exchange can defer both). Figures are a year-1 estimate at your 24.0% rate — not tax advice; consult a CPA.
Condition & rehab AI · 1 photo
This never-lived-in 3-bedroom, 2-bath home is surrounded by mature trees and offers the perfect blend of comfort, privacy, and convenience. It is fully furnished and move-in ready, with a brand-new septic system for added peace of mind.
Value-add opportunities
- Both Landscaping — Enhances curb appeal and adds value for both resale and rental
- Both Painting — Fresh paint can make the home look more inviting and increase its value
- Both Landscaping — Maintaining the landscaping can improve curb appeal and add value
Renovation cost estimate screening
Value-add ROI direction
- Both Landscaping — Enhances curb appeal and adds value for both resale and rental ↑
- Both Painting — Fresh paint can make the home look more inviting and increase its value ↑
- Both Landscaping — Maintaining the landscaping can improve curb appeal and add value ↑
ⓘ Cost ranges are severity-bucket heuristics (US national rule-of-thumb). Get contractor quotes + a written scope before underwriting a rehab budget.
Schools (NCES district)
- District
- Mabank ISD
- NCES district ID
- 4828680
- Math proficiency
- 47% ▼ -19.00%
- Reading proficiency
- 44% ▼ -11.00%
- Median HH income
- $40,321
- Composite
- 38.15/100
- National rank
- #4267
- State rank
- #273 of 826 in TX
Livability — Payne Springs
- Score
- 61/100
- State rank
- #985
- US rank
- #17539
Category grades
Schools grade is shown separately in the Schools card above.
Census & demographics
- County
- Henderson County · 34,977 people
- Metro
- Athens, TX
- Population (ZIP)
- 16,333
- Household income
- $60,867
- Rent vs Own
- Severe rent burden
- 400.0
Population outlook (Henderson County) Hauer SSP2
- Today (2025)
- 80,471 people
- By 2030
- 80,608 · +0.2%
- By 2040
- 80,087 · -0.5%
- By 2050
- 78,208 · -2.8%
- By 2075
- 72,423 · -10.0%
- By 2100
- 61,012 · -24.2%
Race, ethnicity, and origin ACS 2023
- Neighborhood character
- Predominantly White (85%)
- Race & ethnicity
- White 85% Hispanic / Latino 7% Two or more races 7% Black 1%
- Hispanic origin (detail)
- Mexican 5%
- Common ancestry
- Slovak 3% Serbian 2% European 2%
- Foreign-born
- 4% · Canada, Jamaica
- Languages at home
- 94% English-only · Spanish 4% Other Indo-European 1%
Political lean MEDSL · Henderson
- 2024 margin
- Solid R (+63.5) · D 18.0% · R 81.4%
- 2008→2024 swing
- -18.8pp toward R · 2008: -44.6pp · 2024: -63.5pp
- All cycles
- 2024: R+63.5 2020: R+60.2 2016: R+60.0 2012: R+54.8 2008: R+44.6
Not yet ingested
- Civics
- —
Market trends
- HPI YoY
- ▼ -216.77%
- Current HPI
- 199.8108
- Rent YoY
- ▼ -5.76%
- Metro
- Athens, TX
- State GDP YoY
- ▲ 3.95%
- F500 in state
- 110
Industry mix (Fortune 500 HQ in TX)
| Industry | F500 HQs | Revenue |
|---|---|---|
| Energy | 16 | $1,198B |
|
||
| Technology | 5 | $198B |
|
||
| Engineering / Construction | 4 | $72B |
|
||
| Energy Services | 3 | $60B |
|
||
| Utilities | 3 | $41B |
|
||
| Healthcare | 2 | $330B |
|
||
Price history
+156.1% since first listed12 events — show timeline
- 2026-05-01 Listed $115,000 NTREIS
- 2025-11-23 Listing Removed — NTREIS
- 2025-10-03 Price Changed $99,000 NTREIS
- 2025-08-14 Price Changed $120,000 NTREIS
- 2025-06-17 Price Changed $125,000 NTREIS
- 2025-05-23 Listed $130,000 NTREIS
- 2025-02-16 Listing Removed — NTREIS
- 2024-09-17 Relisted — NTREIS
- 2024-08-16 Listed $80,000 NTREIS
- 2022-07-29 Sold (MLS) — NTREIS
- 2022-06-27 Pending — NTREIS
- 2022-06-22 Listed $44,900 NTREIS
Cash-flow waterfall
monthlySold comps — $/sqft
last 12 mo · ≤1 miLoading sold comps…