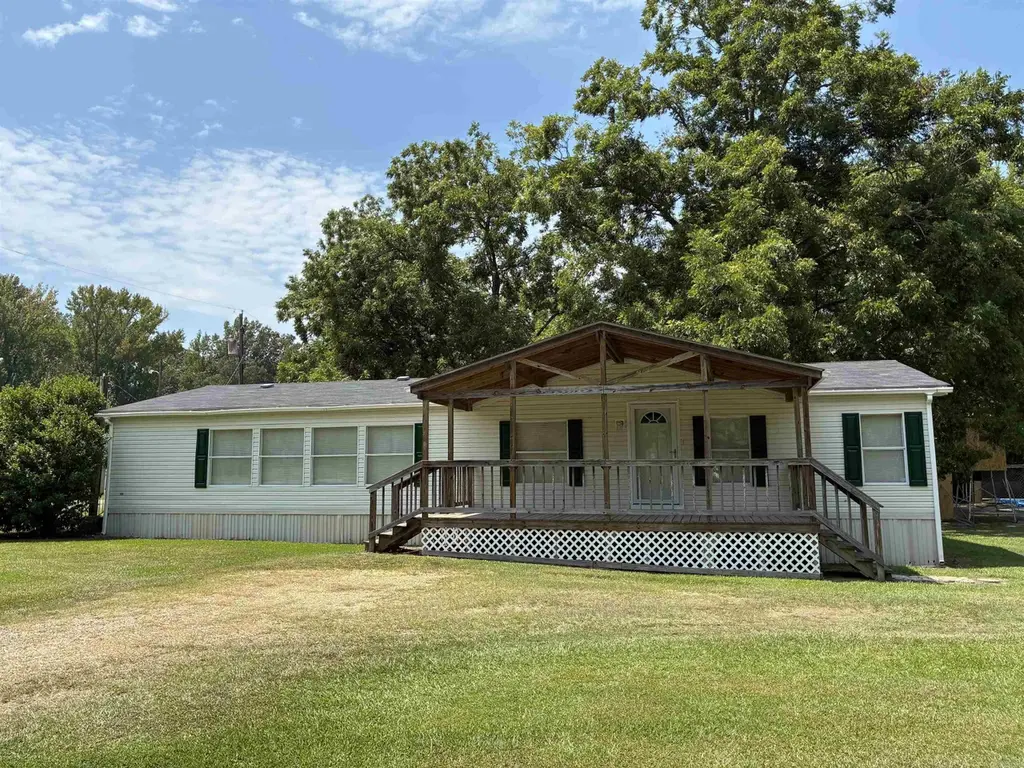
603 N Morgan St · Hamburg, AR
Flood risk 1/10 · Minimal
- FEMA flood zone
- X (unshaded)
- Chance of flooding over 30 yrs
- 0.0%
- Est. flood insurance / yr
- $507 – $1,088
Fire risk 2/10 · Minimal
- Est. fire insurance / yr
- $1,499 – $2,785
Heat risk 6/10 · Moderate
- Hot days now (above 110°F)
- 7 days/yr
- Hot days in 30 yrs
- 20 days/yr
Wind risk 6/10 · Moderate
- Chance of severe wind over 30 yrs
- 53.0%
Air-quality risk 1/10 · Minimal
- Unhealthy air days now
- 0 days/yr
- Unhealthy air days in 30 yrs
- 0 days/yr
Risk factors via First Street. Map © Google.
Why this score? — see what drove the B- grade
The composite is a weighted blend of 9 inputs, each scored 0–100. Each bar is that input's sub-score; the figure is the points it added to the 100-point composite (weight × sub-score).
- Cash flow +30.0/30.0
- DSCR +10.0/10.0
- 1% rule +9.0/10.0
- ARV discount +7.5/15.0
- Livability +3.3/5.0
- Rent growth +2.5/5.0
- Condition / age +2.5/5.0
- Schools +2.1/10.0
- Appreciation +0.8/10.0
$80,000
🖨 Deal sheet 📄 Offer letter ✓ Due diligence
Listing remarks
2005 1,680 sqft mobile home permanently affixed to a 0.38-acre corner lot. Immaculate condition. 3 bedroom / 2 bath, all electric. 2017 updates include paint and flooring throughout and remodeled primary bathroom. Large laundry room with side entrance. Beautiful 10x22 covered front porch. 2025 front storm door. Roof with gutters installed 2021. Original HVAC. Concrete slab patio. Title has been surrendered to the state. Mobile home permanently attached to real property.
Key facts
- Covered front porch
- Large laundry room
- Concrete slab patio
Tags
Property features AI
Finance
- Other: Approximately 0.38 acre (120 x 135); Approximate living area 1,680; Lot source: Tax records / Survey
- Financial info: Financing available: FHA, Conventional, Cash, Rural Development
Exterior
- Utilities: Public sewer; Public water; Municipal electric service (Entergy); Insulated windows; Insulated doors
- Home design: Double-wide mobile home on a permanent foundation; Corner, level lot; Inside city limits
- Construction: Metal/vinyl siding; Composition roof; Crawl space foundation; Built on permanent foundation (double wide)
- Exterior features: Porch; Under pinning; Paved road access
Interior
- Kitchen: Free-standing stove; Microwave; Electric range; Dishwasher
- Bedrooms: Den/Family Room (other room); Laundry (other room)
- Flooring: Vinyl; Luxury vinyl
- Bathrooms: 2 full bathrooms
- Heating & cooling: Central electric heat; Central electric cooling
- Interior features: Electric water heater; Window treatments; Walk-in closets; Ceiling fans; Walk-in shower
- Laundry & utility: Laundry room
Neighborhood map
What this means for you Summary
Snapshot
- This is a 3-bed/2.0-bath manufactured listed at $80k.
Deal economics
- At list price, monthly cash flow is $406 ($5k/yr) — positive.
- The deal already cash-flows at list — no discount required.
- Meets the 1% rule at list price ($1k rent vs $80k).
- Recommended offer: $79k (1.5% below list) — sets the bar for market timing.
Location & tenants
- Location reads 66/100 on livability (#125 in AR) — a middle-class / working-renter tenant base. Strengths: cost of living A+, health & safety A+, housing B+; Watch: amenities F, commute F, employment F.
- Hamburg School District (town): math 24% / reading 26% proficiency, ranked #187 of 238 in AR (top 79%) — low school quality limits family demand, transient renter base, plan for 1-2y turnover; 67% free/reduced lunch — lower-income household profile, screen leases tightly.
- Zoned schools: Hamburg High School (math 16% / reading 31%, grade F, #208 of 292 statewide, top 71%, 498 students, 56% FRL).
- Market conditions: 27 active listings in the ZIP.
Forward outlook
- Local home prices are declining (-3.0%/yr); year-one equity from $553 of loan paydown is wiped out by about $2k of value loss. Plan a longer hold.
- Ashley County population projected at -30% by 2050 — secular population decline; favor cash flow + early exit over multi-decade hold.
- At projected returns (-3.0% appreciation + 3.0% rent growth), your $22k cash investment doubles in ~6 years — after that, you're playing with house money.
Negotiation context
- It's been on market 23 days — a 2% lower offer ($79k) is reasonable based on typical stale-listing flexibility.
- 2 sale attempts with the ask held roughly flat each time — persistent listings suggest the price (not the market) is what's stuck; bring a comps-based counter.
Risks & watch-outs
- Climate carrying-cost: major wind risk, 53% chance of damaging wind over 30y; extreme-heat days projected 7→20/yr by 2055 (HVAC capex compounding) — expect insurance premiums to compound above CPI over the hold.
Questions for the listing agent
- Is there a deadline driving the sale (1031 exchange, divorce, estate, relocation)? That informs how much negotiation room exists.
- Schools are F-rated, which usually means shorter tenancies and higher turnover. Who's the typical renter profile here, and what's been the actual vacancy rate?
- What's the average days-on-market for RENTAL listings here right now (not sales)? A rising rental-DOM trend means longer vacancies and softer asking-rent achievability than the comps imply.
- What's the recent tenant-quality profile in this submarket — average credit score on applications, eviction rate, late-payment / NSF rate, and stable-employment percentage? A property-management company in the area should have these aggregated.
- How much new for-sale + rental construction is in the pipeline within 1–3 miles? Heavy new supply typically softens prices + rents 12–24 months out; constrained supply supports both.
Investment metrics
- 1% rule
- 1.40% ✓
- Cap rate
- 12.38%
- Cash-on-cash
- 21.74%
- DSCR
- 1.97
- GRM
- 5.9
CMA / ARV
No comps found within radius.
Projected returns pro-forma
-3.0% appreciation · 3.0% rent growth · sell at horizon
- IRR
- 14.3%
- Equity multiple
- 1.57×
- Total profit
- $12,856
- Equity at exit
- $11,928
- IRR
- 23.1%
- Equity multiple
- 2.98×
- Total profit
- $44,367
- Equity at exit
- $6,917
Cash invested: $22,400 (down + closing). Projections, not guarantees.
Landlord ↔ Tenant lean methodology
- Overall (STATE)
- 92 Strongly Landlord-Friendly
- State Arkansas
- 92 Strongly Landlord-Friendly · R+14
- County
- — inherits STATE
- City
- — inherits STATE
ZIP-level market 71646
- Home prices YoY
- -4.9%
- Active inventory
- 27
- Price-to-rent
- 5.9×
Monthly cashflow live
- Estimated rent
- $1,123 medium interval (Pro) →
- Mortgage (P&I)
- −$420
- Tax from tax record
- −$28 /mo · $339/yr
- Insurance
- −$33
- HOA
- −$0
- Vacancy / Maint / Mgmt
- −$236
- Net cashflow
- $406
Break-even live
UW: 25.0% down · 7.5% · 30yr · 1.5% tax · 5.0% vac · 8.0% maint · 8.0% mgmt
Financing live
Cash to close
- Down payment
- $20,000
- Closing costs
- $2,400
- Reserves months
- —
- Total cash needed
- —
Loan-product check · same deal, 3 products live
Conventional
25% down · 7.5% · 30yr
- Down + closing
- —
- Monthly P&I
- —
- Monthly cashflow
- —
- DSCR
- —
- Eligible?
- —
Personal DTI + credit; lowest rate.
DSCR
20% down · 8.5% · 30yr
- Down + closing
- —
- Monthly P&I
- —
- Monthly cashflow
- —
- DSCR
- —
- Eligible?
- —
No personal income docs; deal must DSCR.
Hard money
10% down · 12.0% · 12mo
- Down + closing
- —
- Monthly P&I
- —
- Monthly cashflow
- —
- DSCR
- —
- Eligible?
- —
Short-term bridge; refi at stabilization.
Listing history 22 events
-
2026-06-19days on market $80,000 Active 23 DOM
-
2026-06-18days on market $80,000 Active 22 DOM
-
2026-06-17days on market $80,000 Active 21 DOM
-
2026-06-16days on market $80,000 Active 20 DOM
-
2026-06-15days on market $80,000 Active 19 DOM
-
2026-06-14days on market $80,000 Active 17 DOM
-
2026-06-12days on market $80,000 Active 16 DOM
-
2026-06-09days on market $80,000 Active 13 DOM
-
2026-06-08days on market $80,000 Active 12 DOM
-
2026-06-07days on market $80,000 Active 11 DOM
-
2026-06-07days on market $80,000 Active 10 DOM
-
2026-06-04statusdays on market $80,000 Active 7 DOM
-
2026-06-02days on market $80,000 New Listing 6 DOM
-
2026-06-01days on market $80,000 New Listing 5 DOM
-
2026-05-31days on market $80,000 New Listing 4 DOM
-
2026-05-31days on market $80,000 New Listing 3 DOM
-
2026-05-27$80,000 New Listing
-
2026-02-19historical
-
2025-10-20price $98,000
-
2025-08-27$108,000 New Listing
-
2025-08-12soldstatus $160,000
-
2017-04-12soldstatus $18,500
ⓘ Source: listings_history table (triggers on properties + properties_extension) + one-shot
backfill from property_details.listing_events for pre-trigger history.
Tax reassessment forecast AR · Resets to sale price
- Current annual tax
- $339 · $28/mo
- Projected year-2 tax
- $512 · $43/mo
- Expected delta
- +$173/yr (+$14/mo · 51.2%)
ⓘ Screening estimate from a state-policy table — verify with the county assessor before closing.
Climate risk First Street
- Flood 1/10 Low FEMA zone X (unshaded) · 0% chance over 30 yrs
- Wildfire 2/10 Low
- Heat 6/10 Major 7 d/yr ≥110°F today · 20 d/yr by 30 yrs out
- Wind 6/10 Major 53% chance of damaging wind over 30 yrs
- Air quality 1/10 Low 0 unhealthy d/yr today · 0 by 30 yrs out
Nearby sold comps map
Loading sold comps map…
Walkable amenities ~0.75 mi
Loading nearby amenities…
Taxation est. · year 1
- Rental income
- $13,472
- − Mortgage interest
- −$4,481
- − Property taxes
- −$339
- − Insurance
- −$400
- − Repairs & maintenance
- −$1,078
- − Management
- −$1,078
- − Depreciation
- −$2,327
- Taxable income
- $3,769
- Est. tax owed @ 24.0%
- −$905
- After-tax cash flow
- $3,965/yr
For passive investors: Depreciation is non-cash, so a rental often shows a tax loss while cash-flowing — sheltering income. Rental losses are passive: they offset passive income freely, and up to $25,000/yr can offset ordinary (W-2) income if you actively participate and your MAGI is under $100k (phasing out to $0 by $150k); unused losses carry forward. On sale, claimed depreciation is recaptured at up to 25%, and gains may owe capital-gains tax (a 1031 exchange can defer both). Figures are a year-1 estimate at your 24.0% rate — not tax advice; consult a CPA.
Schools (NCES district)
- District
- Hamburg School District
- NCES district ID
- 0500042
- Math proficiency
- 24% ▼ -20.00%
- Reading proficiency
- 26% ▼ -11.00%
- Median HH income
- $35,669
- Composite
- 20.69/100
- National rank
- #8527
- State rank
- #187 of 238 in AR
Livability — Hamburg
- Score
- 66/100
- State rank
- #125
- US rank
- #11736
Category grades
Schools grade is shown separately in the Schools card above.
Census & demographics
- Census place
- Hamburg, AR
- Population (ZIP)
- 6,683
Population outlook (Ashley County) Hauer SSP2
- Today (2025)
- 18,757 people
- By 2030
- 17,541 · -6.5%
- By 2040
- 15,243 · -18.7%
- By 2050
- 13,136 · -30.0%
- By 2075
- 8,901 · -52.5%
- By 2100
- 5,626 · -70.0%
Race, ethnicity, and origin ACS 2023
- Neighborhood character
- Predominantly White (74%)
- Race & ethnicity
- White 74% Hispanic / Latino 13% Black 12% Two or more races 9%
- Hispanic origin (detail)
- Mexican 10%
- Common ancestry
- Slovak 1%
- Foreign-born
- 5% · Canada
- Languages at home
- 92% English-only · Spanish 8%
Political lean MEDSL · Ashley
- 2024 margin
- Solid R (+48.0) · D 25.2% · R 73.2% · Other 1.6%
- 2008→2024 swing
- -19.9pp toward R · 2008: -28.1pp · 2024: -48.0pp
- All cycles
- 2024: R+48.0 2020: R+43.2 2016: R+36.5 2012: R+25.4 2008: R+28.1
Not yet ingested
- Civics
- —
Market trends
- HPI YoY
- ▼ -8.32%
- Current HPI
- 161.0476
- Rent YoY
- —
- Metro
- —
- State GDP YoY
- ▲ 3.80%
- F500 in state
- 10
Industry mix (Fortune 500 HQ in AR)
| Industry | F500 HQs | Revenue |
|---|---|---|
| Retail | 1 | $681B |
|
||
| Food / Agriculture | 1 | $53B |
|
||
| Retail / Energy | 1 | $22B |
|
||
| Transportation / Logistics | 1 | $12B |
|
||
| Energy | 1 | $4B |
|
||
Price history
+332.4% since first listed6 events — show timeline
- 2026-05-27 Listed $80,000 CARMLS
- 2026-02-19 Listing Removed — CARMLS
- 2025-10-20 Price Changed $98,000 CARMLS
- 2025-08-27 Listed $108,000 CARMLS
- 2025-08-12 Sold (Public Records) $160,000 Public Records
- 2017-04-12 Sold (Public Records) $18,500 Public Records
Property tax history
+4.5%/yrLatest (2025): $339 · +8.3% YoY. Source: county tax records.
Cash-flow waterfall
monthlySold comps — $/sqft
last 12 mo · ≤1 miLoading sold comps…