 🏗️ New Construction
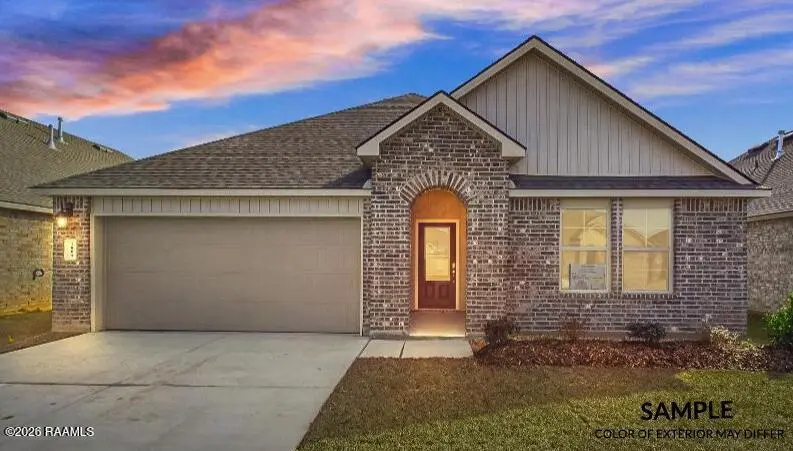
1513 Colonel Rdg · Cade, LA
Flood risk No data
- FEMA flood zone
- —
- Chance of flooding over 30 yrs
- —
- Est. flood insurance / yr
- —
Fire risk No data
- Est. fire insurance / yr
- —
Heat risk No data
- Hot days now (above threshold)
- —
- Hot days in 30 yrs
- —
Wind risk No data
- Chance of severe wind over 30 yrs
- —
Air-quality risk No data
- Unhealthy air days now
- —
- Unhealthy air days in 30 yrs
- —
Risk factors via First Street. Map © Google.
Why this score? — see what drove the B grade
The composite is a weighted blend of 9 inputs, each scored 0–100. Each bar is that input's sub-score; the figure is the points it added to the 100-point composite (weight × sub-score).
- Cash flow +30.0/30.0
- 1% rule +10.0/10.0
- DSCR +10.0/10.0
- ARV discount +7.5/15.0
- Condition / age +4.8/5.0
- Schools +3.2/10.0
- Livability +2.7/5.0
- Rent growth +2.5/5.0
- Appreciation +0.0/10.0
$247,500
🖨 Deal sheet 📄 Offer letter ✓ Due diligence
Listing remarks
Discover the epitome of Louisiana living with DR Horton, where innovation, elegance, and unparalleled value converge. As America's premier homebuilder, DR Horton offers exceptional homeownership opportunities across various captivating neighborhoods. Each home reflects their commitment to quality, designed to exceed expectations. Benefits include a minimum of $5000 towards closing costs and highly competitive interest rates, making your dream home more attainable. Experience the future of home living with cutting-edge smart home technology. Each residence features intuitive devices like Ring doorbells, smart garage controls, advanced thermostats, and robust security systems, all managed eff
Key facts
- 6,098 sq ft lot
- 2 garage spots
Neighborhood map
What this means for you Summary
Snapshot
- This is a 4-bed/2.0-bath single-family listed at $248k. Condition is rated excellent.
Deal economics
- At list price, monthly cash flow is $1k ($17k/yr) — positive.
- The deal already cash-flows at list — no discount required.
- Meets the 1% rule at list price ($4k rent vs $248k).
- Cap rate 13.0% vs local median 5.3% in Cade — top-decile yield for the area; either an underpriced asset or a hidden risk that comps aren't pricing in. Stress-test before assuming the spread holds.
Location & tenants
- Location reads 53/100 on livability (#389 in LA) — a working-class tenant base; expect higher turnover. Strengths: cost of living A+, crime A, employment B; Watch: amenities F, commute F, housing F.
- Iberia Parish (other): math 32% / reading 43% proficiency, ranked #27 of 98 in LA (top 28%) — families likely to look elsewhere, expect single-tenant / working-renter base with shorter leases; 66% free/reduced lunch — lower-income household profile, screen leases tightly.
- Zoned schools: Coteau Elementary School (math 47% / reading 52%, grade D, #129 of 646 statewide, top 21%, 272 students, 71% FRL); Anderson Middle School (math 19% / reading 38%, grade F, #119 of 218 statewide, top 57%, 399 students, 86% FRL); Westgate High School (math 17% / reading 37%, grade F, #136 of 265 statewide, top 55%, 993 students, 77% FRL).
- Market conditions: 237 active listings in the ZIP; 1 comparable units currently listed for rent nearby; 94 units permitted in Iberia Parish in 2024 (0 in 5+ unit buildings).
Forward outlook
- Local home prices are declining (-3.0%/yr); year-one equity from $2k of loan paydown is wiped out by about $7k of value loss. Plan a longer hold.
- Iberia County population projected to shrink 4% by 2050 — rents likely to lag national; underwrite the cash flow, not the appreciation.
- At projected returns (-3.0% appreciation + 3.0% rent growth), your $70k cash investment doubles in ~6 years — after that, you're playing with house money.
Negotiation context
- Only 0 days on market — expect competitive offers; lowballing is unlikely to land.
Questions for the listing agent
- What does the HOA fee cover, when was the last increase, and are there any pending special assessments or reserve-fund shortfalls?
- Is there a deadline driving the sale (1031 exchange, divorce, estate, relocation)? That informs how much negotiation room exists.
- Schools are F-rated, which usually means shorter tenancies and higher turnover. Who's the typical renter profile here, and what's been the actual vacancy rate?
- What's the average days-on-market for RENTAL listings here right now (not sales)? A rising rental-DOM trend means longer vacancies and softer asking-rent achievability than the comps imply.
- What's the recent tenant-quality profile in this submarket — average credit score on applications, eviction rate, late-payment / NSF rate, and stable-employment percentage? A property-management company in the area should have these aggregated.
- How much new for-sale + rental construction is in the pipeline within 1–3 miles? Heavy new supply typically softens prices + rents 12–24 months out; constrained supply supports both.
Investment metrics
- 1% rule
- 1.60% ✓
- Cap rate
- 13.03%
- Cash-on-cash
- 24.05%
- DSCR
- 2.07
- GRM
- 5.2
CMA / ARV
- ARV (on-the-fly)
- $249,696
- Comps found
- 12
Show comp detail 12 sales within ~0.75 mi
| Address | Dist | Beds/Ba | Sqft | Sold | Price | $/sf | Match |
|---|---|---|---|---|---|---|---|
| 1513 Colonel Rdg | 0.00mi | 4/2.0 | 1,836 (0%) | 1mo | $247,500 | $135 | 99 |
| 1518 Colonel Rdg | 0.01mi | 4/2.0 | 1,836 (0%) | 2mo | $250,000 | $136 | 98 |
| 1514 Colonel Rdg | 0.03mi | 4/2.0 | 1,874 (+2%) | 1mo | $250,500 | $134 | 94 |
| 1601 Colonel Rdg | 0.05mi | 4/2.0 | 1,874 (+2%) | 2mo | $255,500 | $136 | 92 |
| 1519 Colonel Rdg | 0.01mi | 4/2.0 | 1,706 (-7%) | 3mo | $240,500 | $141 | 85 |
| 1517 Colonel Rdg | 0.02mi | 3/2.0 (-1) | 1,616 (-12%) | 2mo | $234,500 | $145 | 73 |
| 1609 Penrose Rdg | 0.01mi | 3/2.0 (-1) | 1,613 (-12%) | 4mo | $237,000 | $147 | 71 |
| 1515 Colonel Rdg | 0.01mi | 5/3.0 (+1) | 2,087 (+14%) | 1mo | $267,500 | $128 | 67 |
| 1600 Ashland Rdg | 0.12mi | 3/2.0 (-1) | 1,613 (-12%) | 5mo | $234,500 | $145 | 65 |
| 1605 Penrose Rdg | 0.03mi | 5/3.0 (+1) | 2,087 (+14%) | 3mo | $272,500 | $131 | 65 |
| 1518 Ashland Rdg | 0.08mi | 5/3.0 (+1) | 2,087 (+14%) | 3mo | $267,500 | $128 | 62 |
| 1507 Highland Dr | 0.10mi | 5/3.0 (+1) | 2,087 (+14%) | 4mo | $267,500 | $128 | 60 |
Match score weights: distance 35% · size 25% · config 20% · recency 20%. Top-matched comps best support the ARV.
Projected returns pro-forma
-3.0% appreciation · 3.0% rent growth · sell at horizon
- IRR
- 17.3%
- Equity multiple
- 1.70×
- Total profit
- $48,876
- Equity at exit
- $37,230
- IRR
- 25.8%
- Equity multiple
- 3.26×
- Total profit
- $157,819
- Equity at exit
- $21,589
Cash invested: $69,915 (down + closing). Projections, not guarantees.
Landlord ↔ Tenant lean methodology
- Overall (STATE)
- 90 Strongly Landlord-Friendly
- State Louisiana
- 90 Strongly Landlord-Friendly · R+12
- County
- — inherits STATE
- City
- — inherits STATE
ZIP-level market 70560
- Home prices YoY
- -29.8%
- Active inventory
- 237
- Price-to-rent
- 5.2×
Monthly cashflow live
- Estimated rent
- $4,000 medium interval (Pro) →
- Mortgage (P&I)
- −$1,309
- Tax est. 1.5%
- −$312 /mo · $3,745/yr
- Insurance
- −$104
- HOA
- −$33
- Vacancy / Maint / Mgmt
- −$840
- Net cashflow
- $1,401
Break-even live
UW: 25.0% down · 7.5% · 30yr · 1.5% tax · 5.0% vac · 8.0% maint · 8.0% mgmt
Financing live
Cash to close
- Down payment
- $62,424
- Closing costs
- $7,491
- Reserves months
- —
- Total cash needed
- —
Loan-product check · same deal, 3 products live
Conventional
25% down · 7.5% · 30yr
- Down + closing
- —
- Monthly P&I
- —
- Monthly cashflow
- —
- DSCR
- —
- Eligible?
- —
Personal DTI + credit; lowest rate.
DSCR
20% down · 8.5% · 30yr
- Down + closing
- —
- Monthly P&I
- —
- Monthly cashflow
- —
- DSCR
- —
- Eligible?
- —
No personal income docs; deal must DSCR.
Hard money
10% down · 12.0% · 12mo
- Down + closing
- —
- Monthly P&I
- —
- Monthly cashflow
- —
- DSCR
- —
- Eligible?
- —
Short-term bridge; refi at stabilization.
Rent comps 1 comps
| Address | Beds | Baths | Sqft | Rent | $/sqft | DOM | Units | Dist |
|---|---|---|---|---|---|---|---|---|
| 1802 Saddle Back Rdg New Iberia, LA | 4.0 | 2.0 | 1874 | $4,000 | $2.13 | 21d | 1 | 0.11mi |
HOA detail
- Monthly dues
- $33 · $396/yr
- Likely covers
- security
Listing history 1 events
-
2026-03-02$247,500
ⓘ Source: listings_history table (triggers on properties + properties_extension) + one-shot
backfill from property_details.listing_events for pre-trigger history.
Nearby sold comps map
Loading sold comps map…
Walkable amenities ~0.75 mi
Loading nearby amenities…
Taxation est. · year 1
- Rental income
- $48,000
- − Mortgage interest
- −$13,987
- − Property taxes
- −$3,745
- − Insurance
- −$1,248
- − Repairs & maintenance
- −$3,840
- − Management
- −$3,840
- − HOA
- −$396
- − Depreciation
- −$7,264
- Taxable income
- $13,679
- Est. tax owed @ 24.0%
- −$3,283
- After-tax cash flow
- $13,534/yr
For passive investors: Depreciation is non-cash, so a rental often shows a tax loss while cash-flowing — sheltering income. Rental losses are passive: they offset passive income freely, and up to $25,000/yr can offset ordinary (W-2) income if you actively participate and your MAGI is under $100k (phasing out to $0 by $150k); unused losses carry forward. On sale, claimed depreciation is recaptured at up to 25%, and gains may owe capital-gains tax (a 1031 exchange can defer both). Figures are a year-1 estimate at your 24.0% rate — not tax advice; consult a CPA.
Condition & rehab AI · 13 photos
This home is in excellent condition with no visible repairs needed, making it a move-in-ready property with high resale and rental potential.
Value-add opportunities
- Resale Paint freshening — Fresh paint enhances curb appeal and interior aesthetics.
- Both Landscaping enhancement — Improved landscaping can increase both resale and rental value.
- Both Smart home integration — Smart home features can attract tech-savvy buyers and renters, enhancing both resale and rental appeal.
Renovation cost estimate screening
Value-add ROI direction
- Resale Paint freshening — Fresh paint enhances curb appeal and interior aesthetics. ↑
- Both Landscaping enhancement — Improved landscaping can increase both resale and rental value. ↑
- Both Smart home integration — Smart home features can attract tech-savvy buyers and renters, enhancing both resale and rental appeal. ↑
ⓘ Cost ranges are severity-bucket heuristics (US national rule-of-thumb). Get contractor quotes + a written scope before underwriting a rehab budget.
Schools (NCES district)
- District
- Iberia Parish
- NCES district ID
- 2200720
- Math proficiency
- 32% ▼ -43.00%
- Reading proficiency
- 43% ▼ -35.00%
- Median HH income
- $43,289
- Composite
- 31.74/100
- National rank
- #5904
- State rank
- #27 of 98 in LA
Livability — Cade
- Score
- 53/100
- State rank
- #389
- US rank
- #24247
Category grades
Schools grade is shown separately in the Schools card above.
Census & demographics
- Population (ZIP)
- 37,589
Population outlook (Iberia County) Hauer SSP2
- Today (2025)
- 74,632 people
- By 2030
- 74,368 · -0.4%
- By 2040
- 73,223 · -1.9%
- By 2050
- 71,728 · -3.9%
- By 2075
- 69,028 · -7.5%
- By 2100
- 65,018 · -12.9%
Race, ethnicity, and origin ACS 2023
- Neighborhood character
- Diverse neighborhood (Simpson 0.61)
- Race & ethnicity
- White 52% Black 35% Two or more races 8% Hispanic / Latino 6% Asian 2%
- Hispanic origin (detail)
- Mexican 2%
- Common ancestry
- Lithuanian 11% Italian 1% Serbian 1%
- Foreign-born
- 3% · Canada
- Languages at home
- 93% English-only · French/Haitian/Cajun 3% Spanish 2% Other Asian/Pacific 1%
Political lean MEDSL · Iberia
- 2024 margin
- Solid R (+34.1) · D 32.4% · R 66.5% · Other 1.1%
- 2008→2024 swing
- -11.1pp toward R · 2008: -23.0pp · 2024: -34.1pp
- All cycles
- 2024: R+34.1 2020: R+31.2 2016: R+31.4 2012: R+26.2 2008: R+23.0
Not yet ingested
- Civics
- —
Market trends
- HPI YoY
- ▼ -65.82%
- Current HPI
- 154.9018
- Rent YoY
- —
- Metro
- —
- State GDP YoY
- ▲ 3.29%
- F500 in state
- 10
Industry mix (Fortune 500 HQ in LA)
| Industry | F500 HQs | Revenue |
|---|---|---|
| Telecommunications | 2 | $23B |
|
||
| Utilities | 1 | $12B |
|
||
| Wholesale / Distribution | 1 | $5B |
|
||
| Advertising | 1 | $2B |
|
||
Price history
1 event — show timeline
- 2026-03-02 Listed $247,500 AcadianaMLS
Cash-flow waterfall
monthlySold comps — $/sqft
last 12 mo · ≤1 miLoading sold comps…