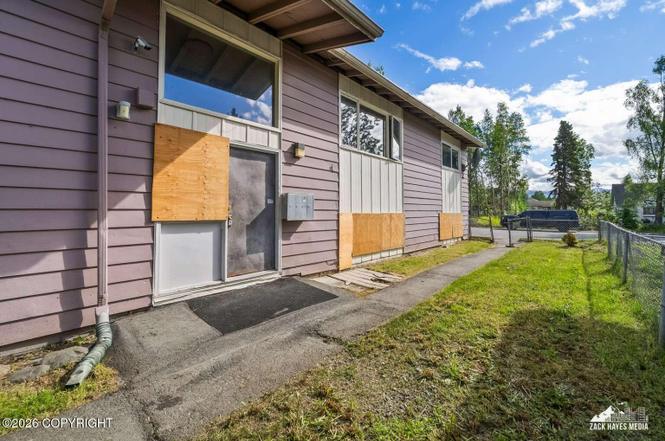
 Fourplex
526 N Hoyt St · Anchorage, AK
Flood risk 1/10 · Minimal
- FEMA flood zone
- X (unshaded)
- Chance of flooding over 30 yrs
- 0.0%
- Est. flood insurance / yr
- $473 – $860
Fire risk No data
- Est. fire insurance / yr
- —
Heat risk No data
- Hot days now (above threshold)
- —
- Hot days in 30 yrs
- —
Wind risk No data
- Chance of severe wind over 30 yrs
- —
Air-quality risk 1/10 · Minimal
- Unhealthy air days now
- —
- Unhealthy air days in 30 yrs
- —
Risk factors via First Street. Map © Google.
Why this score? — see what drove the B+ grade
The composite is a weighted blend of 9 inputs, each scored 0–100. Each bar is that input's sub-score; the figure is the points it added to the 100-point composite (weight × sub-score).
- Cash flow +30.0/30.0
- ARV discount +15.0/15.0
- DSCR +10.0/10.0
- 1% rule +9.4/10.0
- Livability +3.9/5.0
- Rent growth +3.7/5.0
- Schools +3.7/10.0
- Condition / age +2.5/5.0
- Appreciation +0.0/10.0
$419,000
🖨 Deal sheet 📄 Offer letter ✓ Due diligence
Multi-family units
County records classify this as Multi-Family (5+ Unit). Listing-text estimate: 4 units. estimate disagrees with records
5+ unit building — per-unit beds/baths from public records are typically unavailable; the breakdown below (if shown) is an estimate from the listing text.
Listing remarks
Investor opportunity with strong upside potential! This 4-plex features four spacious 2-bedroom, 1-bath units of approximately 960 square feet each. Recent updates include a main sewer line replacement in 2019 and two brand-new gas water heaters. The property offers shared laundry facilities, additional storage space, and abundant off-street parking. One unit is currently in mid-renovation, providing an opportunity for the next owner to complete the project and add value. With additional upside available throughout the property, a little TLC will go a long way on this income-producing multifamily investment.
Key facts
- Gas water heaters
- Off-street parking
- 6,250 sq ft lot
Tags
Property features AI
Exterior
- Parking: Nine open parking spaces
- Utilities: Public sewer
- Home design: Multi-Family property; Built in 1969; Poured concrete foundation
- Construction: Year built 1969
- Exterior features: Lot approximately 0.14 acres (6,250 sq ft)
Interior
- Bedrooms: Eight bedrooms total
- Bathrooms: Four full bathrooms
- Interior features: Multi-family layout
Neighborhood map
What this means for you Summary
Snapshot
- This is a 4 × 2-bed/1.0-bath units multifamily listed at $419k.
Deal economics
- At list price, monthly cash flow is $2k ($23k/yr) — positive. Per door: $484/mo.
- The deal already cash-flows at list — no discount required.
- Meets the 1% rule at list price ($6k rent vs $419k).
- Cap rate 11.8% vs local median 3.8% in Anchorage — top-decile yield for the area; either an underpriced asset or a hidden risk that comps aren't pricing in. Stress-test before assuming the spread holds.
Location & tenants
- Location reads 78/100 on livability (#6 in AK, #2,553 nationally) — a middle-class / working-renter tenant base. Strengths: amenities A+, commute A+, employment A+; Watch: crime F, cost of living F.
- Anchorage School District (urban): math 37% / reading 43% proficiency, ranked #6 of 21 in AK (top 29%) — families likely to look elsewhere, expect single-tenant / working-renter base with shorter leases.
- Zoned schools: Mountain View Elementary (math 8% / reading 12%, grade F, #153 of 156 statewide, top 100%, 290 students, 100% FRL); Clark Middle School (math 7% / reading 22%, grade F, #35 of 36 statewide, top 97%, 835 students, 100% FRL) — zoned schools average 100% FRL vs 38% district-wide (62 pts higher); higher-poverty schools than district average — tighter screening recommended.
- Zoned-school proficiency averages 12% at this address vs 40% district-wide (-28 pts) — the specific schools serving this property underperform the Anchorage School District average; the district grade overstates school quality for this exact location.
- Market conditions: Rents rising fast (+4.9%/yr); 147 active listings in the ZIP; solid renter incomes; 306 units permitted in Anchorage Municipality in 2024 (90 in 5+ unit buildings).
- At $6,038/mo this rent would consume 91% of the median local household income ($79k/yr) (locally 1248% of renters already pay >50% of income on rent) — very limited rent-growth headroom before tenants either downsize or default.
Forward outlook
- Local home prices are declining (-3.0%/yr); year-one equity from $3k of loan paydown is wiped out by about $13k of value loss. Plan a longer hold.
- Anchorage County population projected at +12% by 2050 — modest demand growth; plan on rents tracking national, not racing it.
- At projected returns (-3.0% appreciation + 4.9% rent growth), your $117k cash investment doubles in ~6 years — after that, you're playing with house money.
Negotiation context
- Only 1 days on market — expect competitive offers; lowballing is unlikely to land.
- 6 sale attempts since 22y ago with the ask held roughly flat each time — persistent listings suggest the price (not the market) is what's stuck; bring a comps-based counter.
Questions for the listing agent
- Can we see the unit-by-unit rent roll, current vacancy, and any below-market leases? What's the average tenancy length?
- What capital expenditures (roof, boiler, parking lot, exteriors) have been made in the last 5 years, and what's planned in the next 2?
- Built in 1969 — when were the roof, HVAC, electrical panel, plumbing, and water heater last replaced?
- Is there a deadline driving the sale (1031 exchange, divorce, estate, relocation)? That informs how much negotiation room exists.
- Schools are B-rated — typically a magnet for longer-tenancy family renters. What's the average tenant stay here, and is there a school-zone premium baked into asking?
- Crime grade is F in this area — have there been break-ins, vandalism, or insurance claims at this property in the last 3 years? What carrier currently insures it and at what premium?
- What's the average days-on-market for RENTAL listings here right now (not sales)? A rising rental-DOM trend means longer vacancies and softer asking-rent achievability than the comps imply.
- What's the recent tenant-quality profile in this submarket — average credit score on applications, eviction rate, late-payment / NSF rate, and stable-employment percentage? A property-management company in the area should have these aggregated.
- How much new apartment / multifamily construction is in the pipeline within 1–3 miles? Heavy new supply (>2% of stock underway) typically softens rents 12–24 months out; light construction supports rent growth.
Investment metrics
- 1% rule
- 1.44% ✓
- Cap rate
- 11.84%
- Cash-on-cash
- 19.81%
- DSCR
- 1.88
- GRM
- 5.8
CMA / ARV
- ARV (on-the-fly)
- $550,264
- Comps found
- 12
Show comp detail 12 sales within ~0.75 mi
| Address | Dist | Beds/Ba | Sqft | Sold | Price | $/sf | Match |
|---|---|---|---|---|---|---|---|
| 633 N Flower St | 0.16mi | 8/4.0 | 3,780 (-2%) | 8mo | $180,000 | $48 | 83 |
| 544 N Park St | 0.06mi | 9/4.0 (+1) | 3,932 (+2%) | 9mo | $540,000 | $137 | 81 |
| 808 N Flower St | 0.25mi | 9/4.0 (+1) | 3,840 (-0%) | 5mo | $540,000 | $141 | 79 |
| 4502 McPhee Ave | 0.26mi | 9/4.0 (+1) | 3,792 (-2%) | 3mo | $549,900 | $145 | 78 |
| 4406 Parsons Ave | 0.12mi | 8/4.0 | 4,056 (+5%) | 9mo | $520,000 | $128 | 78 |
| 627 N Flower St | 0.16mi | 8/6.0 | 3,780 (-2%) | 8mo | $180,000 | $48 | 75 |
| 601 Irwin St | 0.28mi | 9/4.0 (+1) | 3,780 (-2%) | 6mo | $577,700 | $153 | 74 |
| 617 N Flower St | 0.16mi | 8/4.0 | 3,456 (-10%) | 2mo | $620,000 | $179 | 74 |
| 740 N Bragaw St | 0.29mi | 9/4.0 (+1) | 3,560 (-8%) | 6mo | $474,000 | $133 | 64 |
| 605 Mumford St | 0.40mi | 8/4.0 | 3,500 (-9%) | 3mo | $539,900 | $154 | 64 |
| 825 N Bliss St | 0.29mi | 8/4.0 | 3,560 (-8%) | 14mo | $510,000 | $143 | 62 |
| 314 Flower St | 0.59mi | 8/4.0 | 3,360 (-13%) | 12mo | $615,000 | $183 | 41 |
Match score weights: distance 35% · size 25% · config 20% · recency 20%. Top-matched comps best support the ARV.
Projected returns pro-forma
-3.0% appreciation · 4.88% rent growth · sell at horizon
- IRR
- 14.0%
- Equity multiple
- 1.57×
- Total profit
- $67,157
- Equity at exit
- $62,474
- IRR
- 24.2%
- Equity multiple
- 3.28×
- Total profit
- $267,161
- Equity at exit
- $36,227
Cash invested: $117,320 (down + closing). Projections, not guarantees.
Landlord ↔ Tenant lean methodology
- Overall (STATE)
- 80 Strongly Landlord-Friendly
- State Alaska
- 80 Strongly Landlord-Friendly · R+8
- County
- — inherits STATE
- City
- — inherits STATE
ZIP-level market 99508
- Rents YoY
- 4.9%
- Active inventory
- 147
- Price-to-rent
- 23.1×
Monthly cashflow live
- Estimated rent
- $6,038 high interval (Pro) →
- Mortgage (P&I)
- −$2,197
- Tax from tax record
- −$461 /mo · $5,534/yr
- Insurance
- −$175
- HOA
- −$0
- Vacancy / Maint / Mgmt
- −$1,268
- Net cashflow
- $1,937
Break-even live
4-unit breakdown (identical units grouped — click to expand)
| Units | Beds | Baths | Est. rent |
|---|---|---|---|
| 4× units | 2 | 1 | $6,036 |
| #1 | 2 | 1 | $1,509 |
| #2 | 2 | 1 | $1,509 |
| #3 | 2 | 1 | $1,509 |
| #4 | 2 | 1 | $1,509 |
| Total (4 units) | $6,038 | ||
UW: 25.0% down · 7.5% · 30yr · 1.5% tax · 5.0% vac · 8.0% maint · 8.0% mgmt
Financing live
Cash to close
- Down payment
- $104,750
- Closing costs
- $12,570
- Reserves months
- —
- Total cash needed
- —
Loan-product check · same deal, 3 products live
Conventional
25% down · 7.5% · 30yr
- Down + closing
- —
- Monthly P&I
- —
- Monthly cashflow
- —
- DSCR
- —
- Eligible?
- —
Personal DTI + credit; lowest rate.
DSCR
20% down · 8.5% · 30yr
- Down + closing
- —
- Monthly P&I
- —
- Monthly cashflow
- —
- DSCR
- —
- Eligible?
- —
No personal income docs; deal must DSCR.
Hard money
10% down · 12.0% · 12mo
- Down + closing
- —
- Monthly P&I
- —
- Monthly cashflow
- —
- DSCR
- —
- Eligible?
- —
Short-term bridge; refi at stabilization.
Listing history 2 events
-
2026-06-19remarks 615-char remark
-
2026-06-19$419,000 Active 1 DOM
ⓘ Source: listings_history table (triggers on properties + properties_extension) + one-shot
backfill from property_details.listing_events for pre-trigger history.
Tax reassessment forecast AK · Partial reset (capped growth)
- Current annual tax
- $5,534 · $461/mo
- Projected year-2 tax
- $5,534 · $461/mo
- Expected delta
- $0/yr ($0/mo · 0.0%)
ⓘ Screening estimate from a state-policy table — verify with the county assessor before closing.
Climate risk First Street
- Flood 1/10 Low FEMA zone X (unshaded) · 0% chance over 30 yrs
- Air quality 1/10 Low
Nearby sold comps map
Loading sold comps map…
Walkable amenities ~0.75 mi
Loading nearby amenities…
Taxation est. · year 1
- Rental income
- $72,456
- − Mortgage interest
- −$23,471
- − Property taxes
- −$5,534
- − Insurance
- −$2,095
- − Repairs & maintenance
- −$5,796
- − Management
- −$5,796
- − Depreciation
- −$12,189
- Taxable income
- $17,574
- Est. tax owed @ 24.0%
- −$4,218
- After-tax cash flow
- $19,026/yr
For passive investors: Depreciation is non-cash, so a rental often shows a tax loss while cash-flowing — sheltering income. Rental losses are passive: they offset passive income freely, and up to $25,000/yr can offset ordinary (W-2) income if you actively participate and your MAGI is under $100k (phasing out to $0 by $150k); unused losses carry forward. On sale, claimed depreciation is recaptured at up to 25%, and gains may owe capital-gains tax (a 1031 exchange can defer both). Figures are a year-1 estimate at your 24.0% rate — not tax advice; consult a CPA.
Schools (NCES district)
- District
- Anchorage School District
- NCES district ID
- 0200180
- Math proficiency
- 37% ▼ -2.00%
- Reading proficiency
- 43% ▲ 1.00%
- Median HH income
- $76,447
- Composite
- 37.0/100
- National rank
- #4523
- State rank
- #6 of 21 in AK
Livability — Anchorage
- Score
- 78/100
- State rank
- #6
- US rank
- #2553
Category grades
Schools grade is shown separately in the Schools card above.
Census & demographics
- Census place
- Anchorage, AK
- County
- Anchorage Borough · 246,594 people
- City population
- 218,117
- Metro
- Anchorage, AK
- Population (ZIP)
- 36,458
- Household income
- $79,314
- Rent vs Own
- Severe rent burden
- 1248.0
Population outlook (Anchorage County) Hauer SSP2
- Today (2025)
- 314,993 people
- By 2030
- 321,771 · +2.2%
- By 2040
- 335,493 · +6.5%
- By 2050
- 352,799 · +12.0%
- By 2075
- 414,771 · +31.7%
- By 2100
- 474,485 · +50.6%
Race, ethnicity, and origin ACS 2023
- Neighborhood character
- Highly diverse neighborhood (Simpson 0.82)
- Race & ethnicity
- White 38% Two or more races 14% Asian 13% Hispanic / Latino 13% Native American 10% Pacific Islander 8% Black 6%
- Hispanic origin (detail)
- Mexican 4% Puerto Rican 2% Cuban 1% Dominican 3%
- Common ancestry
- Portuguese 3% Iranian 2% Romanian 2%
- Foreign-born
- 15% · Canada, Jamaica, South Korea
- Languages at home
- 72% English-only · Other Asian/Pacific 11% Spanish 8% Tagalog/Filipino 4%
Political lean MEDSL · Anchorage
- 2024 margin
- D (+12.7) · D 56.3% · R 43.7%
- 2016→2024 swing
- +27.9pp toward D · 2016: -15.2pp · 2024: 12.7pp
- All cycles
- 2024: D+12.7 2016: R+15.2
Not yet ingested
- Civics
- —
Market trends
- HPI YoY
- ▼ -203.51%
- Current HPI
- 257.8807
- Rent YoY
- ▲ 4.88%
- Metro
- Anchorage, AK
- State GDP YoY
- —
- F500 in state
- 0
Price history
+49.9% since first listed11 events — show timeline
- 2026-06-18 Listed $419,000 AKMLS
- 2018-09-14 Sold (Public Records) — Public Records
- 2018-02-12 Listed $343,000 AKMLS
- 2012-07-16 Sold (Public Records) — Public Records
- 2012-03-07 Listed $339,900 AKMLS
- 2010-03-09 Listed $179,900 AKMLS
- 2006-03-06 Sold (Public Records) — Public Records
- 2005-12-30 Listed $360,000 AKMLS
- 2004-11-19 Sold (Public Records) — Public Records
- 2004-03-16 Listed $279,500 AKMLS
- 1992-11-30 Sold (Public Records) — Public Records
Property tax history
+0.8%/yrLatest (2025): $5,534 · +2.4% YoY. Source: county tax records.
Cash-flow waterfall
monthlySold comps — $/sqft
last 12 mo · ≤1 miLoading sold comps…