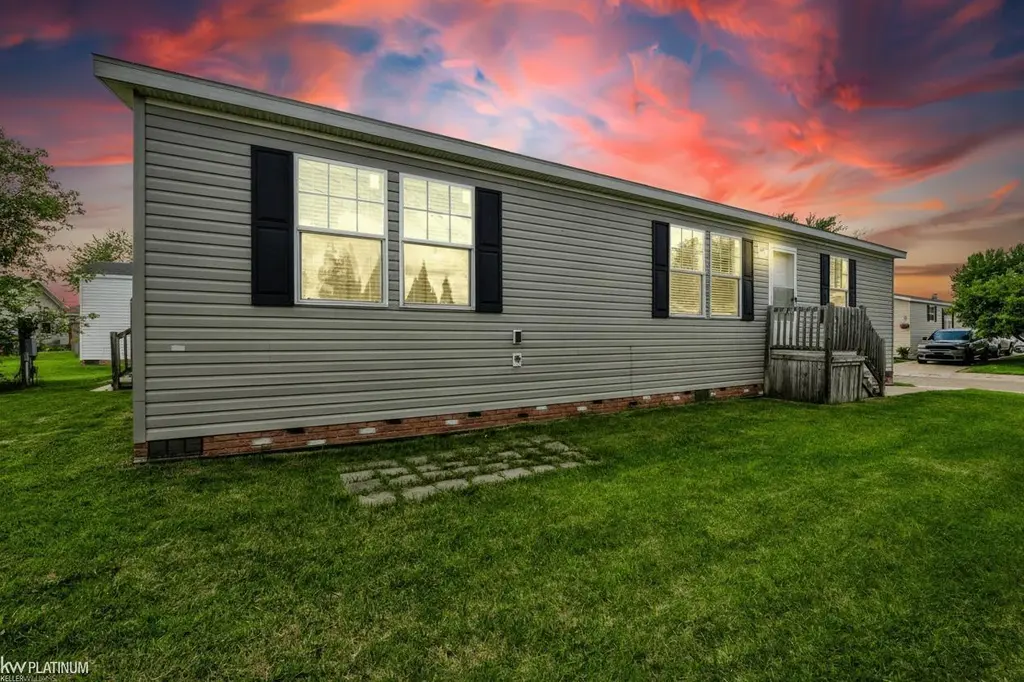
17128 Scarborough Dr · Macomb, MI
Flood risk No data
- FEMA flood zone
- —
- Chance of flooding over 30 yrs
- —
- Est. flood insurance / yr
- —
Fire risk No data
- Est. fire insurance / yr
- —
Heat risk No data
- Hot days now (above threshold)
- —
- Hot days in 30 yrs
- —
Wind risk No data
- Chance of severe wind over 30 yrs
- —
Air-quality risk No data
- Unhealthy air days now
- —
- Unhealthy air days in 30 yrs
- —
Risk factors via First Street. Map © Google.
Why this score? — see what drove the C+ grade
The composite is a weighted blend of 9 inputs, each scored 0–100. Each bar is that input's sub-score; the figure is the points it added to the 100-point composite (weight × sub-score).
- Cash flow +30.0/30.0
- 1% rule +10.0/10.0
- DSCR +10.0/10.0
- Schools +4.0/10.0
- Condition / age +4.0/5.0
- Rent growth +2.5/5.0
- Livability +2.5/5.0
- ARV discount +2.0/15.0
- Appreciation +0.0/10.0
$73,500
🖨 Deal sheet 📄 Offer letter ✓ Due diligence
Listing remarks MLS
Discover this impeccably maintained, 2017 Clayton Manufactured Home! Featuring 3 spacious bedrooms with each being equipped with generous walk-in closets, ensuring ample storage and organization; and two full bathrooms! This home is perfectly positioned at the end of a tranquil dead-end street. Also enjoy the additional privacy with no neighbors behind you! Step into the open-concept layout that exudes warmth and hospitality, highlighted by a stunning kitchen with a spacious pantry, a sleek stainless steel hood fan above the stove, and an extended countertop that provides extra workspace for your culinary creations. The kitchen is also equipped with a new double door stainless steel KitchenAid fridge; an oven, microwave, and dishwasher are also included. The large laundry area enhances functionality, making household chores a breeze, the washer and dryer are included. This home is more than just a residence; it embodies a lifestyle of comfort. Built by Clayton, known for exceptional craftsmanship, you can trust in the durability and quality of this home. And when it’s time to unwind, experience the vibrant lifestyle at Camelot Villa, where relaxation meets recreation. Unwind by the sparkling outdoor pool, energize in the fitness center, or socialize in the clubhouse. Schedule your viewing today and embrace the exceptional lifestyle this home has to offer!
Key facts
- Spacious pantry
- Stunning kitchen
- Open-concept layout
Tags
Property features AI
Finance
- Other: Located in Camelot Villa subdivision
- HOA & community: Homeowners association with monthly fee
Exterior
- Utilities: Public water; Public sewer
- Home design: Manufactured home; One level; Pillar/post/pier foundation
- Construction: 1,456 above-grade finished square feet
- Exterior features: No pool
Interior
- Kitchen: Dishwasher; Oven; Range; Refrigerator
- Bedrooms: 3 total rooms (includes bedrooms and living areas)
- Bathrooms: 2 full bathrooms
- Heating & cooling: Central air; Ceiling fan(s); Forced air heating (natural gas)
- Interior features: Ceiling fan(s); Central air conditioning; Forced air heating (natural gas)
- Laundry & utility: Washer; Dryer
Neighborhood map
What this means for you Summary
Snapshot
- This is a 3-bed/2.0-bath manufactured listed at $74k. Condition is rated good.
Deal economics
- At list price, monthly cash flow is $1k ($15k/yr) — positive.
- The deal already cash-flows at list — no discount required.
- Meets the 1% rule at list price ($2k rent vs $74k).
- Recommended offer: $72k (1.5% below list) — sets the bar for market timing.
Location & tenants
- Location reads: area grade C — affects rentability + tenant quality, not the cash-flow math above.
- Chippewa Valley Schools (suburban): math 39% / reading 50% proficiency, ranked #133 of 540 in MI (top 25%) — families likely to look elsewhere, expect single-tenant / working-renter base with shorter leases.
- Market conditions: 261 active listings in the ZIP; 13 comparable units currently listed for rent nearby; rentals leasing fast (median 3d on market — plan ~1-2 weeks tenant-placement turnaround); high-income renter base; 1,321 units permitted in Macomb County in 2024 (86 in 5+ unit buildings).
Forward outlook
- Local home prices are declining (-3.0%/yr); year-one equity from $508 of loan paydown is wiped out by about $2k of value loss. Plan a longer hold.
- Macomb County population projected at +9% by 2050 — modest demand growth; plan on rents tracking national, not racing it.
- At projected returns (-3.0% appreciation + 3.0% rent growth), your $21k cash investment doubles in ~2 years — after that, you're playing with house money.
Negotiation context
- It's been on market 20 days — a 2% lower offer ($72k) is reasonable based on typical stale-listing flexibility.
- 4 sale attempts with the ask held roughly flat each time — persistent listings suggest the price (not the market) is what's stuck; bring a comps-based counter.
Questions for the listing agent
- Is there a deadline driving the sale (1031 exchange, divorce, estate, relocation)? That informs how much negotiation room exists.
- What's the average days-on-market for RENTAL listings here right now (not sales)? A rising rental-DOM trend means longer vacancies and softer asking-rent achievability than the comps imply.
- What's the recent tenant-quality profile in this submarket — average credit score on applications, eviction rate, late-payment / NSF rate, and stable-employment percentage? A property-management company in the area should have these aggregated.
- How much new for-sale + rental construction is in the pipeline within 1–3 miles? Heavy new supply typically softens prices + rents 12–24 months out; constrained supply supports both.
Investment metrics
- 1% rule
- 2.99% ✓
- Cap rate
- 26.32%
- Cash-on-cash
- 71.51%
- DSCR
- 4.18
- GRM
- 2.8
CMA / ARV
- ARV (on-the-fly)
- $65,520
- Comps found
- 1
Show comp detail 1 sale within ~0.75 mi
| Address | Dist | Beds/Ba | Sqft | Sold | Price | $/sf | Match |
|---|---|---|---|---|---|---|---|
| 17017 Shrewsbury St | 0.55mi | 3/2.0 | 1,456 (0%) | 11mo | $65,000 | $45 | 66 |
Match score weights: distance 35% · size 25% · config 20% · recency 20%. Top-matched comps best support the ARV.
Projected returns pro-forma
-3.0% appreciation · 3.0% rent growth · sell at horizon
- IRR
- 71.2%
- Equity multiple
- 4.22×
- Total profit
- $66,236
- Equity at exit
- $10,959
- IRR
- 75.1%
- Equity multiple
- 8.70×
- Total profit
- $158,395
- Equity at exit
- $6,355
Cash invested: $20,580 (down + closing). Projections, not guarantees.
Landlord ↔ Tenant lean methodology
- Overall (STATE)
- 62 Landlord-Friendly
- State Michigan
- 62 Landlord-Friendly · EVEN
- County
- — inherits STATE
- City
- — inherits STATE
ZIP-level market 48044
- Active inventory
- 261
- Price-to-rent
- 2.8×
Monthly cashflow live
- Estimated rent
- $2,195 high interval (Pro) →
- Mortgage (P&I)
- −$385
- Tax est. 1.5%
- −$92 /mo · $1,102/yr
- Insurance
- −$31
- HOA
- −$0
- Vacancy / Maint / Mgmt
- −$461
- Net cashflow
- $1,226
Break-even live
UW: 25.0% down · 7.5% · 30yr · 1.5% tax · 5.0% vac · 8.0% maint · 8.0% mgmt
Financing live
Cash to close
- Down payment
- $18,375
- Closing costs
- $2,205
- Reserves months
- —
- Total cash needed
- —
Loan-product check · same deal, 3 products live
Conventional
25% down · 7.5% · 30yr
- Down + closing
- —
- Monthly P&I
- —
- Monthly cashflow
- —
- DSCR
- —
- Eligible?
- —
Personal DTI + credit; lowest rate.
DSCR
20% down · 8.5% · 30yr
- Down + closing
- —
- Monthly P&I
- —
- Monthly cashflow
- —
- DSCR
- —
- Eligible?
- —
No personal income docs; deal must DSCR.
Hard money
10% down · 12.0% · 12mo
- Down + closing
- —
- Monthly P&I
- —
- Monthly cashflow
- —
- DSCR
- —
- Eligible?
- —
Short-term bridge; refi at stabilization.
Rent comps 13 comps
| Address | Beds | Baths | Sqft | Rent | $/sqft | DOM | Units | Dist |
|---|---|---|---|---|---|---|---|---|
| 44565 Bayview Ave Clinton Twp, MI | 1.0–2.0 | 1.0–2.0 | 938 | $1,757 | $1.87 | 1d | 188 | 0.36mi |
| 16670 Newbury Ave Macomb, MI | 2.0 | 2.5 | 1601 | $2,250 | $1.41 | 1d | 1 | 0.40mi |
| 45255 Northport Dr Macomb, MI | 1.0–2.0 | 1.0–2.0 | 922 | $1,644 | $1.78 | 2d | 35 | 0.52mi |
| 16431 Dominion Dr Macomb, MI | 2.0 | 2.0 | 1400 | $1,800 | $1.29 | 24d | 1 | 0.55mi |
| 48953 Deerfield Park Dr S Macomb Township, MI | 2.0–3.0 | 2.0 | 1080 | $1,499 | $1.39 | 1d | 1 | 0.56mi |
| 17721 Montage Clinton Twp, MI | 2.0–3.0 | 2.0–3.0 | 1563 | $3,140 | $2.01 | 1d | 6 | 1.12mi |
| 44666 Connecticut Ct Clinton Twp, MI | 2.0 | 2.0 | 1800 | $1,750 | $0.97 | 43d | 1 | 1.18mi |
| 15522 Ashley Ct #64 Macomb, MI | 2.0 | 2.0 | 1100 | $1,500 | $1.36 | 24d | 1 | 1.18mi |
| 15536 Ashley Ct Macomb, MI | 2.0 | 2.0 | 1092 | $1,500 | $1.37 | 43d | 1 | 1.23mi |
| 48540 Parc Cir Macomb, MI | 2.0 | 2.0 | 1416 | $2,500 | $1.77 | 1d | 6 | 1.31mi |
| 15895 Cambridge Dr Clinton Twp, MI | 2.0 | 1.5 | 946 | $1,750 | $1.85 | 3d | 1 | 1.38mi |
| 44524 N Bunker Hill Dr Clinton Twp, MI | 2.0 | 1.0 | 968 | $1,400 | $1.45 | 43d | 1 | 1.39mi |
| 14973 Milan Ct Shelby Township, MI | 2.0–3.0 | 2.5 | 1773 | $2,924 | $1.65 | 1d | 4 | 1.43mi |
Listing history 14 events
-
2026-06-18days on market $73,500 Active 20 DOM
-
2026-06-17days on market $73,500 Active 19 DOM
-
2026-06-16days on market $73,500 Active 18 DOM
-
2026-06-15days on market $73,500 Active 17 DOM
-
2026-06-13days on market $73,500 Active 15 DOM
-
2026-06-13days on market $73,500 Active 14 DOM
-
2026-06-09days on market $73,500 Active 11 DOM
-
2026-06-08days on market $73,500 Active 10 DOM
-
2026-06-07days on market $73,500 Active 9 DOM
-
2026-06-04days on market $73,500 Active 6 DOM
-
2026-06-03days on market $73,500 Active 5 DOM
-
2026-06-02days on market $73,500 Active 4 DOM
-
2026-06-01days on market $73,500 Active 3 DOM
-
2026-05-31days on market $73,500 Active 2 DOM
ⓘ Source: listings_history table (triggers on properties + properties_extension) + one-shot
backfill from property_details.listing_events for pre-trigger history.
Nearby sold comps map
Loading sold comps map…
Walkable amenities ~0.75 mi
Loading nearby amenities…
Taxation est. · year 1
- Rental income
- $26,345
- − Mortgage interest
- −$4,117
- − Property taxes
- −$1,102
- − Insurance
- −$368
- − Repairs & maintenance
- −$2,108
- − Management
- −$2,108
- − Depreciation
- −$2,138
- Taxable income
- $14,405
- Est. tax owed @ 24.0%
- −$3,457
- After-tax cash flow
- $11,260/yr
For passive investors: Depreciation is non-cash, so a rental often shows a tax loss while cash-flowing — sheltering income. Rental losses are passive: they offset passive income freely, and up to $25,000/yr can offset ordinary (W-2) income if you actively participate and your MAGI is under $100k (phasing out to $0 by $150k); unused losses carry forward. On sale, claimed depreciation is recaptured at up to 25%, and gains may owe capital-gains tax (a 1031 exchange can defer both). Figures are a year-1 estimate at your 24.0% rate — not tax advice; consult a CPA.
Condition & rehab AI · 12 photos
This 2017 Clayton manufactured home is in excellent condition with a good condition score of 80. It offers a spacious and well-maintained interior with a good curb appeal. The home is ready for a new owner or tenant with minor maintenance items to address.
Value-add opportunities
- Resale Paint exterior siding — Fresh paint enhances curb appeal and home value.
- Both Replace carpet with hardwood flooring — Hardwood flooring is more durable and adds value for both resale and rental.
- Both Install smart home technology — Smart home features improve convenience and can increase home value for both buyers and renters.
Renovation cost estimate screening
Value-add ROI direction
- Resale Paint exterior siding — Fresh paint enhances curb appeal and home value. ↑
- Both Replace carpet with hardwood flooring — Hardwood flooring is more durable and adds value for both resale and rental. ↑
- Both Install smart home technology — Smart home features improve convenience and can increase home value for both buyers and renters. ↑
ⓘ Cost ranges are severity-bucket heuristics (US national rule-of-thumb). Get contractor quotes + a written scope before underwriting a rehab budget.
Schools (NCES district)
- District
- Chippewa Valley Schools
- NCES district ID
- 2609570
- Math proficiency
- 39% ▼ -10.00%
- Reading proficiency
- 50% ▼ -4.00%
- Median HH income
- $64,964
- Composite
- 39.61/100
- National rank
- #3922
- State rank
- #133 of 540 in MI
Livability — Macomb
No livability data for this city. (Only ~50 U.S. cities are tracked.)
Census & demographics
- County
- Macomb County · 638,552 people
- City population
- 58,754
- Metro
- Detroit-Warren-Dearborn, MI
- Population (ZIP)
- 58,754
- Household income
- $117,856
- Rent vs Own
- Severe rent burden
- 223.0
Population outlook (Macomb County) Hauer SSP2
- Today (2025)
- 925,296 people
- By 2030
- 948,226 · +2.5%
- By 2040
- 983,961 · +6.3%
- By 2050
- 1,010,200 · +9.2%
- By 2075
- 1,076,222 · +16.3%
- By 2100
- 1,077,065 · +16.4%
Race, ethnicity, and origin ACS 2023
- Neighborhood character
- Predominantly White (84%)
- Race & ethnicity
- White 84% Black 6% Two or more races 4% Asian 4% Hispanic / Latino 3%
- Common ancestry
- Romanian 14% Lithuanian 3% Slovak 2%
- Foreign-born
- 11% · Canada, China
- Languages at home
- 84% English-only · Other Indo-European 5% Russian/Polish/Slavic 3% Arabic 2%
Political lean MEDSL · Macomb
- 2024 margin
- R (+13.7) · D 42.2% · R 55.9% · Other 1.9%
- 2008→2024 swing
- -22.3pp toward R · 2008: 8.6pp · 2024: -13.7pp
- All cycles
- 2024: R+13.7 2020: R+8.1 2016: R+11.6 2012: D+4.0 2008: D+8.6
Not yet ingested
- Civics
- —
Market trends
- HPI YoY
- ▼ -204.17%
- Current HPI
- 221.35
- Rent YoY
- —
- Metro
- Detroit-Warren-Dearborn, MI
- State GDP YoY
- ▲ 1.37%
- F500 in state
- 28
Industry mix (Fortune 500 HQ in MI)
| Industry | F500 HQs | Revenue |
|---|---|---|
| Automotive Parts | 3 | $48B |
|
||
| Automotive | 2 | $372B |
|
||
| Chemicals | 1 | $45B |
|
||
| Automotive Retail | 1 | $29B |
|
||
| Healthcare / Medical Devices | 1 | $23B |
|
||
| Automotive Technology | 1 | $20B |
|
||
Price history
-5.8% since first listed15 events — show timeline
- 2026-05-29 Listed $73,500 REALCOMP
- 2026-05-29 Listed $73,500 MiRealSource-MiMLS
- 2025-08-27 Listing Removed — MiRealSource-MiMLS
- 2025-08-14 Price Changed $69,500 MiRealSource-MiMLS
- 2025-08-13 Price Changed $69,500 REALCOMP
- 2025-07-21 Price Changed $70,000 MiRealSource-MiMLS
- 2025-07-21 Price Changed $70,000 REALCOMP
- 2025-07-12 Price Changed $72,000 MiRealSource-MiMLS
- 2025-07-12 Price Changed $72,000 REALCOMP
- 2025-07-09 Price Changed $75,000 MiRealSource-MiMLS
- 2025-07-09 Price Changed $75,000 REALCOMP
- 2025-06-19 Price Changed $76,500 MiRealSource-MiMLS
- 2025-06-18 Price Changed $76,500 REALCOMP
- 2025-06-02 Listed $78,000 REALCOMP
- 2025-06-02 Listed $78,000 MiRealSource-MiMLS
Cash-flow waterfall
monthlySold comps — $/sqft
last 12 mo · ≤1 miLoading sold comps…