 Triplex
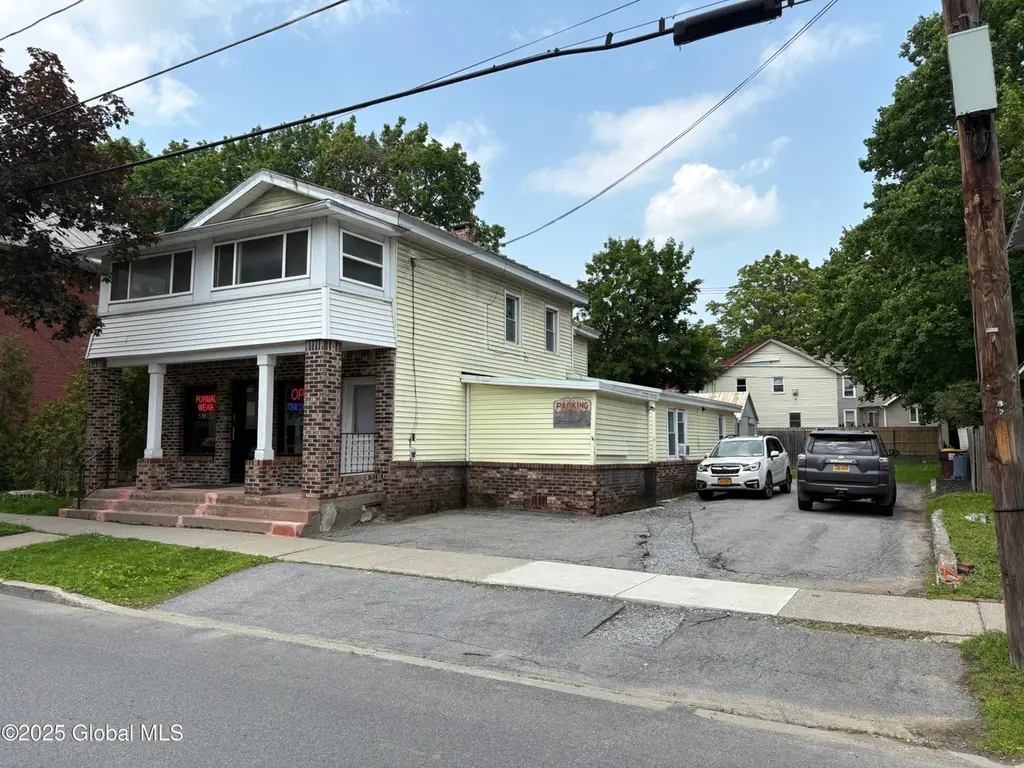
119 Church St · Saratoga Springs, NY
Flood risk No data
- FEMA flood zone
- —
- Chance of flooding over 30 yrs
- —
- Est. flood insurance / yr
- —
Fire risk No data
- Est. fire insurance / yr
- —
Heat risk No data
- Hot days now (above threshold)
- —
- Hot days in 30 yrs
- —
Wind risk No data
- Chance of severe wind over 30 yrs
- —
Air-quality risk No data
- Unhealthy air days now
- —
- Unhealthy air days in 30 yrs
- —
Risk factors via First Street. Map © Google.
Why this score? — see what drove the B- grade
The composite is a weighted blend of 9 inputs, each scored 0–100. Each bar is that input's sub-score; the figure is the points it added to the 100-point composite (weight × sub-score).
- Cash flow +23.8/30.0
- ARV discount +12.8/15.0
- DSCR +7.7/10.0
- 1% rule +6.2/10.0
- Schools +6.1/10.0
- Rent growth +4.8/5.0
- Livability +4.1/5.0
- Condition / age +2.5/5.0
- Appreciation +0.0/10.0
$859,000
🖨 Deal sheet 📄 Offer letter ✓ Due diligence
Multi-family units
County records classify this as Multi-Family (5+ Unit). Listing-text estimate: 3 units. estimate disagrees with records
5+ unit building — per-unit beds/baths from public records are typically unavailable; the breakdown below (if shown) is an estimate from the listing text.
Listing remarks MLS
Come see this 3 unit building in an awesome location, just a couple blocks from Broadway, This property has all kinds of possibilities. Two apartments ( One 2BR and one 3BR) and a 700+- office/tailor shop in front. Reported income represents only the 3BR unit. Large .16 acre lot with plenty of off street parking, 2 sheds, fence and even a garden! The 2 apartments have recently been nicely renovated. With a variance, the tailor shop can be used as a professional office with a sign and off street parking! The lot goes all the way back to the alley, creating endless possibilities.
Key facts
- 6,969 sq ft lot
- 6 parking spots
- Built 1860
Neighborhood map
What this means for you Summary
Snapshot
- This is a 3 × 5-bed/2.5-bath units multifamily listed at $859k. Condition is rated fair.
Deal economics
- At list price, monthly cash flow is $2k ($20k/yr) — positive. Per door: $552/mo.
- The deal already cash-flows at list — no discount required.
- Meets the 1% rule at list price ($10k rent vs $859k).
- Recommended offer: $807k (6.0% below list) — sets the bar for market timing.
- Cap rate 8.6% vs local median 2.0% in Saratoga Springs — top-decile yield for the area; either an underpriced asset or a hidden risk that comps aren't pricing in. Stress-test before assuming the spread holds.
Location & tenants
- Location reads 82/100 on livability (#83 in NY, #1,284 nationally) — a professional / high-income tenant draw. Strengths: employment A+, housing A+, schools A; Watch: amenities D+, cost of living F.
- Saratoga Springs City SD (suburban): math 67% / reading 72% proficiency, ranked #138 of 590 in NY (top 23%) — acceptable for families but not a draw, mixed tenant base, ~2y average lease; only 15% free/reduced lunch — higher-income household profile.
- Market conditions: Rents rising fast (+9.2%/yr); 474 active listings in the ZIP; solid renter incomes; 1,132 units permitted in Saratoga County in 2024 (378 in 5+ unit buildings).
- At $9,609/mo this rent would consume 113% of the median local household income ($102k/yr) (locally 1424% of renters already pay >50% of income on rent) — very limited rent-growth headroom before tenants either downsize or default.
Forward outlook
- Local home prices are declining (-3.0%/yr); year-one equity from $6k of loan paydown is wiped out by about $26k of value loss. Plan a longer hold.
- Saratoga County population projected at +4% by 2050 — modest demand growth; plan on rents tracking national, not racing it.
- At projected returns (-3.0% appreciation + 8.0% rent growth), your $241k cash investment doubles in ~8 years — after that, you're playing with house money.
Negotiation context
- It's been on market 62 days — a 6% lower offer ($807k) is reasonable based on typical stale-listing flexibility.
- 3 sale attempts since 2y ago with the ask held roughly flat each time — persistent listings suggest the price (not the market) is what's stuck; bring a comps-based counter.
Risks & watch-outs
- Watch-outs: built in 1860 — expect roof / HVAC / electrical / plumbing capex.
Questions for the listing agent
- It's been on market 62 days. Have you received any prior offers? Is the seller open to a 6% concession, seller financing, or rate buy-down credit?
- Can we see the unit-by-unit rent roll, current vacancy, and any below-market leases? What's the average tenancy length?
- What capital expenditures (roof, boiler, parking lot, exteriors) have been made in the last 5 years, and what's planned in the next 2?
- Have any recent inspections been done? Can we get a copy of the seller's disclosures and any deferred-maintenance estimates?
- Built in 1860 — when were the roof, HVAC, electrical panel, plumbing, and water heater last replaced?
- Why hasn't it sold? Are there any deal-killer items the seller is aware of (foundation, flood, title, zoning, code violations)?
- Is there a deadline driving the sale (1031 exchange, divorce, estate, relocation)? That informs how much negotiation room exists.
- Schools are A-rated — typically a magnet for longer-tenancy family renters. What's the average tenant stay here, and is there a school-zone premium baked into asking?
- What's the average days-on-market for RENTAL listings here right now (not sales)? A rising rental-DOM trend means longer vacancies and softer asking-rent achievability than the comps imply.
- What's the recent tenant-quality profile in this submarket — average credit score on applications, eviction rate, late-payment / NSF rate, and stable-employment percentage? A property-management company in the area should have these aggregated.
- How much new apartment / multifamily construction is in the pipeline within 1–3 miles? Heavy new supply (>2% of stock underway) typically softens rents 12–24 months out; light construction supports rent growth.
Investment metrics
- 1% rule
- 1.12% ✓
- Cap rate
- 8.60%
- Cash-on-cash
- 8.26%
- DSCR
- 1.37
- GRM
- 7.4
CMA / ARV
- ARV (median comp)
- $973,744
- List price
- $859,000
- Delta
- -11.78%
- Verdict
- UNDERPRICED
- Comps
- 20 within 1.0 mi
Projected returns pro-forma
-3.0% appreciation · 8.0% rent growth · sell at horizon
- IRR
- 1.8%
- Equity multiple
- 1.07×
- Total profit
- $17,124
- Equity at exit
- $128,080
- IRR
- 15.8%
- Equity multiple
- 2.59×
- Total profit
- $382,336
- Equity at exit
- $74,271
Cash invested: $240,520 (down + closing). Projections, not guarantees.
Landlord ↔ Tenant lean methodology
- Overall (STATE)
- 15 Strongly Tenant-Friendly
- State New York
- 15 Strongly Tenant-Friendly · D+10
- County
- — inherits STATE
- City
- — inherits STATE
ZIP-level market 12866
- Home prices YoY
- -31.8%
- Rents YoY
- 9.2%
- Active inventory
- 474
- Price-to-rent
- 22.3×
Monthly cashflow live
- Estimated rent
- $9,609 medium interval (Pro) →
- Mortgage (P&I)
- −$4,505
- Tax est. 1.5%
- −$1,074 /mo · $12,885/yr
- Insurance
- −$358
- HOA
- −$0
- Vacancy / Maint / Mgmt
- −$2,018
- Net cashflow
- $1,655
Break-even live
3-unit breakdown (identical units grouped — click to expand)
| Units | Beds | Baths | Est. rent |
|---|---|---|---|
| 3× units | 5 | 2.5 | $9,609 |
| #1 | 5 | 2.5 | $3,203 |
| #2 | 5 | 2.5 | $3,203 |
| #3 | 5 | 2.5 | $3,203 |
| Total (3 units) | $9,609 | ||
UW: 25.0% down · 7.5% · 30yr · 1.5% tax · 5.0% vac · 8.0% maint · 8.0% mgmt
Financing live
Cash to close
- Down payment
- $214,750
- Closing costs
- $25,770
- Reserves months
- —
- Total cash needed
- —
Loan-product check · same deal, 3 products live
Conventional
25% down · 7.5% · 30yr
- Down + closing
- —
- Monthly P&I
- —
- Monthly cashflow
- —
- DSCR
- —
- Eligible?
- —
Personal DTI + credit; lowest rate.
DSCR
20% down · 8.5% · 30yr
- Down + closing
- —
- Monthly P&I
- —
- Monthly cashflow
- —
- DSCR
- —
- Eligible?
- —
No personal income docs; deal must DSCR.
Hard money
10% down · 12.0% · 12mo
- Down + closing
- —
- Monthly P&I
- —
- Monthly cashflow
- —
- DSCR
- —
- Eligible?
- —
Short-term bridge; refi at stabilization.
Listing history 22 events
-
2026-06-18days on market $859,000 Active 62 DOM
-
2026-06-17days on market $859,000 Active 61 DOM
-
2026-06-16remarks 624-char remark
-
2026-06-16days on market $859,000 Active 60 DOM
-
2026-06-15days on market $859,000 Active 59 DOM
-
2026-06-14days on market $859,000 Active 57 DOM
-
2026-06-13days on market $859,000 Active 56 DOM
-
2026-06-10days on market $859,000 Active 54 DOM
-
2026-06-09days on market $859,000 Active 53 DOM
-
2026-06-08days on market $859,000 Active 52 DOM
-
2026-06-07days on market $859,000 Active 51 DOM
-
2026-06-05days on market $859,000 Active 48 DOM
-
2026-06-03days on market $859,000 Active 47 DOM
-
2026-06-02days on market $859,000 Active 46 DOM
-
2026-06-01days on market $859,000 Active 45 DOM
-
2026-05-31days on market $859,000 Active 44 DOM
-
2026-05-31days on market $859,000 Active 43 DOM
-
2026-04-16$859,000 Active 586-char remark
Show marketing remark (586 chars)
Come see this 3 unit building in an awesome location, just a couple blocks from Broadway, This property has all kinds of possibilities. Two apartments ( One 2BR and one 3BR) and a 700+- office/tailor shop in front. Reported income represents only the 3BR unit. Large .16 acre lot with plenty of off street parking, 2 sheds, fence and even a garden! The 2 apartments have recently been nicely renovated. With a variance, the tailor shop can be used as a professional office with a sign and off street parking! The lot goes all the way back to the alley, creating endless possibilities.
-
2025-12-16historical
-
2025-06-16$959,000 Active
-
2024-02-22historical $1,950
-
2024-01-12$1,950
ⓘ Source: listings_history table (triggers on properties + properties_extension) + one-shot
backfill from property_details.listing_events for pre-trigger history.
Nearby sold comps map
Loading sold comps map…
Walkable amenities ~0.75 mi
Loading nearby amenities…
Taxation est. · year 1
- Rental income
- $115,308
- − Mortgage interest
- −$48,117
- − Property taxes
- −$12,885
- − Insurance
- −$4,295
- − Repairs & maintenance
- −$9,225
- − Management
- −$9,225
- − Depreciation
- −$24,989
- Taxable income
- $6,572
- Est. tax owed @ 24.0%
- −$1,577
- After-tax cash flow
- $18,280/yr
For passive investors: Depreciation is non-cash, so a rental often shows a tax loss while cash-flowing — sheltering income. Rental losses are passive: they offset passive income freely, and up to $25,000/yr can offset ordinary (W-2) income if you actively participate and your MAGI is under $100k (phasing out to $0 by $150k); unused losses carry forward. On sale, claimed depreciation is recaptured at up to 25%, and gains may owe capital-gains tax (a 1031 exchange can defer both). Figures are a year-1 estimate at your 24.0% rate — not tax advice; consult a CPA.
Condition & rehab AI · 13 photos
This multi-family property requires moderate renovations to improve its condition and appeal. A kitchen renovation, appliance upgrade, and landscaping improvements would significantly increase its resale and rental value.
Repairs flagged
- Moderate Kitchen cabinets — The cabinets appear dated and could benefit from an upgrade.
- Moderate Appliances — The appliances appear outdated and could be replaced with modern models.
- Moderate Flooring — The flooring in the kitchen and bathrooms appears worn and could be replaced with more durable materials.
- Moderate Landscaping — The landscaping is basic and could be improved to enhance curb appeal.
Value-add opportunities
- Resale Kitchen renovation — A modern kitchen renovation can significantly increase the home's resale value.
- Rental Landscaping — Improved landscaping can enhance curb appeal and attract tenants.
- Both Appliance upgrade — Upgrading appliances can improve the home's functionality and appeal to both buyers and renters.
Renovation cost estimate screening
| Repair item | Severity | Est. cost |
|---|---|---|
| Kitchen cabinets · The cabinets appear dated and could benefit from an upgrade. | Moderate | $3,000–15,000 |
| Appliances · The appliances appear outdated and could be replaced with modern models. | Moderate | $3,000–15,000 |
| Flooring · The flooring in the kitchen and bathrooms appears worn and could be replaced with more durable materials. | Moderate | $3,000–15,000 |
| Landscaping · The landscaping is basic and could be improved to enhance curb appeal. | Moderate | $3,000–15,000 |
| Total estimated repair cost · 4 items | $12,000–60,000 |
Value-add ROI direction
- Resale Kitchen renovation — A modern kitchen renovation can significantly increase the home's resale value. ↑
- Rental Landscaping — Improved landscaping can enhance curb appeal and attract tenants. ↑
- Both Appliance upgrade — Upgrading appliances can improve the home's functionality and appeal to both buyers and renters. ↑
ⓘ Cost ranges are severity-bucket heuristics (US national rule-of-thumb). Get contractor quotes + a written scope before underwriting a rehab budget.
Schools (NCES district)
- District
- Saratoga Springs City SD
- NCES district ID
- 3625770
- Math proficiency
- 67% ▼ -10.00%
- Reading proficiency
- 72% ▲ 6.00%
- Median HH income
- $69,864
- Composite
- 60.83/100
- National rank
- #818
- State rank
- #138 of 590 in NY
Livability — Saratoga Springs
- Score
- 82/100
- State rank
- #83
- US rank
- #1284
Category grades
Schools grade is shown separately in the Schools card above.
Census & demographics
- Census place
- Saratoga Springs, NY
- County
- Saratoga County · 166,192 people
- City population
- 40,057
- Metro
- Albany-Schenectady-Troy, NY
- Population (ZIP)
- 40,057
- Household income
- $101,901
- Rent vs Own
- Severe rent burden
- 1424.0
Population outlook (Saratoga County) Hauer SSP2
- Today (2025)
- 238,889 people
- By 2030
- 243,681 · +2.0%
- By 2040
- 249,118 · +4.3%
- By 2050
- 248,638 · +4.1%
- By 2075
- 241,675 · +1.2%
- By 2100
- 213,150 · -10.8%
Race, ethnicity, and origin ACS 2023
- Neighborhood character
- Predominantly White (87%)
- Race & ethnicity
- White 87% Two or more races 5% Hispanic / Latino 4% Asian 2% Black 2%
- Common ancestry
- Romanian 6% Lithuanian 5% Slovak 2%
- Foreign-born
- 6% · Canada, South Korea, China
- Languages at home
- 92% English-only · Spanish 2% German/W. Germanic 1% Korean 1%
Political lean MEDSL · Saratoga
- 2024 margin
- Toss-up / Even · D 50.9% · R 49.1%
- 2008→2024 swing
- -1.6pp toward R · 2008: 3.4pp · 2024: 1.8pp
- All cycles
- 2024: D+1.8 2020: D+5.4 2016: R+4.4 2012: D+2.1 2008: D+3.4
Not yet ingested
- Civics
- —
Market trends
- HPI YoY
- ▼ -178.78%
- Current HPI
- 382.7429
- Rent YoY
- ▲ 9.15%
- Metro
- Albany-Schenectady-Troy, NY
- State GDP YoY
- ▲ 2.60%
- F500 in state
- 92
Industry mix (Fortune 500 HQ in NY)
| Industry | F500 HQs | Revenue |
|---|---|---|
| Financial Services | 10 | $950B |
|
||
| Consumer Goods | 9 | $162B |
|
||
| Insurance | 4 | $225B |
|
||
| Telecommunications | 2 | $144B |
|
||
| Pharmaceuticals | 2 | $112B |
|
||
| Media / Entertainment | 2 | $69B |
|
||
Price history
+43951.3% since first listed5 events — show timeline
- 2026-04-16 Listed $859,000 Global MLS
- 2025-12-16 Listing Removed — Global MLS
- 2025-06-16 Listed $959,000 Global MLS
- 2024-02-22 Rental Removed $1,950 GLOBALMLS
- 2024-01-12 Listed for Rent $1,950 GLOBALMLS
Cash-flow waterfall
monthlySold comps — $/sqft
last 12 mo · ≤1 miLoading sold comps…