 Triplex
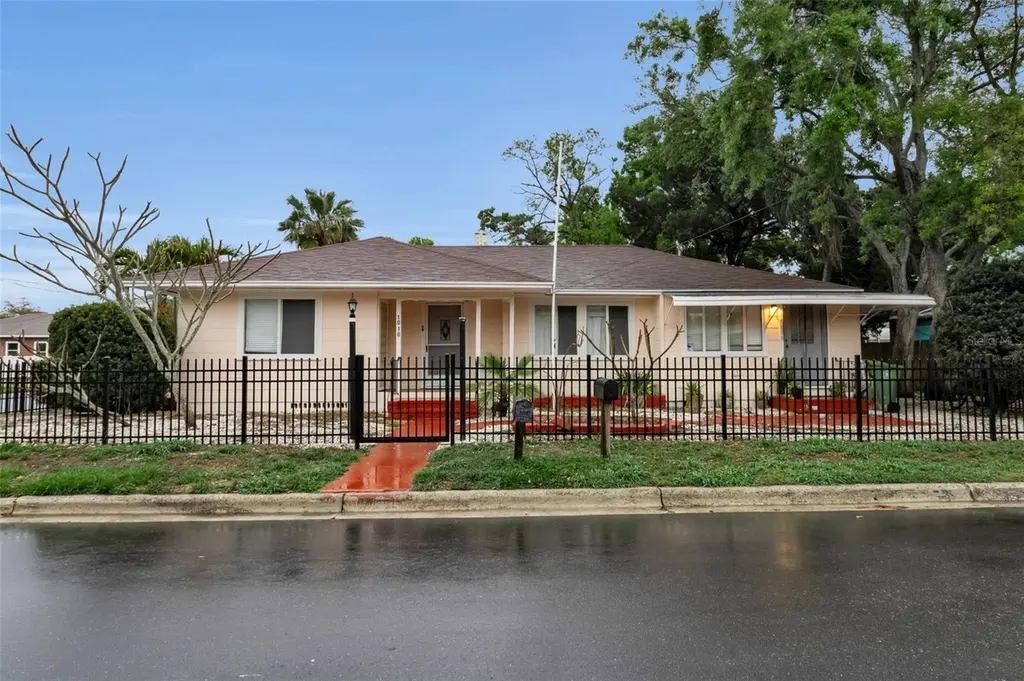
1008 16th Ave W · Bradenton, FL
Flood risk 4/10 · Minor
- FEMA flood zone
- X (unshaded)
- Chance of flooding over 30 yrs
- 0.22%
- Est. flood insurance / yr
- $507 – $1,088
Fire risk 1/10 · Minimal
- Est. fire insurance / yr
- $947 – $1,759
Heat risk 10/10 · Severe
- Hot days now (above 107°F)
- 7 days/yr
- Hot days in 30 yrs
- 30 days/yr
Wind risk 10/10 · Severe
- Chance of severe wind over 30 yrs
- 99.0%
Air-quality risk 3/10 · Minor
- Unhealthy air days now
- 2 days/yr
- Unhealthy air days in 30 yrs
- 2 days/yr
Risk factors via First Street. Map © Google.
Why this score? — see what drove the F grade
The composite is a weighted blend of 9 inputs, each scored 0–100. Each bar is that input's sub-score; the figure is the points it added to the 100-point composite (weight × sub-score).
- Cash flow +12.4/30.0
- Schools +4.4/10.0
- Livability +4.0/5.0
- DSCR +3.7/10.0
- 1% rule +3.0/10.0
- Condition / age +2.5/5.0
- Rent growth +1.9/5.0
- ARV discount +0.0/15.0
- Appreciation +0.0/10.0
$489,000
🖨 Deal sheet (PDF) 📄 Offer letter ✓ Due diligence
Multi-family units
County records classify this as Multi-Family (2-4 Unit). Listing-text estimate: 3 units. confirmed
Listing remarks
Prime Investment Opportunity in Bradenton’s Village of the Arts Located in the highly sought-after Village of the Arts, this unique property is in the process of being finalized as a legal triplex, with the current owner working with the City of Bradenton to convert the garage into a fully approved third unit. Offering flexibility for an end user to live in one unit and rent others or an investor with options for short-term, long-term, or seasonal rentals, this property presents strong income potential in a vibrant, high-demand area. Unit Breakdown: Unit 1: 2-bedroom, 1-bath featuring an updated kitchen with stainless steel appliances, laminate flooring, decorative fireplace, an
Key facts
- Mature oak tree
- Outdoor space
- Legal triplex
Tags
Neighborhood map
What this means for you Summary
Snapshot
- This is a 3 × 2-bed/1.0-bath units multifamily listed at $489k.
Deal economics
- At list price, monthly cash flow is $-82 ($-983/yr) — negative. Per door: $-27/mo.
- To cash-flow at today's rent, offer at most $475k (3.0% below list).
- To meet the 1% rule (rent ≥ 1% of price), the offer needs to be $392k (19.8% below list).
- Recommended offer: $392k (19.8% below list) — sets the bar for 1% rule.
- Cap rate 6.1% vs local median 3.6% in Bradenton — top-decile yield for the area; either an underpriced asset or a hidden risk that comps aren't pricing in. Stress-test before assuming the spread holds.
Location & tenants
- Location reads 81/100 on livability (#101 in FL, #1,528 nationally) — a professional / high-income tenant draw. Strengths: commute A+, cost of living A+, housing A+; Watch: employment D+, crime D, amenities F.
- Manatee (suburban): math 54% / reading 50% proficiency, ranked #26 of 73 in FL (top 36%) — acceptable for families but not a draw, mixed tenant base, ~2y average lease.
- Market conditions: Rents soft (-2.4%/yr); 319 active listings in the ZIP; 40 comparable units currently listed for rent nearby; rentals at typical pace (median 25d on market — plan ~3-4 weeks tenant-placement turnaround); 7,472 units permitted in Manatee County in 2024 (1,782 in 5+ unit buildings).
- At $3,924/mo this rent would consume 90% of the median local household income ($53k/yr) (locally 1736% of renters already pay >50% of income on rent) — very limited rent-growth headroom before tenants either downsize or default.
Forward outlook
- Local home prices are declining (-3.0%/yr); year-one equity from $3k of loan paydown is wiped out by about $15k of value loss. Plan a longer hold.
- Manatee County population projected at +43% by 2050 — long-run rental-demand tailwind backs the buy-and-hold thesis.
Negotiation context
- It's been on market 41 days — a 3% lower offer ($474k) is reasonable based on typical stale-listing flexibility.
- 12 sale attempts since 22y ago with the ask held roughly flat each time — persistent listings suggest the price (not the market) is what's stuck; bring a comps-based counter.
- Current owner paid $335k; 46% above their basis — modest negotiation headroom, anchor on the comps not their cost.
Risks & watch-outs
- Watch-outs: built in 1950 — expect roof / HVAC / electrical / plumbing capex.
- Climate carrying-cost: severe wind risk, 99% chance of damaging wind over 30y; extreme-heat days projected 7→30/yr by 2055 (HVAC capex compounding) — expect insurance premiums to compound above CPI over the hold.
Questions for the listing agent
- What do current leases actually rent for vs. the listed asking? Can we see a recent rent roll and the last 12 months of T-12 income?
- It's been on market 41 days. Have you received any prior offers? Is the seller open to a 20% concession, seller financing, or rate buy-down credit?
- Can we see the unit-by-unit rent roll, current vacancy, and any below-market leases? What's the average tenancy length?
- What capital expenditures (roof, boiler, parking lot, exteriors) have been made in the last 5 years, and what's planned in the next 2?
- Built in 1950 — when were the roof, HVAC, electrical panel, plumbing, and water heater last replaced?
- Is there a deadline driving the sale (1031 exchange, divorce, estate, relocation)? That informs how much negotiation room exists.
- Crime grade is D in this area — have there been break-ins, vandalism, or insurance claims at this property in the last 3 years? What carrier currently insures it and at what premium?
- The area grade is low — what's the realistic commute time and amenity access for the typical tenant pool here? Any planned neighborhood developments (good or bad) we should know about?
- What's the average days-on-market for RENTAL listings here right now (not sales)? A rising rental-DOM trend means longer vacancies and softer asking-rent achievability than the comps imply.
- What's the recent tenant-quality profile in this submarket — average credit score on applications, eviction rate, late-payment / NSF rate, and stable-employment percentage? A property-management company in the area should have these aggregated.
- How much new apartment / multifamily construction is in the pipeline within 1–3 miles? Heavy new supply (>2% of stock underway) typically softens rents 12–24 months out; light construction supports rent growth.
Investment metrics
- 1% rule
- 0.80% ✗
- Cap rate
- 6.09%
- Cash-on-cash
- -0.72%
- DSCR
- 0.97
- GRM
- 10.4
CMA / ARV
- ARV (on-the-fly)
- $361,248
- Comps found
- 4
Show comp detail 4 sales within ~0.75 mi
| Address | Dist | Beds/Ba | Sqft | Sold | Price | $/sf | Match |
|---|---|---|---|---|---|---|---|
| 1701 13th St W | 0.11mi | 3/2.0 | 1,180 (-7%) | 3mo | $263,000 | $223 | 80 |
| 2005 12th St W | 0.28mi | 3/2.0 | 1,175 (-8%) | 3mo | $232,000 | $197 | 72 |
| 1419 18th St W | 0.42mi | 3/3.0 | 1,260 (-1%) | 19mo | $400,000 | $317 | 59 |
| 1611 Ballard Park Dr | 0.57mi | 4/3.0 (+1) | 1,232 (-3%) | 15mo | $349,997 | $284 | 46 |
Match score weights: distance 35% · size 25% · config 20% · recency 20%. Top-matched comps best support the ARV.
Projected returns pro-forma
-3.0% appreciation · 0.0% rent growth · sell at horizon
- IRR
- -20.7%
- Equity multiple
- 0.30×
- Total profit
- $-96,017
- Equity at exit
- $72,911
- IRR
- -22.1%
- Equity multiple
- 0.01×
- Total profit
- $-135,021
- Equity at exit
- $42,280
Cash invested: $136,920 (down + closing). Projections, not guarantees.
Landlord ↔ Tenant lean methodology
- Overall (STATE)
- 87 Strongly Landlord-Friendly
- State Florida
- 87 Strongly Landlord-Friendly · R+3
- County
- — inherits STATE
- City
- — inherits STATE
ZIP-level market 34205
- Rents YoY
- -2.4%
- Active inventory
- 319
- Price-to-rent
- 31.2×
Monthly cashflow live
- Estimated rent
- $3,924 medium interval (Pro) →
- Mortgage (P&I)
- −$2,564
- Tax from tax record
- −$414 /mo · $4,965/yr
- Insurance
- −$204
- HOA
- −$0
- Vacancy / Maint / Mgmt
- −$824
- Net cashflow
- $-82
Break-even live
Sensitivity live
| Price | -10% $195 | -5% $57 | +0% $-82 | +5% $-220 | +10% $-359 |
|---|---|---|---|---|---|
| Rent | -10% $-392 | -5% $-237 | +0% $-82 | +5% $73 | +10% $228 |
| Rate | -1.0pp $164 | -0.5pp $42 | base $-82 | +0.5pp $-209 | +1.0pp $-338 |
3-unit breakdown (identical units grouped — click to expand)
| Units | Beds | Baths | Est. rent |
|---|---|---|---|
| 3× units | 2 | 1 | $3,924 |
| #1 | 2 | 1 | $1,308 |
| #2 | 2 | 1 | $1,308 |
| #3 | 2 | 1 | $1,308 |
| Total (3 units) | $3,924 | ||
UW: 25.0% down · 7.5% · 30yr · 1.5% tax · 5.0% vac · 8.0% maint · 8.0% mgmt
Financing live
Cash to close
- Down payment
- $122,250
- Closing costs
- $14,670
- Reserves months
- —
- Total cash needed
- —
Loan-product check · same deal, 3 products live
Conventional
25% down · 7.5% · 30yr
- Down + closing
- —
- Monthly P&I
- —
- Monthly cashflow
- —
- DSCR
- —
- Eligible?
- —
Personal DTI + credit; lowest rate.
DSCR
20% down · 8.5% · 30yr
- Down + closing
- —
- Monthly P&I
- —
- Monthly cashflow
- —
- DSCR
- —
- Eligible?
- —
No personal income docs; deal must DSCR.
Hard money
10% down · 12.0% · 12mo
- Down + closing
- —
- Monthly P&I
- —
- Monthly cashflow
- —
- DSCR
- —
- Eligible?
- —
Short-term bridge; refi at stabilization.
Rent comps 40 comps
| Address | Beds | Baths | Sqft | Rent | $/sqft | DOM | Units | Dist |
|---|---|---|---|---|---|---|---|---|
| 1319 18th Ave W Bradenton, FL | 3.0 | 2.0 | 1185 | $1,795 | $1.51 | 24d | 1 | 0.21mi |
| 1418 18th Avenue Dr W Unit 1418 Bradenton, FL | 3.0 | 2.0 | 1000 | $1,900 | $1.90 | 24d | 1 | 0.24mi |
| 702 21st Ave W Unit C Bradenton, FL | 2.0 | 1.0 | 1000 | $1,350 | $1.35 | 4d | 1 | 0.32mi |
| 1505 18th Avenue Dr W Bradenton, FL | 3.0 | 1.0 | 886 | $1,875 | $2.12 | 16d | 1 | 0.33mi |
| 2244 9th St W Bradenton, FL | 1.0–2.0 | 1.0–2.0 | 768 | $1,323 | $1.72 | 24d | 4 | 0.41mi |
| 1306 17th St W Unit 4 Bradenton, FL | 2.0 | 1.0 | 1000 | $1,100 | $1.10 | 16d | 1 | 0.45mi |
| 2422 11th St W Bradenton, FL | 2.0 | 1.0 | 900 | $1,445 | $1.61 | 24d | 1 | 0.49mi |
| 2004 20th Ave W Bradenton, FL | 3.0 | 2.0 | 1650 | $2,395 | $1.45 | 24d | 1 | 0.63mi |
| 302 26th Ave W Bradenton, FL | 2.0–3.0 | 2.0 | 1043 | $2,005 | $1.92 | 2d | 23 | 0.63mi |
| 603 27th Ave W Bradenton, FL | 2.0 | 1.0 | 1365 | $1,250 | $0.92 | 24d | 1 | 0.64mi |
| 1623 8th Ave W Bradenton, FL | 3.0 | 2.0 | 1650 | $3,500 | $2.12 | 2d | 1 | 0.66mi |
| 1214 21st St W Bradenton, FL | 3.0 | 3.0 | 1841 | $4,300 | $2.34 | 24d | 1 | 0.70mi |
| 2001 25th Ave W Bradenton, FL | 3.0 | 2.0 | 1370 | $3,000 | $2.19 | 20d | 1 | 0.77mi |
| 2321 18th Ave W Bradenton, FL | 2.0 | 2.0 | 1168 | $3,600 | $3.08 | 24d | 1 | 0.82mi |
| 313 24th Ave E Bradenton, FL | 3.0 | 2.0 | 1260 | $2,400 | $1.90 | 24d | 1 | 0.85mi |
| 2201 24th Ave W Bradenton, FL | 2.0 | 2.0 | 1115 | $1,950 | $1.75 | 24d | 1 | 0.86mi |
| 515 30th Ave W Bradenton, FL | 2.0 | 2.0 | 1001 | $1,375 | $1.37 | 16d | 2 | 0.87mi |
| 425 30th Ave W Unit C308 Bradenton, FL | 2.0 | 2.0 | 924 | $1,590 | $1.72 | 24d | 1 | 0.89mi |
| 305 30th Ave W Unit A207 Bradenton, FL | 2.0 | 2.0 | 1050 | $1,400 | $1.33 | 15d | 1 | 0.90mi |
| 305 30th Ave W Bradenton, FL | 1.0–2.0 | 1.5–2.0 | 987 | $1,400 | $1.42 | 24d | 2 | 0.90mi |
| 505 22nd Ter E Bradenton, FL | 3.0 | 2.0 | 1039 | $1,989 | $1.91 | 3d | 1 | 0.91mi |
| 102 Manatee Ave W Bradenton, FL | 1.0–3.0 | 1.0–2.0 | 1035 | $2,303 | $2.23 | 2d | 14 | 0.92mi |
| 505 30th Ave W Unit E406 Bradenton, FL | 2.0 | 2.0 | 1001 | $1,450 | $1.45 | 24d | 1 | 0.92mi |
| 808 3rd Ave W #509 Bradenton, FL | 2.0 | 2.0 | 1575 | $2,900 | $1.84 | 24d | 1 | 0.95mi |
| 1400 1st Ave W #504 Bradenton, FL | 2.0 | 2.0 | 1280 | $2,295 | $1.79 | 24d | 1 | 0.97mi |
| 606 3rd Ave W Bradenton, FL | 1.0–3.0 | 1.0–2.0 | 1090 | $2,105 | $1.93 | 2d | 23 | 0.98mi |
| 520 22nd St W Unit 1071597P Bradenton, FL | 3.0 | 2.0 | 1582 | $4,235 | $2.68 | 2d | 1 | 0.99mi |
| 919 34th Ave W Bradenton, FL | 3.0 | 1.0 | 950 | $1,599 | $1.68 | 12d | 1 | 0.99mi |
| 907 34th Ave W Bradenton, FL | 3.0 | 1.0 | 985 | $1,599 | $1.62 | 20d | 1 | 1.00mi |
| 907 34th Ave W Unit B Bradenton, FL | 3.0 | 1.0 | 1000 | $1,795 | $1.79 | 24d | 1 | 1.00mi |
| 390 301 Blvd W Bradenton, FL | 2.0 | 2.0 | 1125 | $1,495 | $1.33 | 24d | 1 | 1.02mi |
| 1016 7th St E Bradenton, FL | 3.0 | 2.0 | 1198 | $2,300 | $1.92 | 4d | 1 | 1.02mi |
| 2309 Manatee Ave W Bradenton, FL | 2.0 | 1.0 | 900 | $1,535 | $1.71 | 4d | 4 | 1.03mi |
| 1650 1st Ave W Unit 507B Bradenton, FL | 2.0 | 2.0 | 1269 | $2,300 | $1.81 | 24d | 1 | 1.05mi |
| 1600 1st Ave W Unit 206A Bradenton, FL | 2.0 | 2.0 | 1221 | $2,000 | $1.64 | 15d | 1 | 1.07mi |
| 3506 14th St W Bradenton, FL | 3.0 | 1.0–2.0 | 874 | $1,950 | $2.23 | 24d | 5 | 1.07mi |
| 1613 28th St W Bradenton, FL | 2.0 | 2.0 | 1200 | $1,850 | $1.54 | 24d | 1 | 1.07mi |
| 210 3rd St W Bradenton, FL | 1.0–3.0 | 1.0–2.0 | 1094 | $2,600 | $2.38 | 2d | 1 | 1.10mi |
| 210 3rd St W #8402 Bradenton, FL | 2.0 | 2.0 | 1000 | $2,600 | $2.60 | 24d | 1 | 1.10mi |
| 2306 30th Ave W Bradenton, FL | 3.0 | 2.0 | 945 | $1,700 | $1.80 | 24d | 1 | 1.10mi |
Listing history 36 events
-
2026-04-28status Pending
-
2026-03-17$489,000 Active
-
2025-04-16historical
-
2025-04-01price $459,000
-
2025-03-05$480,000 Active
-
2024-05-24$489,000 Active
-
2024-02-27$489,000 Active
-
2022-12-27soldstatus $335,000
-
2022-12-22soldstatus $335,000 Closed
-
2022-11-17status Pending
-
2022-11-06price $360,000
-
2022-10-30price $375,000
-
2022-10-22price $379,000
-
2022-10-03price $389,000
-
2022-09-22price $395,000
-
2022-09-08$400,000 Active
-
2017-02-21soldstatus $125,000
-
2017-02-16soldstatus $125,000 Sold
-
2017-01-27status Pending
-
2017-01-17$158,000 Active
-
2011-02-15soldstatus $40,000
-
2011-02-15soldstatus $44,900
-
2010-08-15$44,900
-
2010-08-04$44,900
-
2010-02-15historical
-
2009-04-07historical
-
2008-12-31$62,500
-
2008-12-31$99,000
-
2004-11-01soldstatus $146,000
-
2004-10-28soldstatus $146,000
-
2004-10-28soldstatus $146,000
-
2004-08-31historical
-
2004-08-31historical
-
2004-08-03$149,900
-
2004-08-03$149,900
-
1998-08-24soldstatus $50,000
ⓘ Source: listings_history table (triggers on properties + properties_extension) + one-shot
backfill from property_details.listing_events for pre-trigger history.
Tax reassessment forecast FL · Resets to sale price
- Current annual tax
- $4,965 · $414/mo
- Projected year-2 tax
- $4,965 · $414/mo
- Expected delta
- $0/yr ($0/mo · 0.0%)
ⓘ Screening estimate from a state-policy table — verify with the county assessor before closing.
Climate risk First Street
- Flood 4/10 Moderate FEMA zone X (unshaded) · 22% chance over 30 yrs
- Wildfire 1/10 Low
- Heat 10/10 Extreme 7 d/yr ≥107°F today · 30 d/yr by 30 yrs out
- Wind 10/10 Extreme 99% chance of damaging wind over 30 yrs
- Air quality 3/10 Moderate 2 unhealthy d/yr today · 2 by 30 yrs out
Nearby sold comps map
Loading sold comps map…
Walkable amenities ~0.75 mi
Loading nearby amenities…
Taxation est. · year 1
- Rental income
- $47,088
- − Mortgage interest
- −$27,392
- − Property taxes
- −$4,965
- − Insurance
- −$2,445
- − Repairs & maintenance
- −$3,767
- − Management
- −$3,767
- − Depreciation
- −$14,225
- Taxable loss
- −$9,473
- Est. tax savings @ 24.0%
- +$2,274
- After-tax cash flow
- $1,291/yr
For passive investors: Depreciation is non-cash, so a rental often shows a tax loss while cash-flowing — sheltering income. Rental losses are passive: they offset passive income freely, and up to $25,000/yr can offset ordinary (W-2) income if you actively participate and your MAGI is under $100k (phasing out to $0 by $150k); unused losses carry forward. On sale, claimed depreciation is recaptured at up to 25%, and gains may owe capital-gains tax (a 1031 exchange can defer both). Figures are a year-1 estimate at your 24.0% rate — not tax advice; consult a CPA.
Schools (NCES district)
- District
- Manatee
- NCES district ID
- 1201230
- Math proficiency
- 54% ▼ -6.00%
- Reading proficiency
- 50% ▼ -2.00%
- Median HH income
- $49,607
- Composite
- 44.43/100
- National rank
- #2806
- State rank
- #26 of 73 in FL
Livability — Bradenton
- Score
- 81/100
- State rank
- #101
- US rank
- #1528
Category grades
Schools grade is shown separately in the Schools card above.
Census & demographics
- Census place
- Bradenton, FL
- County
- Manatee County · 416,364 people
- City population
- 227,091
- Metro
- North Port-Sarasota-Bradenton, FL
- Population (ZIP)
- 31,946
- Household income
- $52,525
- Rent vs Own
- Severe rent burden
- 1736.0
Population outlook (Manatee County) Hauer SSP2
- Today (2025)
- 447,342 people
- By 2030
- 488,911 · +9.3%
- By 2040
- 567,934 · +27.0%
- By 2050
- 637,995 · +42.6%
- By 2075
- 781,970 · +74.8%
- By 2100
- 848,272 · +89.6%
Race, ethnicity, and origin ACS 2023
- Neighborhood character
- Predominantly White (65%)
- Race & ethnicity
- White 65% Hispanic / Latino 18% Black 10% Two or more races 9% Asian 2% Native American 1%
- Hispanic origin (detail)
- Mexican 7% Puerto Rican 4% Cuban 1%
- Common ancestry
- Hispanic 2% Romanian 2% Lithuanian 2%
- Foreign-born
- 15% · Canada, Vietnam
- Languages at home
- 78% English-only · Spanish 14% French/Haitian/Cajun 2% German/W. Germanic 1%
Political lean MEDSL · Manatee
- 2024 margin
- Strong R (+23.5) · D 37.9% · R 61.4%
- 2008→2024 swing
- -16.5pp toward R · 2008: -7.0pp · 2024: -23.5pp
- All cycles
- 2024: R+23.5 2020: R+16.1 2016: R+17.1 2012: R+12.5 2008: R+7.0
Not yet ingested
- Civics
- —
Market trends
- HPI YoY
- ▼ -310.18%
- Current HPI
- 369.8239
- Rent YoY
- ▼ -2.43%
- Metro
- North Port-Sarasota-Bradenton, FL
- State GDP YoY
- ▲ 3.28%
- F500 in state
- 36
Industry mix (Fortune 500 HQ in FL)
| Industry | F500 HQs | Revenue |
|---|---|---|
| Industrial Technology | 2 | $29B |
|
||
| Insurance | 2 | $17B |
|
||
| Retail | 1 | $60B |
|
||
| Technology Distribution | 1 | $58B |
|
||
| Homebuilding | 1 | $35B |
|
||
| Technology Manufacturing | 1 | $35B |
|
||
Price history
+878.0% since first listed36 events — show timeline
- 2026-04-28 Pending — Stellar MLS as Distributed by MLS Grid
- 2026-03-17 Listed $489,000 Stellar MLS as Distributed by MLS Grid
- 2025-04-16 Listing Removed — Stellar MLS as Distributed by MLS Grid
- 2025-04-01 Price Changed $459,000 Stellar MLS as Distributed by MLS Grid
- 2025-03-05 Listed $480,000 Stellar MLS as Distributed by MLS Grid
- 2024-05-24 Listed $489,000 Stellar MLS as Distributed by MLS Grid
- 2024-02-27 Listed $489,000 Stellar MLS as Distributed by MLS Grid
- 2022-12-27 Sold (Public Records) $335,000 Public Records
- 2022-12-22 Sold (MLS) $335,000 Stellar MLS as Distributed by MLS Grid
- 2022-11-17 Pending — Stellar MLS as Distributed by MLS Grid
- 2022-11-06 Price Changed $360,000 Stellar MLS as Distributed by MLS Grid
- 2022-10-30 Price Changed $375,000 Stellar MLS as Distributed by MLS Grid
- 2022-10-22 Price Changed $379,000 Stellar MLS as Distributed by MLS Grid
- 2022-10-03 Price Changed $389,000 Stellar MLS as Distributed by MLS Grid
- 2022-09-22 Price Changed $395,000 Stellar MLS as Distributed by MLS Grid
- 2022-09-08 Listed $400,000 Stellar MLS as Distributed by MLS Grid
- 2017-02-21 Sold (Public Records) $125,000 Public Records
- 2017-02-16 Sold (MLS) $125,000 Stellar MLS as Distributed by MLS Grid
- 2017-01-27 Pending — Stellar MLS as Distributed by MLS Grid
- 2017-01-17 Listed $158,000 Stellar MLS as Distributed by MLS Grid
- 2011-02-15 Sold (MLS) $44,900 Stellar MLS as Distributed by MLS Grid
- 2011-02-15 Sold (MLS) $40,000 Stellar MLS as Distributed by MLS Grid
- 2010-08-15 Listed $44,900 Stellar MLS as Distributed by MLS Grid
- 2010-08-04 Listed $44,900 Stellar MLS as Distributed by MLS Grid
- 2010-02-15 Listing Removed — Stellar MLS as Distributed by MLS Grid
- 2009-04-07 Listing Removed — Stellar MLS as Distributed by MLS Grid
- 2008-12-31 Listed $99,000 Stellar MLS as Distributed by MLS Grid
- 2008-12-31 Listed $62,500 Stellar MLS as Distributed by MLS Grid
- 2004-11-01 Sold (Public Records) $146,000 Public Records
- 2004-10-28 Sold (MLS) $146,000 Stellar MLS as Distributed by MLS Grid
- 2004-10-28 Sold (MLS) $146,000 Stellar MLS as Distributed by MLS Grid
- 2004-08-31 Listing Removed — Stellar MLS as Distributed by MLS Grid
- 2004-08-31 Listing Removed — Stellar MLS as Distributed by MLS Grid
- 2004-08-03 Listed $149,900 Stellar MLS as Distributed by MLS Grid
- 2004-08-03 Listed $149,900 Stellar MLS as Distributed by MLS Grid
- 1998-08-24 Sold (Public Records) $50,000 Public Records
Property tax history
+11.1%/yrLatest (2025): $4,965 · -0.3% YoY. Source: county tax records.
Cash-flow waterfall
monthlySold comps — $/sqft
last 12 mo · ≤1 miLoading sold comps…