1528 Hickory Grove Rd · Wallace, SC
Flood risk 1/10 · Minimal
- FEMA flood zone
- X (unshaded)
- Chance of flooding over 30 yrs
- 0.0%
- Est. flood insurance / yr
- $507 – $1,088
Fire risk 7/10 · Major
- Est. fire insurance / yr
- $783 – $1,453
Heat risk 7/10 · Major
- Hot days now (above 108°F)
- 7 days/yr
- Hot days in 30 yrs
- 16 days/yr
Wind risk 7/10 · Major
- Chance of severe wind over 30 yrs
- 78.0%
Air-quality risk 1/10 · Minimal
- Unhealthy air days now
- 0 days/yr
- Unhealthy air days in 30 yrs
- 0 days/yr
Risk factors via First Street. Map © Google.
Why this score? — see what drove the D+ grade
The composite is a weighted blend of 9 inputs, each scored 0–100. Each bar is that input's sub-score; the figure is the points it added to the 100-point composite (weight × sub-score).
- Cash flow +20.2/30.0
- ARV discount +7.5/15.0
- DSCR +6.4/10.0
- 1% rule +4.4/10.0
- Livability +2.8/5.0
- Rent growth +2.5/5.0
- Condition / age +2.5/5.0
- Schools +1.6/10.0
- Appreciation +0.0/10.0
$124,900
🖨 Deal sheet (PDF) 📄 Offer letter ✓ Due diligence
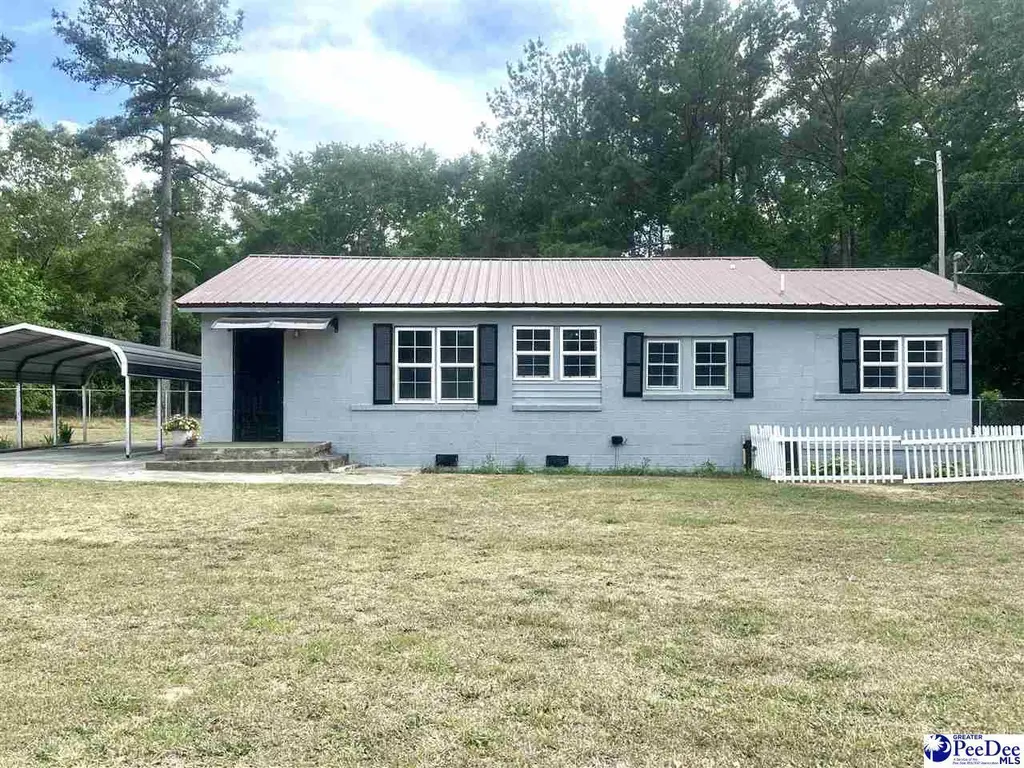
Listing remarks
Charming 3BR/2BA Home with Peaceful Country Setting – No Restrictions! Enjoy the freedom of country living with this well-maintained 3 bedroom, 2 bathroom home situated in a quiet, peaceful setting. With no zoning or restrictions, this property offers endless possibilities—perfect for a primary residence, rental investment, or even a small homestead. Inside, you’ll find a functional layout featuring a bright kitchen with ample cabinet space, updated flooring, and a cozy living area filled with natural light. The home offers three comfortable bedrooms and two full bathrooms, providing plenty of space for family or guests. Step outside and appreciate the open yard, ideal for
Key facts
- Spacious yard
- Covered carport
- Country setting
Tags
Property features AI
Finance
- Other: Lot size approximately 0.51 acres
Exterior
- Utilities: Public water; Septic tank
- Home design: Residential single-family home
- Construction: Above-grade finished living area: 1,288; Metal roof; Crawl space foundation
- Exterior features: Patio; Storm door(s); Fenced yard; Metal roof
Interior
- Kitchen: Oven; Range
- Flooring: Carpet; Laminate; Tile
- Bathrooms: 2 full bathrooms
- Heating & cooling: Central heating; Central air conditioning; Ceiling fans
- Interior features: Insulated windows; Crawl space basement
- Laundry & utility: Washer; Dryer
Neighborhood map
What this means for you Summary
Snapshot
- This is a 3-bed/2.0-bath single-family listed at $125k.
Deal economics
- At list price, monthly cash flow is $158 ($2k/yr) — positive.
- The deal already cash-flows at list — no discount required.
- To meet the 1% rule (rent ≥ 1% of price), the offer needs to be $118k (5.6% below list).
- Recommended offer: $118k (5.6% below list) — sets the bar for 1% rule.
Location & tenants
- Location reads 55/100 on livability (#311 in SC) — a working-class tenant base; expect higher turnover. Strengths: cost of living A+, housing A; Watch: crime F, amenities F, commute F.
- Marlboro 01 (town): math 16% / reading 25% proficiency, ranked #71 of 80 in SC (top 89%) — low school quality limits family demand, transient renter base, plan for 1-2y turnover; 76% free/reduced lunch — lower-income household profile, screen leases tightly.
- Zoned schools: Bennettsville Primary (math 17% / reading 17%, grade F, #515 of 597 statewide, top 89%, 552 students, 100% FRL); Marlboro County High (math 22% / reading 77%, grade D, #151 of 196 statewide, top 79%, 1,047 students, 100% FRL) — zoned schools average 100% FRL vs 76% district-wide (24 pts higher); higher-poverty schools than district average — tighter screening recommended.
- Zoned-school proficiency averages 33% at this address vs 20% district-wide (+13 pts) — the actual schools serving this property are materially stronger than the Marlboro 01 average implies; a family-tenant draw the district grade alone would hide.
- Market conditions: 54 active listings in the ZIP; 6 units permitted in Marlboro County in 2024 (0 in 5+ unit buildings).
Forward outlook
- Local home prices are declining (-3.0%/yr); year-one equity from $864 of loan paydown is wiped out by about $4k of value loss. Plan a longer hold.
- Marlboro County population projected at -23% by 2050 — secular population decline; favor cash flow + early exit over multi-decade hold.
Negotiation context
- It's been on market 50 days — a 3% lower offer ($121k) is reasonable based on typical stale-listing flexibility.
- Current owner paid $15k; list at $125k implies a 733% gain — meaningful room to come down on a strong offer.
Risks & watch-outs
- Climate carrying-cost: major wind risk, 78% chance of damaging wind over 30y; major wildfire risk; extreme-heat days projected 7→16/yr by 2055 (HVAC capex compounding) — expect insurance premiums to compound above CPI over the hold.
Questions for the listing agent
- It's been on market 50 days. Have you received any prior offers? Is the seller open to a 6% concession, seller financing, or rate buy-down credit?
- Is there a deadline driving the sale (1031 exchange, divorce, estate, relocation)? That informs how much negotiation room exists.
- Schools are F-rated, which usually means shorter tenancies and higher turnover. Who's the typical renter profile here, and what's been the actual vacancy rate?
- Crime grade is F in this area — have there been break-ins, vandalism, or insurance claims at this property in the last 3 years? What carrier currently insures it and at what premium?
- The area grade is low — what's the realistic commute time and amenity access for the typical tenant pool here? Any planned neighborhood developments (good or bad) we should know about?
- What's the average days-on-market for RENTAL listings here right now (not sales)? A rising rental-DOM trend means longer vacancies and softer asking-rent achievability than the comps imply.
- What's the recent tenant-quality profile in this submarket — average credit score on applications, eviction rate, late-payment / NSF rate, and stable-employment percentage? A property-management company in the area should have these aggregated.
- How much new for-sale + rental construction is in the pipeline within 1–3 miles? Heavy new supply typically softens prices + rents 12–24 months out; constrained supply supports both.
Investment metrics
- 1% rule
- 0.94% ✗
- Cap rate
- 7.81%
- Cash-on-cash
- 5.43%
- DSCR
- 1.24
- GRM
- 8.8
CMA / ARV
No comps found within radius.
Projected returns pro-forma
-3.0% appreciation · 3.0% rent growth · sell at horizon
- IRR
- -7.9%
- Equity multiple
- 0.71×
- Total profit
- $-10,202
- Equity at exit
- $18,623
- IRR
- 1.6%
- Equity multiple
- 1.11×
- Total profit
- $3,937
- Equity at exit
- $10,799
Cash invested: $34,972 (down + closing). Projections, not guarantees.
Landlord ↔ Tenant lean methodology
- Overall (STATE)
- 90 Strongly Landlord-Friendly
- State South Carolina
- 90 Strongly Landlord-Friendly · R+6
- County
- — inherits STATE
- City
- — inherits STATE
ZIP-level market 29512
- Active inventory
- 54
- Price-to-rent
- 8.8×
Monthly cashflow live
- Estimated rent
- $1,179 medium interval (Pro) →
- Mortgage (P&I)
- −$655
- Tax from tax record
- −$66 /mo · $797/yr
- Insurance
- −$52
- HOA
- −$0
- Vacancy / Maint / Mgmt
- −$248
- Net cashflow
- $158
Break-even live
Sensitivity live
| Price | -10% $229 | -5% $194 | +0% $158 | +5% $123 | +10% $87 |
|---|---|---|---|---|---|
| Rent | -10% $65 | -5% $112 | +0% $158 | +5% $205 | +10% $251 |
| Rate | -1.0pp $221 | -0.5pp $190 | base $158 | +0.5pp $126 | +1.0pp $93 |
UW: 25.0% down · 7.5% · 30yr · 1.5% tax · 5.0% vac · 8.0% maint · 8.0% mgmt
Financing live
Cash to close
- Down payment
- $31,225
- Closing costs
- $3,747
- Reserves months
- —
- Total cash needed
- —
Loan-product check · same deal, 3 products live
Conventional
25% down · 7.5% · 30yr
- Down + closing
- —
- Monthly P&I
- —
- Monthly cashflow
- —
- DSCR
- —
- Eligible?
- —
Personal DTI + credit; lowest rate.
DSCR
20% down · 8.5% · 30yr
- Down + closing
- —
- Monthly P&I
- —
- Monthly cashflow
- —
- DSCR
- —
- Eligible?
- —
No personal income docs; deal must DSCR.
Hard money
10% down · 12.0% · 12mo
- Down + closing
- —
- Monthly P&I
- —
- Monthly cashflow
- —
- DSCR
- —
- Eligible?
- —
Short-term bridge; refi at stabilization.
Listing history 18 events
-
2026-06-19days on market $124,900 Active 50 DOM
-
2026-06-18days on market $124,900 Active 49 DOM
-
2026-06-17days on market $124,900 Active 48 DOM
-
2026-06-16days on market $124,900 Active 47 DOM
-
2026-06-15days on market $124,900 Active 46 DOM
-
2026-06-14days on market $124,900 Active 44 DOM
-
2026-06-13days on market $124,900 Active 43 DOM
-
2026-06-10days on market $124,900 Active 41 DOM
-
2026-06-09days on market $124,900 Active 40 DOM
-
2026-06-08days on market $124,900 Active 39 DOM
-
2026-06-07days on market $124,900 Active 38 DOM
-
2026-06-03days on market $124,900 Active 34 DOM
-
2026-06-02days on market $124,900 Active 33 DOM
-
2026-06-01days on market $124,900 Active 32 DOM
-
2026-05-31days on market $124,900 Active 31 DOM
-
2026-05-30days on market $124,900 Active 30 DOM
-
2026-04-30$124,900 Active
-
2025-06-10soldstatus $15,000
ⓘ Source: listings_history table (triggers on properties + properties_extension) + one-shot
backfill from property_details.listing_events for pre-trigger history.
Tax reassessment forecast SC · Resets to sale price
- Current annual tax
- $797 · $66/mo
- Projected year-2 tax
- $797 · $66/mo
- Expected delta
- $0/yr ($0/mo · 0.0%)
ⓘ Screening estimate from a state-policy table — verify with the county assessor before closing.
Climate risk First Street
- Flood 1/10 Low FEMA zone X (unshaded) · 0% chance over 30 yrs
- Wildfire 7/10 Severe
- Heat 7/10 Severe 7 d/yr ≥108°F today · 16 d/yr by 30 yrs out
- Wind 7/10 Severe 78% chance of damaging wind over 30 yrs
- Air quality 1/10 Low 0 unhealthy d/yr today · 0 by 30 yrs out
Nearby sold comps map
Loading sold comps map…
Walkable amenities ~0.75 mi
Loading nearby amenities…
Taxation est. · year 1
- Rental income
- $14,151
- − Mortgage interest
- −$6,996
- − Property taxes
- −$797
- − Insurance
- −$624
- − Repairs & maintenance
- −$1,132
- − Management
- −$1,132
- − Depreciation
- −$3,633
- Taxable loss
- −$164
- Est. tax savings @ 24.0%
- +$39
- After-tax cash flow
- $1,938/yr
For passive investors: Depreciation is non-cash, so a rental often shows a tax loss while cash-flowing — sheltering income. Rental losses are passive: they offset passive income freely, and up to $25,000/yr can offset ordinary (W-2) income if you actively participate and your MAGI is under $100k (phasing out to $0 by $150k); unused losses carry forward. On sale, claimed depreciation is recaptured at up to 25%, and gains may owe capital-gains tax (a 1031 exchange can defer both). Figures are a year-1 estimate at your 24.0% rate — not tax advice; consult a CPA.
Schools (NCES district)
- District
- Marlboro 01
- NCES district ID
- 4502970
- Math proficiency
- 16% ▼ -9.00%
- Reading proficiency
- 25% ▼ -2.00%
- Median HH income
- $29,865
- Composite
- 16.37/100
- National rank
- #9201
- State rank
- #71 of 80 in SC
Livability — Wallace
- Score
- 55/100
- State rank
- #311
- US rank
- #23554
Category grades
Schools grade is shown separately in the Schools card above.
Census & demographics
- City population
- 1,972
- Population (ZIP)
- 17,408
Population outlook (Marlboro County) Hauer SSP2
- Today (2025)
- 25,477 people
- By 2030
- 24,266 · -4.8%
- By 2040
- 21,862 · -14.2%
- By 2050
- 19,665 · -22.8%
- By 2075
- 15,673 · -38.5%
- By 2100
- 12,390 · -51.4%
Race, ethnicity, and origin ACS 2023
- Neighborhood character
- Diverse neighborhood (Simpson 0.57)
- Race & ethnicity
- Black 57% White 32% Two or more races 5% Hispanic / Latino 3% Native American 2%
- Common ancestry
- Slovak 1% Serbian 1%
- Foreign-born
- 2% · Canada, South Korea
- Languages at home
- 98% English-only · Spanish 2%
Political lean MEDSL · Marlboro
- 2024 margin
- Toss-up / Even · D 50.6% · R 48.2% · Other 1.2%
- 2008→2024 swing
- -3.7pp toward R · 2008: 6.1pp · 2024: 2.4pp
- All cycles
- 2024: D+2.4 2020: D+10.9 2016: D+16.1 2012: D+30.4 2008: D+6.1
Not yet ingested
- Civics
- —
Market trends
- HPI YoY
- ▼ -80.61%
- Current HPI
- 108.4261
- Rent YoY
- —
- Metro
- —
- State GDP YoY
- ▲ 4.51%
- F500 in state
- 2
Industry mix (Fortune 500 HQ in SC)
| Industry | F500 HQs | Revenue |
|---|---|---|
| Packaging | 1 | $7B |
|
||
Price history
+732.7% since first listed2 events — show timeline
- 2026-04-30 Listed $124,900 RAGPD
- 2025-06-10 Sold (Public Records) $15,000 Public Records
Property tax history
+45.4%/yrLatest (2025): $797 · +9.4% YoY. Source: county tax records.
Cash-flow waterfall
monthlySold comps — $/sqft
last 12 mo · ≤1 miLoading sold comps…