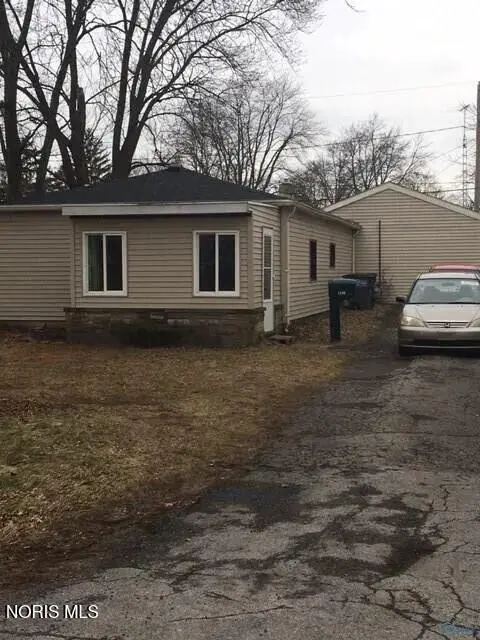
5539 Fenwick Dr · Toledo, OH
Flood risk 1/10 · Minimal
- FEMA flood zone
- X (unshaded)
- Chance of flooding over 30 yrs
- 0.0%
- Est. flood insurance / yr
- $507 – $1,088
Fire risk 1/10 · Minimal
- Est. fire insurance / yr
- $713 – $1,323
Heat risk 3/10 · Minor
- Hot days now (above 101°F)
- 7 days/yr
- Hot days in 30 yrs
- 16 days/yr
Wind risk 2/10 · Minimal
- Chance of severe wind over 30 yrs
- —
Air-quality risk 2/10 · Minimal
- Unhealthy air days now
- 1 days/yr
- Unhealthy air days in 30 yrs
- 3 days/yr
Risk factors via First Street. Map © Google.
Why this score? — see what drove the C grade
The composite is a weighted blend of 9 inputs, each scored 0–100. Each bar is that input's sub-score; the figure is the points it added to the 100-point composite (weight × sub-score).
- Cash flow +20.0/30.0
- ARV discount +15.0/15.0
- DSCR +6.3/10.0
- 1% rule +6.1/10.0
- Schools +3.5/10.0
- Livability +3.3/5.0
- Rent growth +2.5/5.0
- Condition / age +2.5/5.0
- Appreciation +0.0/10.0
$99,900
🖨 Deal sheet (PDF) 📄 Offer letter ✓ Due diligence
Listing remarks MLS
NEW ROOF MANY UPDATES MUST SEE INSIDE
Key facts
- 7,900 sq ft lot
- 3 parking spots
- Built 1950
Neighborhood map
What this means for you Summary
Snapshot
- This is a 3-bed/1.0-bath single-family listed at $100k.
Deal economics
- At list price, monthly cash flow is $122 ($1k/yr) — positive.
- The deal already cash-flows at list — no discount required.
- Meets the 1% rule at list price ($1k rent vs $100k).
- Recommended offer: $97k (3.0% below list) — sets the bar for market timing.
Location & tenants
- Location reads 66/100 on livability (#645 in OH) — a middle-class / working-renter tenant base. Strengths: cost of living A+, housing A+, health & safety A+; Watch: amenities C-, crime F, commute F.
- Washington Local (urban): math 37% / reading 47% proficiency, ranked #528 of 656 in OH (top 80%) — families likely to look elsewhere, expect single-tenant / working-renter base with shorter leases.
- Zoned schools: Mcgregor Elementary School (math 45% / reading 54%, grade D, #906 of 1,584 statewide, top 59%, 421 students, 56% FRL); Whitmer High School (math 38% / reading 48%, grade F, #494 of 781 statewide, top 63%, 2,247 students, 42% FRL) — zoned schools at 49% FRL track the district average.
- Market conditions: 51 active listings in the ZIP; 18 comparable units currently listed for rent nearby; rentals at typical pace (median 23d on market — plan ~3-4 weeks tenant-placement turnaround); 415 units permitted in Lucas County in 2024 (122 in 5+ unit buildings).
Forward outlook
- Local home prices are declining (-3.0%/yr); year-one equity from $691 of loan paydown is wiped out by about $3k of value loss. Plan a longer hold.
- Lucas County population projected at -16% by 2050 — secular population decline; favor cash flow + early exit over multi-decade hold.
Negotiation context
- It's been on market 49 days — a 3% lower offer ($97k) is reasonable based on typical stale-listing flexibility.
- 5 sale attempts since 26y ago; this cycle's ask has dropped $30k (23%) from the opening price — seller is motivated, your offer sets the floor, not the list.
- Current owner paid $36k; list at $100k implies a 176% gain — meaningful room to come down on a strong offer.
Risks & watch-outs
- Watch-outs: built in 1950 — expect roof / HVAC / electrical / plumbing capex.
Questions for the listing agent
- It's been on market 49 days. Have you received any prior offers? Is the seller open to a 3% concession, seller financing, or rate buy-down credit?
- Built in 1950 — when were the roof, HVAC, electrical panel, plumbing, and water heater last replaced?
- Is there a deadline driving the sale (1031 exchange, divorce, estate, relocation)? That informs how much negotiation room exists.
- Schools are D-rated, which usually means shorter tenancies and higher turnover. Who's the typical renter profile here, and what's been the actual vacancy rate?
- Crime grade is F in this area — have there been break-ins, vandalism, or insurance claims at this property in the last 3 years? What carrier currently insures it and at what premium?
- What's the average days-on-market for RENTAL listings here right now (not sales)? A rising rental-DOM trend means longer vacancies and softer asking-rent achievability than the comps imply.
- What's the recent tenant-quality profile in this submarket — average credit score on applications, eviction rate, late-payment / NSF rate, and stable-employment percentage? A property-management company in the area should have these aggregated.
- How much new for-sale + rental construction is in the pipeline within 1–3 miles? Heavy new supply typically softens prices + rents 12–24 months out; constrained supply supports both.
Investment metrics
- 1% rule
- 1.11% ✓
- Cap rate
- 7.76%
- Cash-on-cash
- 5.24%
- DSCR
- 1.23
- GRM
- 7.5
CMA / ARV
- ARV (median comp)
- $173,061
- List price
- $99,900
- Delta
- -42.27%
- Verdict
- UNDERPRICED
- Comps
- 20 within 1.0 mi
Show comp detail 12 sales within ~0.75 mi
| Address | Dist | Beds/Ba | Sqft | Sold | Price | $/sf | Match |
|---|---|---|---|---|---|---|---|
| 5617 Harvest Ln | 0.09mi | 3/1.0 | 1,264 (+7%) | 2mo | $165,000 | $131 | 84 |
| 5319 Lenticel Dr | 0.28mi | 4/1.5 (+1) | 1,224 (+3%) | 3mo | $236,000 | $193 | 72 |
| 3933 Darewood Dr | 0.43mi | 3/1.5 | 1,120 (-6%) | 2mo | $194,900 | $174 | 67 |
| 5718 Rambo Ln | 0.40mi | 2/2.0 (-1) | 1,152 (-3%) | 1mo | $170,000 | $148 | 67 |
| 4210 Stock Ave | 0.65mi | 3/1.5 | 1,152 (-3%) | 1mo | $205,000 | $178 | 62 |
| 3420 Coral Ave | 0.46mi | 3/1.0 | 1,056 (-11%) | 1mo | $193,000 | $183 | 60 |
| 5646 Planet Ave | 0.49mi | 3/2.0 | 1,298 (+9%) | 1mo | $218,900 | $169 | 57 |
| 4929 Luann Ave | 0.72mi | 3/1.0 | 1,107 (-7%) | 1mo | $206,739 | $187 | 55 |
| 5505 Chippewa Rd | 0.71mi | 3/1.0 | 1,280 (+8%) | 1mo | $175,900 | $137 | 53 |
| 5925 Murnen Rd | 0.63mi | 3/1.5 | 1,310 (+10%) | 2mo | $200,000 | $153 | 49 |
| 5505 Gay St | 0.64mi | 3/1.0 | 1,013 (-15%) | 2mo | $175,000 | $173 | 44 |
| 5855 Gany Mede Dr | 0.66mi | 4/2.0 (+1) | 1,328 (+12%) | 2mo | $201,500 | $152 | 39 |
Match score weights: distance 35% · size 25% · config 20% · recency 20%. Top-matched comps best support the ARV.
Projected returns pro-forma
-3.0% appreciation · 3.0% rent growth · sell at horizon
- IRR
- -8.1%
- Equity multiple
- 0.70×
- Total profit
- $-8,358
- Equity at exit
- $14,895
- IRR
- 1.5%
- Equity multiple
- 1.11×
- Total profit
- $2,962
- Equity at exit
- $8,638
Cash invested: $27,972 (down + closing). Projections, not guarantees.
Landlord ↔ Tenant lean methodology
- Overall (STATE)
- 73 Landlord-Friendly
- State Ohio
- 73 Landlord-Friendly · R+6
- County
- — inherits STATE
- City
- — inherits STATE
ZIP-level market 43623
- Home prices YoY
- -19.8%
- Active inventory
- 51
- Price-to-rent
- 7.5×
Monthly cashflow live
- Estimated rent
- $1,111 high interval (Pro) →
- Mortgage (P&I)
- −$524
- Tax from tax record
- −$190 /mo · $2,279/yr
- Insurance
- −$42
- HOA
- −$0
- Vacancy / Maint / Mgmt
- −$233
- Net cashflow
- $122
Break-even live
Sensitivity live
| Price | -10% $179 | -5% $150 | +0% $122 | +5% $94 | +10% $65 |
|---|---|---|---|---|---|
| Rent | -10% $34 | -5% $78 | +0% $122 | +5% $166 | +10% $210 |
| Rate | -1.0pp $172 | -0.5pp $147 | base $122 | +0.5pp $96 | +1.0pp $70 |
UW: 25.0% down · 7.5% · 30yr · 1.5% tax · 5.0% vac · 8.0% maint · 8.0% mgmt
Financing live
Cash to close
- Down payment
- $24,975
- Closing costs
- $2,997
- Reserves months
- —
- Total cash needed
- —
Loan-product check · same deal, 3 products live
Conventional
25% down · 7.5% · 30yr
- Down + closing
- —
- Monthly P&I
- —
- Monthly cashflow
- —
- DSCR
- —
- Eligible?
- —
Personal DTI + credit; lowest rate.
DSCR
20% down · 8.5% · 30yr
- Down + closing
- —
- Monthly P&I
- —
- Monthly cashflow
- —
- DSCR
- —
- Eligible?
- —
No personal income docs; deal must DSCR.
Hard money
10% down · 12.0% · 12mo
- Down + closing
- —
- Monthly P&I
- —
- Monthly cashflow
- —
- DSCR
- —
- Eligible?
- —
Short-term bridge; refi at stabilization.
Rent comps 18 comps
| Address | Beds | Baths | Sqft | Rent | $/sqft | DOM | Units | Dist |
|---|---|---|---|---|---|---|---|---|
| 3907 Donegal Dr Toledo, OH | 4.0 | 2.0 | 1152 | $1,295 | $1.12 | 25d | 1 | 0.36mi |
| 5240 Oakridge Dr Toledo, OH | 2.0 | 1.0 | 872 | $945 | $1.08 | 16d | 1 | 0.53mi |
| 3355 W Alexis Rd Toledo, OH | 2.0 | 1.0 | 675 | $809 | $1.20 | 16d | 3 | 0.55mi |
| 5635 Secor Rd Toledo, OH | 2.0 | 1.0 | 800 | $858 | $1.07 | 45d | 1 | 0.57mi |
| 5747 Talmadge Rd Toledo, OH | 1.0–2.0 | 1.0 | 647 | $919 | $1.42 | 16d | 1 | 0.61mi |
| 5831 Gany Mede Dr Toledo, OH | 3.0 | 1.0 | 1004 | $1,600 | $1.59 | 16d | 1 | 0.62mi |
| 5360 Secor Rd Unit 316 Toledo, OH | 2.0 | 1.0 | 900 | $699 | $0.78 | 25d | 1 | 0.64mi |
| 6022 Clover Ln Toledo, OH | 3.0 | 2.0 | 1296 | $1,750 | $1.35 | 23d | 1 | 0.67mi |
| 5133 Secor Rd Toledo, OH | 2.0 | 2.0 | 850 | $1,099 | $1.29 | 25d | 1 | 0.69mi |
| 5080 Secor Rd Toledo, OH | 1.0–2.0 | 1.0–1.5 | 699 | $925 | $1.32 | 45d | 1 | 0.81mi |
| 3355 W Laskey Rd Toledo, OH | 2.0 | 1.0 | 750 | $850 | $1.13 | 16d | 2 | 0.83mi |
| 3355 W Laskey Rd Apt 24 Toledo, OH | 2.0 | 1.0 | 750 | $850 | $1.13 | 25d | 1 | 0.83mi |
| 3353 W Laskey Rd Unit 2 Toledo, OH | 3.0 | 1.0 | 750 | $850 | $1.13 | 23d | 1 | 0.85mi |
| 6020 Secor Rd Unit 1 Toledo, OH | 2.0 | 1.5 | 760 | $825 | $1.09 | 23d | 1 | 0.85mi |
| 3065 Tremainsville Rd Toledo, OH | 1.0–2.0 | 1.0 | 800 | $929 | $1.16 | 16d | 1 | 0.86mi |
| 3145 Brock Dr Toledo, OH | 3.0 | 2.0 | 1100 | $1,600 | $1.45 | 16d | 1 | 1.06mi |
| 4668 Talmadge Rd Toledo, OH | 1.0–2.0 | 1.0 | 820 | $1,079 | $1.32 | 16d | 1 | 1.15mi |
| 5360 Monroe St Toledo, OH | 1.0–2.0 | 1.0 | 729 | $900 | $1.23 | 45d | 1 | 1.43mi |
Listing history 13 events
-
2026-05-02price $99,900 37-char remark
Show marketing remark (37 chars)
NEW ROOF MANY UPDATES MUST SEE INSIDE
-
2026-04-23status Active 37-char remark
Show marketing remark (37 chars)
NEW ROOF MANY UPDATES MUST SEE INSIDE
-
2026-04-16status Pending 37-char remark
Show marketing remark (37 chars)
NEW ROOF MANY UPDATES MUST SEE INSIDE
-
2026-04-09price $109,900 37-char remark
Show marketing remark (37 chars)
NEW ROOF MANY UPDATES MUST SEE INSIDE
-
2026-03-20$129,900 Active 37-char remark
Show marketing remark (37 chars)
NEW ROOF MANY UPDATES MUST SEE INSIDE
-
2017-06-30historical
-
2017-02-07$69,900
-
2017-02-06historical
-
2016-12-28$74,900
-
2001-08-11historical
-
2000-11-19$64,900
-
1994-09-06soldstatus $36,225
-
1990-10-22soldstatus $26,300
ⓘ Source: listings_history table (triggers on properties + properties_extension) + one-shot
backfill from property_details.listing_events for pre-trigger history.
Tax reassessment forecast OH · Partial reset (capped growth)
- Current annual tax
- $2,279 · $190/mo
- Projected year-2 tax
- $2,279 · $190/mo
- Expected delta
- $0/yr ($0/mo · 0.0%)
ⓘ Screening estimate from a state-policy table — verify with the county assessor before closing.
Climate risk First Street
- Flood 1/10 Low FEMA zone X (unshaded) · 0% chance over 30 yrs
- Wildfire 1/10 Low
- Heat 3/10 Moderate 7 d/yr ≥101°F today · 16 d/yr by 30 yrs out
- Wind 2/10 Low
- Air quality 2/10 Low 1 unhealthy d/yr today · 3 by 30 yrs out
Nearby sold comps map
Loading sold comps map…
Walkable amenities ~0.75 mi
Loading nearby amenities…
Taxation est. · year 1
- Rental income
- $13,328
- − Mortgage interest
- −$5,596
- − Property taxes
- −$2,279
- − Insurance
- −$500
- − Repairs & maintenance
- −$1,066
- − Management
- −$1,066
- − Depreciation
- −$2,906
- Taxable loss
- −$85
- Est. tax savings @ 24.0%
- +$20
- After-tax cash flow
- $1,485/yr
For passive investors: Depreciation is non-cash, so a rental often shows a tax loss while cash-flowing — sheltering income. Rental losses are passive: they offset passive income freely, and up to $25,000/yr can offset ordinary (W-2) income if you actively participate and your MAGI is under $100k (phasing out to $0 by $150k); unused losses carry forward. On sale, claimed depreciation is recaptured at up to 25%, and gains may owe capital-gains tax (a 1031 exchange can defer both). Figures are a year-1 estimate at your 24.0% rate — not tax advice; consult a CPA.
Schools (NCES district)
- District
- Washington Local
- NCES district ID
- 3904823
- Math proficiency
- 37% ▼ -20.00%
- Reading proficiency
- 47% ▼ -11.00%
- Median HH income
- $42,105
- Composite
- 35.36/100
- National rank
- #4957
- State rank
- #528 of 656 in OH
Livability — Toledo
- Score
- 66/100
- State rank
- #645
- US rank
- #11442
Category grades
Schools grade is shown separately in the Schools card above.
Census & demographics
- Census place
- Toledo, OH
- County
- Lucas County · 380,724 people
- City population
- 280,811
- Metro
- Toledo, OH
- Population (ZIP)
- 20,267
- Household income
- $71,171
- Rent vs Own
- Severe rent burden
- 617.0
Population outlook (Lucas County) Hauer SSP2
- Today (2025)
- 420,751 people
- By 2030
- 410,187 · -2.5%
- By 2040
- 384,019 · -8.7%
- By 2050
- 355,125 · -15.6%
- By 2075
- 291,683 · -30.7%
- By 2100
- 233,670 · -44.5%
Race, ethnicity, and origin ACS 2023
- Neighborhood character
- Predominantly White (79%)
- Race & ethnicity
- White 79% Hispanic / Latino 8% Two or more races 7% Black 5% Asian 2%
- Hispanic origin (detail)
- Mexican 6% Puerto Rican 1%
- Common ancestry
- Romanian 11% Lithuanian 5% Slovak 3%
- Foreign-born
- 5% · Canada, China
- Languages at home
- 90% English-only · Arabic 4% Spanish 2% Other Indo-European 1%
Political lean MEDSL · Lucas
- 2024 margin
- D (+12.6) · D 55.8% · R 43.2%
- 2008→2024 swing
- -18.9pp toward R · 2008: 31.4pp · 2024: 12.6pp
- All cycles
- 2024: D+12.6 2020: D+16.8 2016: D+17.4 2012: D+30.4 2008: D+31.4
Not yet ingested
- Civics
- —
Market trends
- HPI YoY
- ▼ -51.92%
- Current HPI
- 209.8555
- Rent YoY
- —
- Metro
- Toledo, OH
- State GDP YoY
- ▲ 1.98%
- F500 in state
- 48
Industry mix (Fortune 500 HQ in OH)
| Industry | F500 HQs | Revenue |
|---|---|---|
| Insurance | 3 | $145B |
|
||
| Industrial Machinery | 3 | $49B |
|
||
| Financial Services | 3 | $24B |
|
||
| Consumer Goods | 2 | $93B |
|
||
| Aerospace / Defense | 2 | $47B |
|
||
| Utilities | 2 | $33B |
|
||
Price history
+279.8% since first listed13 events — show timeline
- 2026-05-02 Price Changed $99,900 NORIS
- 2026-04-23 Relisted — NORIS
- 2026-04-16 Pending — NORIS
- 2026-04-09 Price Changed $109,900 NORIS
- 2026-03-20 Listed $129,900 NORIS
- 2017-06-30 Listing Removed — NORIS
- 2017-02-07 Listed $69,900 NORIS
- 2017-02-06 Listing Removed — NORIS
- 2016-12-28 Listed $74,900 NORIS
- 2001-08-11 Listing Removed — NORIS
- 2000-11-19 Listed $64,900 NORIS
- 1994-09-06 Sold (Public Records) $36,225 Public Records
- 1990-10-22 Sold (Public Records) $26,300 Public Records
Property tax history
+3.3%/yrLatest (2025): $2,279 · +1.5% YoY. Source: county tax records.
Cash-flow waterfall
monthlySold comps — $/sqft
last 12 mo · ≤1 miLoading sold comps…