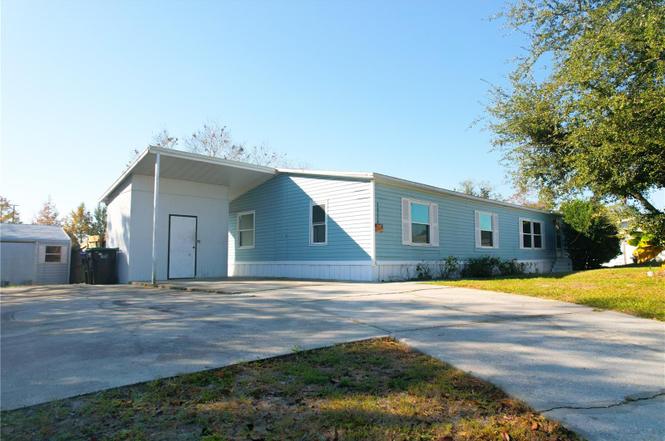
14774 Congress St · Alafaya, FL
Flood risk 1/10 · Minimal
- FEMA flood zone
- X (unshaded)
- Chance of flooding over 30 yrs
- 0.0%
- Est. flood insurance / yr
- $507 – $1,088
Fire risk 4/10 · Minor
- Est. fire insurance / yr
- $947 – $1,759
Heat risk 9/10 · Severe
- Hot days now (above 107°F)
- 7 days/yr
- Hot days in 30 yrs
- 22 days/yr
Wind risk 10/10 · Severe
- Chance of severe wind over 30 yrs
- 99.0%
Air-quality risk 2/10 · Minimal
- Unhealthy air days now
- 2 days/yr
- Unhealthy air days in 30 yrs
- 2 days/yr
Risk factors via First Street. Map © Google.
Why this score? — see what drove the D grade
The composite is a weighted blend of 9 inputs, each scored 0–100. Each bar is that input's sub-score; the figure is the points it added to the 100-point composite (weight × sub-score).
- Cash flow +15.2/30.0
- ARV discount +7.5/15.0
- DSCR +4.7/10.0
- Schools +4.1/10.0
- Livability +4.1/5.0
- 1% rule +3.7/10.0
- Condition / age +2.5/5.0
- Rent growth +1.5/5.0
- Appreciation +0.0/10.0
$299,000
🖨 Deal sheet (PDF) 📄 Offer letter ✓ Due diligence
Listing remarks
Great opportunity in the Alafaya area! Spacious 4/2 manufactured home with 1,782 sq ft on a 0.25-acre lot and no HOA, offering excellent flexibility and value-add potential. Open floor plan, ceramic/laminate flooring, eat-in kitchen, central AC and a 4-car carport. Strong value for size and location.
Key facts
- Ceramic flooring
- Open floor plan
- Laminate flooring
Tags
Property features AI
Finance
- Other: Property type: Residential; Property sub-type: Manufactured Home; Total living area about 1,782 square feet; Lot size about 0.25 acre; Road surface: Asphalt; One well and one septic on property; Zoning: R-T-1
- Financial info: Lease restrictions: none indicated
- HOA & community: No HOA (association not present)
Exterior
- Parking: Carport with 2 spaces
- Utilities: Public water; Septic tank; Broadband/High-speed internet available; Cable connected; Electricity available and connected; Fiber optics; Water connected
- Home design: Manufactured double-wide home; One story; North-facing
- Construction: Vinyl siding with frame construction; Shingle roof; Crawlspace foundation; Built as a manufactured home
- Exterior features: Sidewalk; Storage
Interior
- Kitchen: Dishwasher; Microwave; Range; Refrigerator
- Bedrooms: 4 bedrooms
- Flooring: Ceramic tile; Laminate
- Bathrooms: 2 full bathrooms
- Heating & cooling: Central heating; Heat pump; Central air conditioning
- Interior features: Ceiling fans; Eat-in kitchen; Living room / dining room combo; Open floorplan; Solid surface counters; Solid wood cabinets; Thermostat; Walk-in closets
- Laundry & utility: Inside laundry room
Neighborhood map
What this means for you Summary
Snapshot
- This is a 4-bed/2.0-bath manufactured listed at $299k.
Deal economics
- At list price, monthly cash flow is $102 ($1k/yr) — positive.
- The deal already cash-flows at list — no discount required.
- To meet the 1% rule (rent ≥ 1% of price), the offer needs to be $260k (13.0% below list).
- Recommended offer: $260k (13.0% below list) — sets the bar for 1% rule.
- Cap rate 6.7% vs local median 3.4% in Alafaya — top-decile yield for the area; either an underpriced asset or a hidden risk that comps aren't pricing in. Stress-test before assuming the spread holds.
Location & tenants
- Location reads 82/100 on livability (#60 in FL, #1,076 nationally) — a professional / high-income tenant draw. Strengths: housing A+, health & safety A+, crime A; Watch: cost of living C-.
- Orange (suburban): math 46% / reading 51% proficiency, ranked #43 of 73 in FL (top 59%) — families likely to look elsewhere, expect single-tenant / working-renter base with shorter leases.
- Zoned schools: Bonneville Elementary (math 46% / reading 42%, grade F, #1,330 of 2,144 statewide, top 63%, 430 students, 66% FRL); Corner Lake Middle (math 42% / reading 47%, grade D, #320 of 571 statewide, top 57%, 841 students, 54% FRL); East River High (math 27% / reading 47%, grade F, #340 of 667 statewide, top 52%, 2,050 students, 45% FRL) — zoned schools at 55% FRL track the district average.
- Market conditions: Rents falling (-4.0%/yr); 105 active listings in the ZIP; 11 comparable units currently listed for rent nearby; rentals leasing fast (median 10d on market — plan ~1-2 weeks tenant-placement turnaround); 8,053 units permitted in Orange County in 2024 (3,133 in 5+ unit buildings).
- At $2,602/mo this rent would consume 48% of the median local household income ($65k/yr) (locally 1705% of renters already pay >50% of income on rent) — very limited rent-growth headroom before tenants either downsize or default.
Forward outlook
- Local home prices are declining (-3.0%/yr); year-one equity from $2k of loan paydown is wiped out by about $9k of value loss. Plan a longer hold.
- Orange County population projected at +52% by 2050 — long-run rental-demand tailwind backs the buy-and-hold thesis.
Negotiation context
- It's been on market 205 days — a 12% lower offer ($263k) is reasonable based on typical stale-listing flexibility.
- 13 sale attempts since 13y ago; this cycle's ask has dropped $26k (8%) from the opening price — seller is motivated, your offer sets the floor, not the list.
- Current owner paid $185k; list at $299k implies a 62% gain — meaningful room to come down on a strong offer.
Risks & watch-outs
- Climate carrying-cost: severe wind risk, 99% chance of damaging wind over 30y; extreme-heat days projected 7→22/yr by 2055 (HVAC capex compounding) — expect insurance premiums to compound above CPI over the hold.
Questions for the listing agent
- It's been on market 205 days. Have you received any prior offers? Is the seller open to a 13% concession, seller financing, or rate buy-down credit?
- Why hasn't it sold? Are there any deal-killer items the seller is aware of (foundation, flood, title, zoning, code violations)?
- Is there a deadline driving the sale (1031 exchange, divorce, estate, relocation)? That informs how much negotiation room exists.
- Schools are D-rated, which usually means shorter tenancies and higher turnover. Who's the typical renter profile here, and what's been the actual vacancy rate?
- The area grade is low — what's the realistic commute time and amenity access for the typical tenant pool here? Any planned neighborhood developments (good or bad) we should know about?
- What's the average days-on-market for RENTAL listings here right now (not sales)? A rising rental-DOM trend means longer vacancies and softer asking-rent achievability than the comps imply.
- What's the recent tenant-quality profile in this submarket — average credit score on applications, eviction rate, late-payment / NSF rate, and stable-employment percentage? A property-management company in the area should have these aggregated.
- How much new for-sale + rental construction is in the pipeline within 1–3 miles? Heavy new supply typically softens prices + rents 12–24 months out; constrained supply supports both.
Investment metrics
- 1% rule
- 0.87% ✗
- Cap rate
- 6.70%
- Cash-on-cash
- 1.46%
- DSCR
- 1.07
- GRM
- 9.6
CMA / ARV
No comps found within radius.
Projected returns pro-forma
-3.0% appreciation · 0.0% rent growth · sell at horizon
- IRR
- -17.2%
- Equity multiple
- 0.41×
- Total profit
- $-49,605
- Equity at exit
- $44,582
- IRR
- -15.7%
- Equity multiple
- 0.23×
- Total profit
- $-64,414
- Equity at exit
- $25,852
Cash invested: $83,720 (down + closing). Projections, not guarantees.
Landlord ↔ Tenant lean methodology
- Overall (STATE)
- 87 Strongly Landlord-Friendly
- State Florida
- 87 Strongly Landlord-Friendly · R+3
- County
- — inherits STATE
- City
- — inherits STATE
ZIP-level market 32826
- Home prices YoY
- -17.0%
- Rents YoY
- -4.0%
- Active inventory
- 105
- Price-to-rent
- 9.6×
Monthly cashflow live
- Estimated rent
- $2,602 high interval (Pro) →
- Mortgage (P&I)
- −$1,568
- Tax from tax record
- −$261 /mo · $3,130/yr
- Insurance
- −$125
- HOA
- −$0
- Vacancy / Maint / Mgmt
- −$546
- Net cashflow
- $102
Break-even live
Sensitivity live
| Price | -10% $271 | -5% $187 | +0% $102 | +5% $17 | +10% $-67 |
|---|---|---|---|---|---|
| Rent | -10% $-103 | -5% $-1 | +0% $102 | +5% $205 | +10% $308 |
| Rate | -1.0pp $253 | -0.5pp $178 | base $102 | +0.5pp $25 | +1.0pp $-54 |
UW: 25.0% down · 7.5% · 30yr · 1.5% tax · 5.0% vac · 8.0% maint · 8.0% mgmt
Financing live
Cash to close
- Down payment
- $74,750
- Closing costs
- $8,970
- Reserves months
- —
- Total cash needed
- —
Loan-product check · same deal, 3 products live
Conventional
25% down · 7.5% · 30yr
- Down + closing
- —
- Monthly P&I
- —
- Monthly cashflow
- —
- DSCR
- —
- Eligible?
- —
Personal DTI + credit; lowest rate.
DSCR
20% down · 8.5% · 30yr
- Down + closing
- —
- Monthly P&I
- —
- Monthly cashflow
- —
- DSCR
- —
- Eligible?
- —
No personal income docs; deal must DSCR.
Hard money
10% down · 12.0% · 12mo
- Down + closing
- —
- Monthly P&I
- —
- Monthly cashflow
- —
- DSCR
- —
- Eligible?
- —
Short-term bridge; refi at stabilization.
Rent comps 11 comps
| Address | Beds | Baths | Sqft | Rent | $/sqft | DOM | Units | Dist |
|---|---|---|---|---|---|---|---|---|
| 14630 Lady Victoria Blvd Orlando, FL | 4.0 | 2.0 | 1988 | $2,695 | $1.36 | 4d | 1 | 0.22mi |
| 1911 Colonial Woods Blvd Orlando, FL | 3.0 | 2.0 | 1480 | $2,100 | $1.42 | 25d | 1 | 0.62mi |
| 525 Loyola Cir Orlando, FL | 1.0–3.0 | 1.0–3.0 | 1400 | $2,953 | $2.11 | 0d | 45 | 0.65mi |
| 15634 Perdido Dr Orlando, FL | 3.0 | 2.0 | 1692 | $2,450 | $1.45 | 19d | 1 | 0.75mi |
| 11950 Sands Cv Orlando, FL | 3.0 | 2.5 | 1842 | $2,499 | $1.36 | 0d | 1 | 1.12mi |
| 2645 Talladega Dr Orlando, FL | 3.0 | 2.0 | 1236 | $2,281 | $1.85 | 16d | 1 | 1.25mi |
| 12949 Odyssey Lake Way Orlando, FL | 3.0 | 2.0 | 1303 | $2,100 | $1.61 | 9d | 1 | 1.29mi |
| 12912 Odyssey Lake Way Orlando, FL | 4.0 | 2.0 | 1392 | $2,399 | $1.72 | 6d | 1 | 1.32mi |
| 14050 Ithaca Way Orlando, FL | 3.0 | 2.0 | 1228 | $2,115 | $1.72 | 9d | 1 | 1.32mi |
| 13521 Old Dock Rd Orlando, FL | 4.0 | 3.0 | 2457 | $2,799 | $1.14 | 25d | 1 | 1.34mi |
| 13448 Old Dock Rd Orlando, FL | 4.0 | 3.0 | 2444 | $2,795 | $1.14 | 25d | 1 | 1.40mi |
Listing history 15 events
-
2026-06-21days on market $299,000 Active 205 DOM
-
2026-06-18days on market $299,000 Active 202 DOM
-
2026-06-17days on market $299,000 Active 201 DOM
-
2026-06-16days on market $299,000 Active 200 DOM
-
2026-06-15days on market $299,000 Active 199 DOM
-
2026-06-13days on market $299,000 Active 197 DOM
-
2026-06-13days on market $299,000 Active 196 DOM
-
2026-06-09days on market $299,000 Active 193 DOM
-
2026-06-08days on market $299,000 Active 192 DOM
-
2026-06-07days on market $299,000 Active 191 DOM
-
2026-06-04days on market $299,000 Active 188 DOM
-
2026-06-03days on market $299,000 Active 187 DOM
-
2026-06-02days on market $299,000 Active 186 DOM
-
2026-06-02days on market $299,000 Active 185 DOM
-
2026-05-31days on market $299,000 Active 184 DOM
ⓘ Source: listings_history table (triggers on properties + properties_extension) + one-shot
backfill from property_details.listing_events for pre-trigger history.
Tax reassessment forecast FL · Resets to sale price
- Current annual tax
- $3,130 · $261/mo
- Projected year-2 tax
- $3,130 · $261/mo
- Expected delta
- $0/yr ($0/mo · 0.0%)
ⓘ Screening estimate from a state-policy table — verify with the county assessor before closing.
Climate risk First Street
- Flood 1/10 Low FEMA zone X (unshaded) · 0% chance over 30 yrs
- Wildfire 4/10 Moderate
- Heat 9/10 Extreme 7 d/yr ≥107°F today · 22 d/yr by 30 yrs out
- Wind 10/10 Extreme 99% chance of damaging wind over 30 yrs
- Air quality 2/10 Low 2 unhealthy d/yr today · 2 by 30 yrs out
Nearby sold comps map
Loading sold comps map…
Walkable amenities ~0.75 mi
Loading nearby amenities…
Taxation est. · year 1
- Rental income
- $31,223
- − Mortgage interest
- −$16,749
- − Property taxes
- −$3,130
- − Insurance
- −$1,495
- − Repairs & maintenance
- −$2,498
- − Management
- −$2,498
- − Depreciation
- −$8,698
- Taxable loss
- −$3,845
- Est. tax savings @ 24.0%
- +$923
- After-tax cash flow
- $2,148/yr
For passive investors: Depreciation is non-cash, so a rental often shows a tax loss while cash-flowing — sheltering income. Rental losses are passive: they offset passive income freely, and up to $25,000/yr can offset ordinary (W-2) income if you actively participate and your MAGI is under $100k (phasing out to $0 by $150k); unused losses carry forward. On sale, claimed depreciation is recaptured at up to 25%, and gains may owe capital-gains tax (a 1031 exchange can defer both). Figures are a year-1 estimate at your 24.0% rate — not tax advice; consult a CPA.
Schools (NCES district)
- District
- Orange
- NCES district ID
- 1201440
- Math proficiency
- 46% ▼ -9.00%
- Reading proficiency
- 51% ▼ -2.00%
- Median HH income
- $49,350
- Composite
- 41.47/100
- National rank
- #3461
- State rank
- #43 of 73 in FL
Livability — Alafaya
- Score
- 82/100
- State rank
- #60
- US rank
- #1076
Category grades
Schools grade is shown separately in the Schools card above.
Census & demographics
- County
- Orange County · 1,471,359 people
- City population
- 131,972
- Metro
- Orlando-Kissimmee-Sanford, FL
- Population (ZIP)
- 29,006
- Household income
- $64,755
- Rent vs Own
- Severe rent burden
- 1705.0
Population outlook (Orange County) Hauer SSP2
- Today (2025)
- 1,618,226 people
- By 2030
- 1,787,404 · +10.5%
- By 2040
- 2,125,621 · +31.4%
- By 2050
- 2,454,016 · +51.6%
- By 2075
- 3,173,711 · +96.1%
- By 2100
- 3,607,781 · +122.9%
Race, ethnicity, and origin ACS 2023
- Neighborhood character
- Diverse neighborhood (Simpson 0.64)
- Race & ethnicity
- White 48% Hispanic / Latino 34% Two or more races 19% Black 9% Asian 4%
- Hispanic origin (detail)
- Mexican 3% Puerto Rican 16% Cuban 6% Dominican 1%
- Common ancestry
- Romanian 2% Slovak 1% Serbian 1%
- Foreign-born
- 15% · Canada
- Languages at home
- 70% English-only · Spanish 22% Other Indo-European 3% Other Asian/Pacific 1%
Political lean MEDSL · Orange
- 2024 margin
- D (+13.6) · D 56.1% · R 42.5% · Other 1.3%
- 2008→2024 swing
- -5.0pp toward R · 2008: 18.6pp · 2024: 13.6pp
- All cycles
- 2024: D+13.6 2020: D+23.1 2016: D+24.6 2012: D+18.2 2008: D+18.6
Not yet ingested
- Civics
- —
Market trends
- HPI YoY
- ▼ -65.30%
- Current HPI
- 318.563
- Rent YoY
- ▼ -4.05%
- Metro
- Orlando-Kissimmee-Sanford, FL
- State GDP YoY
- ▲ 3.28%
- F500 in state
- 36
Industry mix (Fortune 500 HQ in FL)
| Industry | F500 HQs | Revenue |
|---|---|---|
| Industrial Technology | 2 | $29B |
|
||
| Insurance | 2 | $17B |
|
||
| Retail | 1 | $60B |
|
||
| Technology Distribution | 1 | $58B |
|
||
| Homebuilding | 1 | $35B |
|
||
| Technology Manufacturing | 1 | $35B |
|
||
Price history
+1516.2% since first listed33 events — show timeline
- 2026-05-28 Relisted — Stellar MLS as Distributed by MLS Grid
- 2026-05-22 Listing Removed — Stellar MLS as Distributed by MLS Grid
- 2026-03-20 Price Changed $299,000 Stellar MLS as Distributed by MLS Grid
- 2025-11-22 Listed $324,900 Stellar MLS as Distributed by MLS Grid
- 2025-09-24 Listing Removed — Stellar MLS as Distributed by MLS Grid
- 2025-07-15 Listed $295,000 Stellar MLS as Distributed by MLS Grid
- 2023-12-08 Listing Removed — Stellar MLS as Distributed by MLS Grid
- 2023-11-06 Listed $300,000 Stellar MLS as Distributed by MLS Grid
- 2020-09-23 Sold (Public Records) $185,000 Public Records
- 2020-09-10 Sold (MLS) $185,000 Stellar MLS as Distributed by MLS Grid
- 2020-08-18 Pending — Stellar MLS as Distributed by MLS Grid
- 2020-08-11 Relisted — Stellar MLS as Distributed by MLS Grid
- 2020-07-01 Pending — Stellar MLS as Distributed by MLS Grid
- 2020-07-01 Relisted — Stellar MLS as Distributed by MLS Grid
- 2020-06-10 Pending — Stellar MLS as Distributed by MLS Grid
- 2020-06-04 Relisted — Stellar MLS as Distributed by MLS Grid
- 2020-05-25 Pending — Stellar MLS as Distributed by MLS Grid
- 2020-03-24 Relisted — Stellar MLS as Distributed by MLS Grid
- 2020-02-28 Pending — Stellar MLS as Distributed by MLS Grid
- 2020-02-19 Relisted — Stellar MLS as Distributed by MLS Grid
- 2020-01-22 Pending — Stellar MLS as Distributed by MLS Grid
- 2019-12-10 Relisted — Stellar MLS as Distributed by MLS Grid
- 2019-11-14 Pending — Stellar MLS as Distributed by MLS Grid
- 2019-10-27 Listed $189,000 Stellar MLS as Distributed by MLS Grid
- 2019-08-13 Sold (Public Records) $130,000 Public Records
- 2019-08-12 Sold (MLS) $130,000 Stellar MLS as Distributed by MLS Grid
- 2019-07-10 Pending — Stellar MLS as Distributed by MLS Grid
- 2019-07-03 Listed $130,000 Stellar MLS as Distributed by MLS Grid
- 2013-09-16 Sold (Public Records) $55,000 Public Records
- 2013-09-11 Sold (MLS) $55,000 Stellar MLS as Distributed by MLS Grid
- 2013-04-01 Listed $64,900 Stellar MLS as Distributed by MLS Grid
- 2003-01-16 Sold (Public Records) $77,000 Public Records
- 1991-01-30 Sold (Public Records) $18,500 Public Records
Property tax history
+9.4%/yrLatest (2025): $3,130 · +9.4% YoY. Source: county tax records.
Cash-flow waterfall
monthlySold comps — $/sqft
last 12 mo · ≤1 miLoading sold comps…