 Multi-family
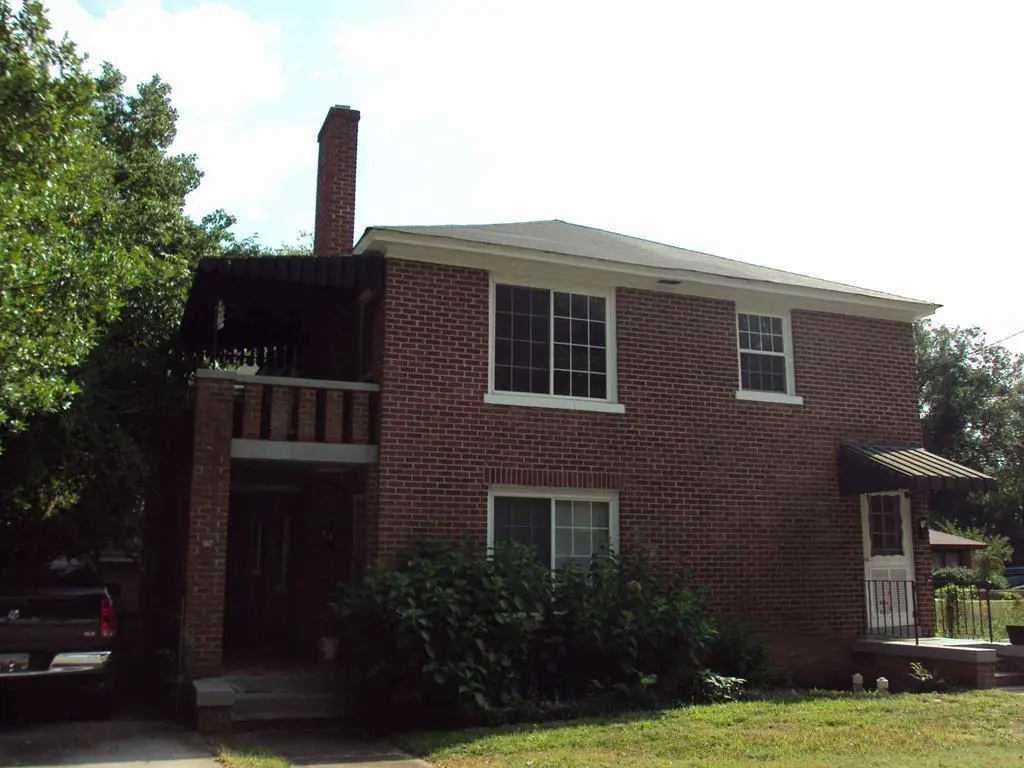
416(418) Cothran Ave · Greenwood, SC
Flood risk 1/10 · Minimal
- FEMA flood zone
- X (unshaded)
- Chance of flooding over 30 yrs
- 0.0%
- Est. flood insurance / yr
- $507 – $1,088
Fire risk 3/10 · Minor
- Est. fire insurance / yr
- $783 – $1,453
Heat risk 6/10 · Moderate
- Hot days now (above 105°F)
- 7 days/yr
- Hot days in 30 yrs
- 17 days/yr
Wind risk 6/10 · Moderate
- Chance of severe wind over 30 yrs
- 27.0%
Air-quality risk 4/10 · Minor
- Unhealthy air days now
- 4 days/yr
- Unhealthy air days in 30 yrs
- 4 days/yr
Risk factors via First Street. Map © Google.
Why this score? — see what drove the C grade
The composite is a weighted blend of 9 inputs, each scored 0–100. Each bar is that input's sub-score; the figure is the points it added to the 100-point composite (weight × sub-score).
- Cash flow +25.0/30.0
- DSCR +8.2/10.0
- ARV discount +7.5/15.0
- 1% rule +6.3/10.0
- Livability +3.2/5.0
- Schools +2.9/10.0
- Rent growth +2.5/5.0
- Condition / age +2.5/5.0
- Appreciation +0.0/10.0
$310,000
🖨 Deal sheet (PDF) 📄 Offer letter ✓ Due diligence
Multi-family units
County records classify this as Multi-Family (2-4 Unit). Listing-text estimate: 1 unit. estimate disagrees with records
Listing remarks MLS
Do not miss this rare opportunity to own a beautifully remodeled duplex, right in the heart of Greenwood just off Grace Street. Each unit is 3 bedroom 1 bath, one upstairs and one downstairs. A buyer could live in one unit and rent out the other, or rent out both. Local lenders have qualified this property to be purchased on a residential mortgage, even with the rental scenario. Call today for more info!
Key facts
- Brick duplex
- Separate entrances
- Parking
Tags
Property features AI
Exterior
- Parking: 1-car garage
- Utilities: Sewer connected
- Home design: Single-family detached residence; Residential property
- Construction: Brick construction
- Exterior features: Chain link fencing; Level lot
Interior
- Flooring: Hardwood
- Bathrooms: 2 full bathrooms
- Heating & cooling: Central air conditioning (electric); Electric heating
- Interior features: Hardwood floors
Neighborhood map
What this means for you Summary
Snapshot
- This is a 6-bed/2.0-bath multifamily listed at $310k.
Deal economics
- At list price, monthly cash flow is $676 ($8k/yr) — positive.
- The deal already cash-flows at list — no discount required.
- Meets the 1% rule at list price ($4k rent vs $310k).
- Recommended offer: $305k (1.5% below list) — sets the bar for market timing.
- Cap rate 8.9% vs local median 3.6% in Greenwood — top-decile yield for the area; either an underpriced asset or a hidden risk that comps aren't pricing in. Stress-test before assuming the spread holds.
Location & tenants
- Location reads 63/100 on livability (#167 in SC) — a middle-class / working-renter tenant base. Strengths: cost of living A+, health & safety A+, housing A; Watch: amenities D, schools F, crime F.
- Greenwood 50 (town): math 31% / reading 39% proficiency, ranked #43 of 80 in SC (top 54%) — families likely to look elsewhere, expect single-tenant / working-renter base with shorter leases.
- Market conditions: 253 active listings in the ZIP; 193 units permitted in Greenwood County in 2024 (0 in 5+ unit buildings).
- At $3,518/mo this rent would consume 77% of the median local household income ($55k/yr) (locally 566% of renters already pay >50% of income on rent) — very limited rent-growth headroom before tenants either downsize or default.
Forward outlook
- Local home prices are declining (-3.0%/yr); year-one equity from $2k of loan paydown is wiped out by about $9k of value loss. Plan a longer hold.
- Greenwood County population projected to shrink 8% by 2050 — rents likely to lag national; underwrite the cash flow, not the appreciation.
Negotiation context
- It's been on market 15 days — a 2% lower offer ($305k) is reasonable based on typical stale-listing flexibility.
- 2 sale attempts since 5y ago with the ask held roughly flat each time — persistent listings suggest the price (not the market) is what's stuck; bring a comps-based counter.
- Current owner paid $267k; 16% above their basis — modest negotiation headroom, anchor on the comps not their cost.
Risks & watch-outs
- Watch-outs: built in 1950 — expect roof / HVAC / electrical / plumbing capex.
- Climate carrying-cost: major wind risk, 27% chance of damaging wind over 30y; extreme-heat days projected 7→17/yr by 2055 (HVAC capex compounding) — expect insurance premiums to compound above CPI over the hold.
Questions for the listing agent
- Built in 1950 — when were the roof, HVAC, electrical panel, plumbing, and water heater last replaced?
- Is there a deadline driving the sale (1031 exchange, divorce, estate, relocation)? That informs how much negotiation room exists.
- Schools are F-rated, which usually means shorter tenancies and higher turnover. Who's the typical renter profile here, and what's been the actual vacancy rate?
- Crime grade is F in this area — have there been break-ins, vandalism, or insurance claims at this property in the last 3 years? What carrier currently insures it and at what premium?
- What's the average days-on-market for RENTAL listings here right now (not sales)? A rising rental-DOM trend means longer vacancies and softer asking-rent achievability than the comps imply.
- What's the recent tenant-quality profile in this submarket — average credit score on applications, eviction rate, late-payment / NSF rate, and stable-employment percentage? A property-management company in the area should have these aggregated.
- How much new apartment / multifamily construction is in the pipeline within 1–3 miles? Heavy new supply (>2% of stock underway) typically softens rents 12–24 months out; light construction supports rent growth.
Investment metrics
- 1% rule
- 1.13% ✓
- Cap rate
- 8.91%
- Cash-on-cash
- 9.34%
- DSCR
- 1.42
- GRM
- 7.3
CMA / ARV
No comps found within radius.
Projected returns pro-forma
-3.0% appreciation · 3.0% rent growth · sell at horizon
- IRR
- -2.2%
- Equity multiple
- 0.92×
- Total profit
- $-7,159
- Equity at exit
- $46,222
- IRR
- 7.5%
- Equity multiple
- 1.57×
- Total profit
- $49,311
- Equity at exit
- $26,803
Cash invested: $86,800 (down + closing). Projections, not guarantees.
Landlord ↔ Tenant lean methodology
- Overall (STATE)
- 90 Strongly Landlord-Friendly
- State South Carolina
- 90 Strongly Landlord-Friendly · R+6
- County
- — inherits STATE
- City
- — inherits STATE
ZIP-level market 29649
- Active inventory
- 253
- Price-to-rent
- 14.7×
Monthly cashflow live
- Estimated rent
- $3,518 medium interval (Pro) →
- Mortgage (P&I)
- −$1,626
- Tax from tax record
- −$349 /mo · $4,182/yr
- Insurance
- −$129
- HOA
- −$0
- Vacancy / Maint / Mgmt
- −$739
- Net cashflow
- $676
Break-even live
Sensitivity live
| Price | -10% $851 | -5% $764 | +0% $676 | +5% $588 | +10% $500 |
|---|---|---|---|---|---|
| Rent | -10% $398 | -5% $537 | +0% $676 | +5% $815 | +10% $954 |
| Rate | -1.0pp $832 | -0.5pp $755 | base $676 | +0.5pp $596 | +1.0pp $514 |
2-unit breakdown (identical units grouped — click to expand)
| Units | Beds | Baths | Est. rent |
|---|---|---|---|
| 2× units | 3 | 1 | $3,518 |
| #1 | 3 | 1 | $1,759 |
| #2 | 3 | 1 | $1,759 |
| Total (2 units) | $3,518 | ||
UW: 25.0% down · 7.5% · 30yr · 1.5% tax · 5.0% vac · 8.0% maint · 8.0% mgmt
Financing live
Cash to close
- Down payment
- $77,500
- Closing costs
- $9,300
- Reserves months
- —
- Total cash needed
- —
Loan-product check · same deal, 3 products live
Conventional
25% down · 7.5% · 30yr
- Down + closing
- —
- Monthly P&I
- —
- Monthly cashflow
- —
- DSCR
- —
- Eligible?
- —
Personal DTI + credit; lowest rate.
DSCR
20% down · 8.5% · 30yr
- Down + closing
- —
- Monthly P&I
- —
- Monthly cashflow
- —
- DSCR
- —
- Eligible?
- —
No personal income docs; deal must DSCR.
Hard money
10% down · 12.0% · 12mo
- Down + closing
- —
- Monthly P&I
- —
- Monthly cashflow
- —
- DSCR
- —
- Eligible?
- —
Short-term bridge; refi at stabilization.
Listing history 12 events
-
2026-06-19days on market $310,000 Active 15 DOM
-
2026-06-18days on market $310,000 Active 14 DOM
-
2026-06-17days on market $310,000 Active 13 DOM
-
2026-06-16days on market $310,000 Active 12 DOM
-
2026-06-15days on market $310,000 Active 11 DOM
-
2026-06-14days on market $310,000 Active 9 DOM
-
2026-06-12days on market $310,000 Active 8 DOM
-
2026-06-09days on market $310,000 Active 5 DOM
-
2026-06-08days on market $310,000 Active 4 DOM
-
2026-06-07days on market $310,000 Active 3 DOM
-
2026-06-07remarks 436-char remark
-
2026-06-07$310,000 Active 2 DOM
ⓘ Source: listings_history table (triggers on properties + properties_extension) + one-shot
backfill from property_details.listing_events for pre-trigger history.
Tax reassessment forecast SC · Resets to sale price
- Current annual tax
- $4,182 · $349/mo
- Projected year-2 tax
- $4,182 · $349/mo
- Expected delta
- $0/yr ($0/mo · 0.0%)
ⓘ Screening estimate from a state-policy table — verify with the county assessor before closing.
Climate risk First Street
- Flood 1/10 Low FEMA zone X (unshaded) · 0% chance over 30 yrs
- Wildfire 3/10 Moderate
- Heat 6/10 Major 7 d/yr ≥105°F today · 17 d/yr by 30 yrs out
- Wind 6/10 Major 27% chance of damaging wind over 30 yrs
- Air quality 4/10 Moderate 4 unhealthy d/yr today · 4 by 30 yrs out
Nearby sold comps map
Loading sold comps map…
Walkable amenities ~0.75 mi
Loading nearby amenities…
Taxation est. · year 1
- Rental income
- $42,216
- − Mortgage interest
- −$17,365
- − Property taxes
- −$4,182
- − Insurance
- −$1,550
- − Repairs & maintenance
- −$3,377
- − Management
- −$3,377
- − Depreciation
- −$9,018
- Taxable income
- $3,346
- Est. tax owed @ 24.0%
- −$803
- After-tax cash flow
- $7,307/yr
For passive investors: Depreciation is non-cash, so a rental often shows a tax loss while cash-flowing — sheltering income. Rental losses are passive: they offset passive income freely, and up to $25,000/yr can offset ordinary (W-2) income if you actively participate and your MAGI is under $100k (phasing out to $0 by $150k); unused losses carry forward. On sale, claimed depreciation is recaptured at up to 25%, and gains may owe capital-gains tax (a 1031 exchange can defer both). Figures are a year-1 estimate at your 24.0% rate — not tax advice; consult a CPA.
Schools (NCES district)
- District
- Greenwood 50
- NCES district ID
- 4502340
- Math proficiency
- 31% ▼ -4.00%
- Reading proficiency
- 39% ▲ 2.00%
- Median HH income
- $37,663
- Composite
- 29.14/100
- National rank
- #6585
- State rank
- #43 of 80 in SC
Livability — Greenwood
- Score
- 63/100
- State rank
- #167
- US rank
- #15097
Category grades
Schools grade is shown separately in the Schools card above.
Census & demographics
- Census place
- Greenwood, SC
- County
- Greenwood County · 26,275 people
- City population
- 26,275
- Metro
- Greenwood, SC
- Population (ZIP)
- 26,275
- Household income
- $54,585
- Rent vs Own
- Severe rent burden
- 566.0
Population outlook (Greenwood County) Hauer SSP2
- Today (2025)
- 69,627 people
- By 2030
- 68,905 · -1.0%
- By 2040
- 66,640 · -4.3%
- By 2050
- 63,768 · -8.4%
- By 2075
- 55,769 · -19.9%
- By 2100
- 47,293 · -32.1%
Race, ethnicity, and origin ACS 2023
- Neighborhood character
- Predominantly White (65%)
- Race & ethnicity
- White 65% Black 25% Hispanic / Latino 4% Two or more races 4% Asian 2%
- Common ancestry
- Serbian 3% Italian 3% Slovak 3%
- Foreign-born
- 4% · Canada, China
- Languages at home
- 97% English-only · Spanish 2%
Political lean MEDSL · Greenwood
- 2024 margin
- Strong R (+29.0) · D 34.9% · R 63.8% · Other 1.3%
- 2008→2024 swing
- -13.3pp toward R · 2008: -15.7pp · 2024: -29.0pp
- All cycles
- 2024: R+29.0 2020: R+22.8 2016: R+21.8 2012: R+15.4 2008: R+15.7
Not yet ingested
- Civics
- —
Market trends
- HPI YoY
- ▼ -128.00%
- Current HPI
- 167.9262
- Rent YoY
- —
- Metro
- Greenwood, SC
- State GDP YoY
- ▲ 4.51%
- F500 in state
- 2
Industry mix (Fortune 500 HQ in SC)
| Industry | F500 HQs | Revenue |
|---|---|---|
| Packaging | 1 | $7B |
|
||
Price history
+121.4% since first listed4 events — show timeline
- 2026-06-04 Listed $310,000 GAOR
- 2021-12-22 Sold (MLS) $266,875 GAOR
- 2021-09-06 Listed $285,000 GAOR
- 2020-02-05 Sold (Public Records) $140,000 Public Records
Property tax history
+2.5%/yrLatest (2025): $4,182 · +1.7% YoY. Source: county tax records.
Cash-flow waterfall
monthlySold comps — $/sqft
last 12 mo · ≤1 miLoading sold comps…