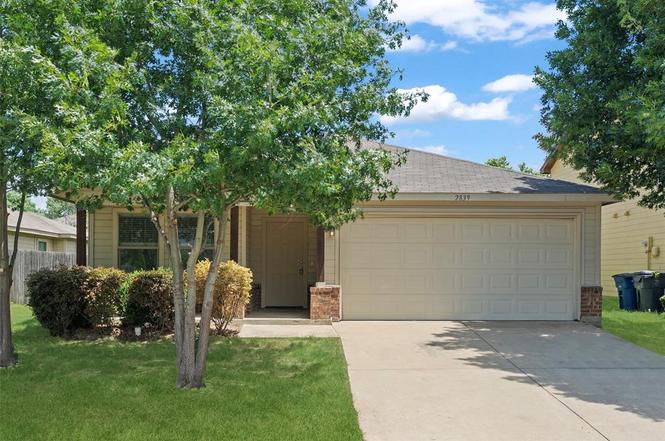
2839 Saint David Dr · Dallas, TX
Flood risk 1/10 · Minimal
- FEMA flood zone
- X (unshaded)
- Chance of flooding over 30 yrs
- 0.0%
- Est. flood insurance / yr
- $507 – $1,088
Fire risk 1/10 · Minimal
- Est. fire insurance / yr
- $1,222 – $2,270
Heat risk 7/10 · Major
- Hot days now (above 109°F)
- 7 days/yr
- Hot days in 30 yrs
- 25 days/yr
Wind risk 6/10 · Moderate
- Chance of severe wind over 30 yrs
- 27.0%
Air-quality risk 3/10 · Minor
- Unhealthy air days now
- 2 days/yr
- Unhealthy air days in 30 yrs
- 3 days/yr
Risk factors via First Street. Map © Google.
Why this score? — see what drove the D- grade
The composite is a weighted blend of 9 inputs, each scored 0–100. Each bar is that input's sub-score; the figure is the points it added to the 100-point composite (weight × sub-score).
- Cash flow +7.6/30.0
- Appreciation +7.1/10.0
- Livability +4.0/5.0
- ARV discount +3.7/15.0
- 1% rule +3.2/10.0
- Schools +2.8/10.0
- Rent growth +2.5/5.0
- Condition / age +2.5/5.0
- DSCR +1.7/10.0
$324,900
🖨 Deal sheet (PDF) 📄 Offer letter ✓ Due diligence
Listing remarks MLS
Don't miss out on this rare opportunity to own a ranch style home with 5 bedrooms, 2 baths, and 2 car garage! The home features energy efficient appliances and a light and bright interior that brings in a lot of natural light. Beautiful mahogany stained cabinets, rich flooring and upgraded carpet. There is lots of storage with walk-in closets. Enjoy the private backyard with a covered porch. The home is close to schools.
Key facts
- Ample storage space
- Open floor plan
- 5,184 sq ft lot
Tags
Property features AI
Finance
- Financial info: Accepts Cash, Conventional, FHA, and VA financing
- HOA & community: Mandatory HOA (Encino Hills HOA); Annual association fee ($115) covering grounds maintenance and management fees
Exterior
- Parking: Attached 2-car garage with 2 single doors (20' x 20'); Garage with inside entrance and garage door opener; Covered parking for 2; Additional paved, lighted, private and oversized parking; driveway and concrete surfaces; side-by-side layout possible; enclosed
- Security: Smoke detectors; Carbon monoxide detector(s)
- Utilities: City water; City sewer; Cable available
- Home design: Single-family residence; One-story; Interior lot; Built in 2015; Accessible design features throughout
- Construction: Brick and wood construction; Composition/shingle roof; Slab foundation
- Exterior features: Covered porch(es); Private yard; Landscaped yard with sprinkler system; Lighting; Fenced backyard with wood privacy fence; Cleared, few trees, level lot
Interior
- Kitchen: Electric range and electric oven; Convection oven; Dishwasher; Disposal; Built-in cabinets; Eat-in kitchen and breakfast bar
- Bedrooms: Primary bedroom (first floor) with walk-in closet; Four additional bedrooms (all on first floor)
- Flooring: Carpet; Vinyl
- Bathrooms: Two full bathrooms; Primary bathroom with built-in cabinets and ensuite
- Heating & cooling: Central heating (electric); Central air conditioning (electric); Ceiling fans
- Interior features: Open floorplan; Eat-in kitchen; Breakfast bar; Pantry / Walk-in pantry; Built-in features and cabinets; Decorative lighting and chandelier; Cable and high-speed internet available; Accessible full bath, bedroom, doors, hallway(s), and kitchen
- Laundry & utility: Separate utility room with built-in cabinets
Neighborhood map
What this means for you Summary
Snapshot
- This is a 5-bed/2.0-bath single-family listed at $325k.
Deal economics
- At list price, monthly cash flow is $-386 ($-5k/yr) — negative.
- To cash-flow at today's rent, offer at most $257k (21.0% below list).
- To meet the 1% rule (rent ≥ 1% of price), the offer needs to be $266k (18.3% below list).
- Recommended offer: $257k (21.0% below list) — sets the bar for cash-flow.
- Cap rate 4.9% vs local median 2.3% in Dallas — top-decile yield for the area; either an underpriced asset or a hidden risk that comps aren't pricing in. Stress-test before assuming the spread holds.
Location & tenants
- Location reads 81/100 on livability (#24 in TX, #1,380 nationally) — a professional / high-income tenant draw. Strengths: amenities A+, commute A+, housing A+; Watch: crime F.
- Dallas ISD (urban): math 31% / reading 36% proficiency, ranked #559 of 826 in TX (top 68%) — families likely to look elsewhere, expect single-tenant / working-renter base with shorter leases; 83% free/reduced lunch — lower-income household profile, screen leases tightly.
- Zoned schools: Jimmie Tyler Brashear El (math 28% / reading 37%, grade F, #2,234 of 4,322 statewide, top 52%, 601 students, 85% FRL); Zan Wesley Holmes Jr Middle (math 22% / reading 28%, grade F, #1,258 of 1,662 statewide, top 77%, 644 students, 96% FRL); Justin F Kimball H S (math 15% / reading 24%, grade F, #1,424 of 1,632 statewide, top 88%, 1,192 students, 81% FRL) — zoned schools at 87% FRL track the district average.
- Market conditions: 50 active listings in the ZIP; 10 comparable units currently listed for rent nearby; rentals leasing fast (median 10d on market — plan ~1-2 weeks tenant-placement turnaround); 12,577 units permitted in Dallas County in 2024 (6,829 in 5+ unit buildings).
Forward outlook
- In year one you build about $16k of equity ($2k loan paydown + $14k appreciation (4.2% local appreciation)).
- Dallas County population projected at +35% by 2050 — long-run rental-demand tailwind backs the buy-and-hold thesis.
- By year 3, paydown + projected appreciation supports a ~$39k cash-out refi (75% LTV) — recoverable capital for the next deal without selling this one.
Negotiation context
- Only 10 days on market — expect competitive offers; lowballing is unlikely to land.
- 6 sale attempts since 4y ago with the ask held roughly flat each time — persistent listings suggest the price (not the market) is what's stuck; bring a comps-based counter.
Risks & watch-outs
- Climate carrying-cost: major wind risk, 27% chance of damaging wind over 30y; extreme-heat days projected 7→25/yr by 2055 (HVAC capex compounding) — expect insurance premiums to compound above CPI over the hold.
Questions for the listing agent
- What do current leases actually rent for vs. the listed asking? Can we see a recent rent roll and the last 12 months of T-12 income?
- What does the HOA fee cover, when was the last increase, and are there any pending special assessments or reserve-fund shortfalls?
- Is there a deadline driving the sale (1031 exchange, divorce, estate, relocation)? That informs how much negotiation room exists.
- Crime grade is F in this area — have there been break-ins, vandalism, or insurance claims at this property in the last 3 years? What carrier currently insures it and at what premium?
- The area grade is low — what's the realistic commute time and amenity access for the typical tenant pool here? Any planned neighborhood developments (good or bad) we should know about?
- What's the average days-on-market for RENTAL listings here right now (not sales)? A rising rental-DOM trend means longer vacancies and softer asking-rent achievability than the comps imply.
- What's the recent tenant-quality profile in this submarket — average credit score on applications, eviction rate, late-payment / NSF rate, and stable-employment percentage? A property-management company in the area should have these aggregated.
- How much new for-sale + rental construction is in the pipeline within 1–3 miles? Heavy new supply typically softens prices + rents 12–24 months out; constrained supply supports both.
Investment metrics
- 1% rule
- 0.82% ✗
- Cap rate
- 4.87%
- Cash-on-cash
- -5.09%
- DSCR
- 0.77
- GRM
- 10.2
CMA / ARV
- ARV (on-the-fly)
- $299,757
- Comps found
- 4
Show comp detail 4 sales within ~0.75 mi
| Address | Dist | Beds/Ba | Sqft | Sold | Price | $/sf | Match |
|---|---|---|---|---|---|---|---|
| 2859 Saint David Dr | 0.05mi | 5/2.0 | 1,901 (+3%) | 8mo | $309,000 | $163 | 86 |
| 2939 St Zachary Dr | 0.25mi | 5/2.0 | 1,846 (+0%) | 3mo | $295,500 | $160 | 85 |
| 3150 St Sophia Dr | 0.38mi | 4/2.5 (-1) | 1,992 (+8%) | 7mo | $285,000 | $143 | 56 |
| 2473 W Five Mile Pkwy | 0.73mi | 4/2.0 (-1) | 1,644 (-11%) | 10mo | $328,500 | $200 | 35 |
Match score weights: distance 35% · size 25% · config 20% · recency 20%. Top-matched comps best support the ARV.
Projected returns pro-forma
4.17% appreciation · 3.0% rent growth · sell at horizon
- IRR
- 6.3%
- Equity multiple
- 1.39×
- Total profit
- $35,278
- Equity at exit
- $167,904
- IRR
- 8.8%
- Equity multiple
- 2.50×
- Total profit
- $136,226
- Equity at exit
- $277,184
Cash invested: $90,972 (down + closing). Projections, not guarantees.
Landlord ↔ Tenant lean methodology
- Overall (STATE)
- 87 Strongly Landlord-Friendly
- State Texas
- 87 Strongly Landlord-Friendly · R+5
- County
- — inherits STATE
- City
- — inherits STATE
ZIP-level market 75233
- Home prices YoY
- 1.1%
- Active inventory
- 50
- Price-to-rent
- 10.2×
Monthly cashflow live
- Estimated rent
- $2,656 high interval (Pro) →
- Mortgage (P&I)
- −$1,704
- Tax from tax record
- −$634 /mo · $7,611/yr
- Insurance
- −$135
- HOA
- −$10
- Vacancy / Maint / Mgmt
- −$558
- Net cashflow
- $-386
Break-even live
Sensitivity live
| Price | -10% $-202 | -5% $-294 | +0% $-386 | +5% $-477 | +10% $-569 |
|---|---|---|---|---|---|
| Rent | -10% $-595 | -5% $-490 | +0% $-386 | +5% $-281 | +10% $-176 |
| Rate | -1.0pp $-222 | -0.5pp $-303 | base $-386 | +0.5pp $-470 | +1.0pp $-555 |
UW: 25.0% down · 7.5% · 30yr · 1.5% tax · 5.0% vac · 8.0% maint · 8.0% mgmt
Financing live
Cash to close
- Down payment
- $81,225
- Closing costs
- $9,747
- Reserves months
- —
- Total cash needed
- —
Loan-product check · same deal, 3 products live
Conventional
25% down · 7.5% · 30yr
- Down + closing
- —
- Monthly P&I
- —
- Monthly cashflow
- —
- DSCR
- —
- Eligible?
- —
Personal DTI + credit; lowest rate.
DSCR
20% down · 8.5% · 30yr
- Down + closing
- —
- Monthly P&I
- —
- Monthly cashflow
- —
- DSCR
- —
- Eligible?
- —
No personal income docs; deal must DSCR.
Hard money
10% down · 12.0% · 12mo
- Down + closing
- —
- Monthly P&I
- —
- Monthly cashflow
- —
- DSCR
- —
- Eligible?
- —
Short-term bridge; refi at stabilization.
Rent comps 10 comps
| Address | Beds | Baths | Sqft | Rent | $/sqft | DOM | Units | Dist |
|---|---|---|---|---|---|---|---|---|
| 3202 Noor St Dallas, TX | 4.0 | 2.0 | 1535 | $2,400 | $1.56 | 7d | 1 | 0.92mi |
| 3202 Noor St Dallas, TX | 4.0 | 2.0 | 1535 | $2,400 | $1.56 | 9d | 1 | 0.92mi |
| 3243 Noor St Dallas, TX | 4.0 | 2.0 | 1535 | $2,400 | $1.56 | 9d | 1 | 0.97mi |
| 3235 Noor St Dallas, TX | 4.0 | 2.0 | 1535 | $2,400 | $1.56 | 22d | 1 | 0.97mi |
| 3235 Noor St Dallas, TX | 4.0 | 2.0 | 1535 | $2,400 | $1.56 | 45d | 1 | 0.97mi |
| 1819 Barlow Ave Dallas, TX | 4.0 | 2.0 | 1408 | $2,195 | $1.56 | 26d | 1 | 1.10mi |
| 3425 Shelley Blvd Dallas, TX | 4.0 | 3.0 | 2448 | $4,250 | $1.74 | 4d | 1 | 1.28mi |
| 3716 Ovid Ave Dallas, TX | 4.0 | 3.5 | 2554 | $3,200 | $1.25 | 13d | 1 | 1.32mi |
| 2512 Sharon St Dallas, TX | 4.0 | 3.0 | 1998 | $2,850 | $1.43 | 5d | 1 | 1.32mi |
| 1823 Newport Ave Dallas, TX | 5.0 | 2.0 | 2418 | $2,800 | $1.16 | 7d | 1 | 1.37mi |
HOA detail
- Monthly dues
- $10 · $120/yr
Listing history 7 events
-
2026-06-21days on market $324,900 Active 10 DOM
-
2026-06-18days on market $324,900 Active 7 DOM
-
2026-06-17days on market $324,900 Active 6 DOM
-
2026-06-16days on market $324,900 Active 5 DOM
-
2026-06-15days on market $324,900 Active 4 DOM
-
2026-06-13remarks 699-char remark
-
2026-06-13$324,900 Active 2 DOM
ⓘ Source: listings_history table (triggers on properties + properties_extension) + one-shot
backfill from property_details.listing_events for pre-trigger history.
Tax reassessment forecast TX · Resets to sale price
- Current annual tax
- $7,611 · $634/mo
- Projected year-2 tax
- $7,611 · $634/mo
- Expected delta
- $0/yr ($0/mo · 0.0%)
ⓘ Screening estimate from a state-policy table — verify with the county assessor before closing.
Climate risk First Street
- Flood 1/10 Low FEMA zone X (unshaded) · 0% chance over 30 yrs
- Wildfire 1/10 Low
- Heat 7/10 Severe 7 d/yr ≥109°F today · 25 d/yr by 30 yrs out
- Wind 6/10 Major 27% chance of damaging wind over 30 yrs
- Air quality 3/10 Moderate 2 unhealthy d/yr today · 3 by 30 yrs out
Nearby sold comps map
Loading sold comps map…
Walkable amenities ~0.75 mi
Loading nearby amenities…
Taxation est. · year 1
- Rental income
- $31,867
- − Mortgage interest
- −$18,199
- − Property taxes
- −$7,611
- − Insurance
- −$1,624
- − Repairs & maintenance
- −$2,549
- − Management
- −$2,549
- − HOA
- −$120
- − Depreciation
- −$9,452
- Taxable loss
- −$10,238
- Est. tax savings @ 24.0%
- +$2,457
- After-tax cash flow
- $-2,169/yr
For passive investors: Depreciation is non-cash, so a rental often shows a tax loss while cash-flowing — sheltering income. Rental losses are passive: they offset passive income freely, and up to $25,000/yr can offset ordinary (W-2) income if you actively participate and your MAGI is under $100k (phasing out to $0 by $150k); unused losses carry forward. On sale, claimed depreciation is recaptured at up to 25%, and gains may owe capital-gains tax (a 1031 exchange can defer both). Figures are a year-1 estimate at your 24.0% rate — not tax advice; consult a CPA.
Schools (NCES district)
- District
- Dallas ISD
- NCES district ID
- 4816230
- Math proficiency
- 31% ▼ -16.00%
- Reading proficiency
- 36% ▼ -4.00%
- Median HH income
- $42,881
- Composite
- 28.41/100
- National rank
- #6763
- State rank
- #559 of 826 in TX
Livability — Dallas
- Score
- 81/100
- State rank
- #24
- US rank
- #1380
Category grades
Schools grade is shown separately in the Schools card above.
Census & demographics
- Census place
- Dallas, TX
- City population
- 1,168,437
- Population (ZIP)
- 15,775
Population outlook (Dallas County) Hauer SSP2
- Today (2025)
- 2,979,839 people
- By 2030
- 3,191,823 · +7.1%
- By 2040
- 3,619,611 · +21.5%
- By 2050
- 4,026,915 · +35.1%
- By 2075
- 4,957,073 · +66.4%
- By 2100
- 5,508,725 · +84.9%
Race, ethnicity, and origin ACS 2023
- Neighborhood character
- Majority Hispanic (63%)
- Race & ethnicity
- Hispanic / Latino 63% Black 25% Two or more races 11% White 10% Asian 1%
- Hispanic origin (detail)
- Mexican 60%
- Common ancestry
- Slovak 1% Italian 1%
- Foreign-born
- 23% · Canada
- Languages at home
- 47% English-only · Spanish 52% Vietnamese 1%
Political lean MEDSL · Dallas
- 2024 margin
- Strong D (+22.2) · D 60.2% · R 38.0% · Other 1.8%
- 2008→2024 swing
- +6.9pp toward D · 2008: 15.3pp · 2024: 22.2pp
- All cycles
- 2024: D+22.2 2020: D+31.6 2016: D+26.2 2012: D+15.4 2008: D+15.3
Not yet ingested
- Civics
- —
Market trends
- HPI YoY
- ▲ 4.17%
- Current HPI
- 370.9766
- Rent YoY
- —
- Metro
- —
- State GDP YoY
- ▲ 3.95%
- F500 in state
- 110
Industry mix (Fortune 500 HQ in TX)
| Industry | F500 HQs | Revenue |
|---|---|---|
| Energy | 16 | $1,198B |
|
||
| Technology | 5 | $198B |
|
||
| Engineering / Construction | 4 | $72B |
|
||
| Energy Services | 3 | $60B |
|
||
| Utilities | 3 | $41B |
|
||
| Healthcare | 2 | $330B |
|
||
Price history
-24.2% since first listed18 events — show timeline
- 2026-06-11 Listed $324,900 NTREIS
- 2025-12-18 Price Changed $307,000 NTREIS
- 2025-10-30 Price Changed $317,400 NTREIS
- 2025-10-10 Price Changed $324,900 NTREIS
- 2025-08-29 Listed $329,900 NTREIS
- 2025-02-05 Rental Removed $2,695 NTREIS
- 2025-01-25 Rental Removed $2,695 BUILDIUM
- 2025-01-25 Listed for Rent $2,695 NTREIS
- 2025-01-01 Price Changed $2,695 BUILDIUM
- 2024-12-07 Listed for Rent $2,725 BUILDIUM
- 2023-10-26 Rental Removed $2,695 BUILDIUM
- 2023-10-14 Listed for Rent $2,695 BUILDIUM
- 2022-08-31 Sold (Public Records) — Public Records
- 2022-08-24 Sold (MLS) — NTREIS
- 2022-08-08 Pending — NTREIS
- 2022-08-03 Contingent — NTREIS
- 2022-06-22 Listed $330,000 NTREIS
- 2009-06-08 Sold (Public Records) $428,750 Public Records
Property tax history
+18.6%/yrLatest (2025): $7,611 · -0.4% YoY. Source: county tax records.
Cash-flow waterfall
monthlySold comps — $/sqft
last 12 mo · ≤1 miLoading sold comps…