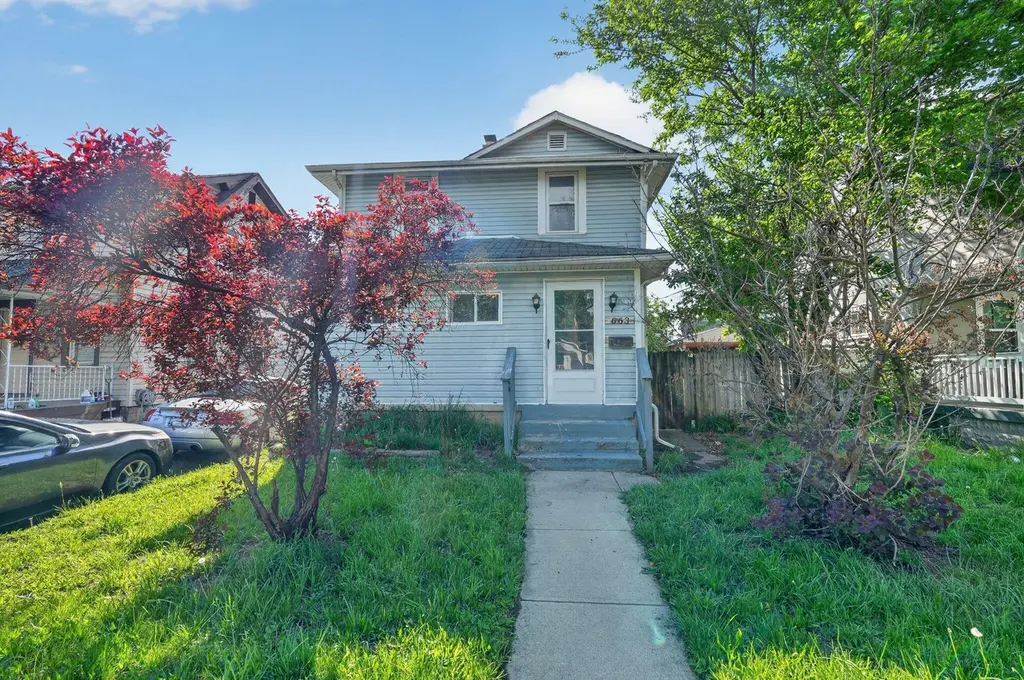
663 Racine Ave · Columbus, OH
Flood risk 1/10 · Minimal
- FEMA flood zone
- X (unshaded)
- Chance of flooding over 30 yrs
- 0.0%
- Est. flood insurance / yr
- $473 – $860
Fire risk 1/10 · Minimal
- Est. fire insurance / yr
- $713 – $1,323
Heat risk 4/10 · Minor
- Hot days now (above 102°F)
- 7 days/yr
- Hot days in 30 yrs
- 18 days/yr
Wind risk 2/10 · Minimal
- Chance of severe wind over 30 yrs
- 1.0%
Air-quality risk 2/10 · Minimal
- Unhealthy air days now
- 1 days/yr
- Unhealthy air days in 30 yrs
- 2 days/yr
Risk factors via First Street. Map © Google.
Why this score? — see what drove the C- grade
The composite is a weighted blend of 9 inputs, each scored 0–100. Each bar is that input's sub-score; the figure is the points it added to the 100-point composite (weight × sub-score).
- Cash flow +17.9/30.0
- ARV discount +15.0/15.0
- DSCR +5.6/10.0
- 1% rule +4.5/10.0
- Livability +4.0/5.0
- Rent growth +3.6/5.0
- Condition / age +2.5/5.0
- Schools +1.7/10.0
- Appreciation +0.0/10.0
$134,900
🖨 Deal sheet (PDF) 📄 Offer letter ✓ Due diligence
Listing remarks MLS
Calling all investors! Excellent opportunity in Columbus' Wilshire Heights community. This 3 bedroom, 1 full bath two story is ready for finishing touches! Large living room with decorative fireplace and ceiling fan. Dining room which leads to the kitchen with oak cabinets and all appliances. 3 generous size bedrooms with hardwood flooring. Renovated full bath with ceramic tile shower surround. Deck. Fenced lot. 1 car detached garage. GREAT VALUE!
Key facts
- Easy access to i-70
- Formal dining room
- Fenced yard
Tags
Property features AI
Exterior
- Parking: Detached 1-car garage
- Utilities: Public water; Public sewer
- Home design: Single family residence; Two levels; No shared/common walls; Built in 1930
- Construction: Block foundation
- Exterior features: Fenced yard
Interior
- Flooring: Wood flooring; Carpeted areas
- Bathrooms: 1 full bathroom
- Heating & cooling: Forced air heating; Central air conditioning
- Interior features: Full basement; Decorative fireplace
Neighborhood map
What this means for you Summary
Snapshot
- This is a 3-bed/1.0-bath single-family listed at $135k.
Deal economics
- At list price, monthly cash flow is $113 ($1k/yr) — positive.
- The deal already cash-flows at list — no discount required.
- To meet the 1% rule (rent ≥ 1% of price), the offer needs to be $128k (5.1% below list).
- Recommended offer: $128k (5.1% below list) — sets the bar for 1% rule.
- Cap rate 7.3% vs local median 3.8% in Columbus — top-decile yield for the area; either an underpriced asset or a hidden risk that comps aren't pricing in. Stress-test before assuming the spread holds.
Location & tenants
- Location reads 81/100 on livability (#97 in OH, #1,491 nationally) — a professional / high-income tenant draw. Strengths: commute A+, cost of living A+, housing A+; Watch: employment C-, crime F.
- Columbus City School District (urban): math 15% / reading 26% proficiency, ranked #626 of 656 in OH (top 95%) — low school quality limits family demand, transient renter base, plan for 1-2y turnover; 72% free/reduced lunch — lower-income household profile, screen leases tightly.
- Market conditions: Rents rising fast (+4.5%/yr); 188 active listings in the ZIP; 40 comparable units currently listed for rent nearby; rentals at typical pace (median 25d on market — plan ~3-4 weeks tenant-placement turnaround); 42% of comp listings sitting > 30 days — soft ceiling on asking rent; 8,139 units permitted in Franklin County in 2024 (5,940 in 5+ unit buildings).
Forward outlook
- Local home prices are declining (-3.0%/yr); year-one equity from $933 of loan paydown is wiped out by about $4k of value loss. Plan a longer hold.
- Franklin County population projected at +34% by 2050 — long-run rental-demand tailwind backs the buy-and-hold thesis.
Negotiation context
- It's been on market 51 days — a 3% lower offer ($131k) is reasonable based on typical stale-listing flexibility.
- 7 sale attempts since 32y ago with the ask held roughly flat each time — persistent listings suggest the price (not the market) is what's stuck; bring a comps-based counter.
- Current owner paid $60k; list at $135k implies a 126% gain — meaningful room to come down on a strong offer.
Risks & watch-outs
- Watch-outs: built in 1930 — expect roof / HVAC / electrical / plumbing capex.
Questions for the listing agent
- It's been on market 51 days. Have you received any prior offers? Is the seller open to a 5% concession, seller financing, or rate buy-down credit?
- Built in 1930 — when were the roof, HVAC, electrical panel, plumbing, and water heater last replaced?
- Is there a deadline driving the sale (1031 exchange, divorce, estate, relocation)? That informs how much negotiation room exists.
- Crime grade is F in this area — have there been break-ins, vandalism, or insurance claims at this property in the last 3 years? What carrier currently insures it and at what premium?
- What's the average days-on-market for RENTAL listings here right now (not sales)? A rising rental-DOM trend means longer vacancies and softer asking-rent achievability than the comps imply.
- What's the recent tenant-quality profile in this submarket — average credit score on applications, eviction rate, late-payment / NSF rate, and stable-employment percentage? A property-management company in the area should have these aggregated.
- How much new for-sale + rental construction is in the pipeline within 1–3 miles? Heavy new supply typically softens prices + rents 12–24 months out; constrained supply supports both.
Investment metrics
- 1% rule
- 0.95% ✗
- Cap rate
- 7.30%
- Cash-on-cash
- 3.59%
- DSCR
- 1.16
- GRM
- 8.8
CMA / ARV
- ARV (median comp)
- $172,009
- List price
- $134,900
- Delta
- -21.57%
- Verdict
- UNDERPRICED
- Comps
- 20 within 1.0 mi
Show comp detail 12 sales within ~0.75 mi
| Address | Dist | Beds/Ba | Sqft | Sold | Price | $/sf | Match |
|---|---|---|---|---|---|---|---|
| 686 S Burgess Ave | 0.23mi | 2/1.0 (-1) | 1,056 (0%) | 1mo | $82,500 | $78 | 84 |
| 570 Wiltshire Rd | 0.19mi | 2/1.0 (-1) | 1,100 (+4%) | 2mo | $190,000 | $173 | 78 |
| 510 S Warren Ave | 0.23mi | 3/1.0 | 1,144 (+8%) | 2mo | $189,000 | $165 | 74 |
| 2712 Eakin Rd | 0.22mi | 3/2.0 | 1,152 (+9%) | 1mo | $233,500 | $203 | 69 |
| 586 S Hague Ave | 0.13mi | 3/1.0 | 1,208 (+14%) | 2mo | $180,000 | $149 | 69 |
| 334 S Wayne Ave | 0.65mi | 3/1.0 | 1,057 (+0%) | 2mo | $188,500 | $178 | 68 |
| 744 Powhatan Ave | 0.72mi | 3/1.0 | 1,066 (+1%) | 0mo | $238,000 | $223 | 65 |
| 349 S Richardson Ave | 0.50mi | 2/1.0 (-1) | 1,004 (-5%) | 2mo | $169,900 | $169 | 62 |
| 3232 Mary Ave | 0.72mi | 3/1.0 | 1,028 (-3%) | 2mo | $130,000 | $126 | 61 |
| 310 S Ogden Ave | 0.52mi | 3/1.5 | 960 (-9%) | 1mo | $200,000 | $208 | 58 |
| 416 S Burgess Ave | 0.40mi | 2/1.0 (-1) | 1,210 (+15%) | 0mo | $134,900 | $111 | 52 |
| 229 S Richardson Ave | 0.66mi | 3/1.0 | 1,168 (+11%) | 1mo | $165,000 | $141 | 51 |
Match score weights: distance 35% · size 25% · config 20% · recency 20%. Top-matched comps best support the ARV.
Projected returns pro-forma
-3.0% appreciation · 4.49% rent growth · sell at horizon
- IRR
- -9.1%
- Equity multiple
- 0.66×
- Total profit
- $-12,727
- Equity at exit
- $20,114
- IRR
- 2.2%
- Equity multiple
- 1.17×
- Total profit
- $6,402
- Equity at exit
- $11,664
Cash invested: $37,772 (down + closing). Projections, not guarantees.
Landlord ↔ Tenant lean methodology
- Overall (STATE)
- 73 Landlord-Friendly
- State Ohio
- 73 Landlord-Friendly · R+6
- County
- — inherits STATE
- City
- — inherits STATE
ZIP-level market 43204
- Rents YoY
- 4.5%
- Active inventory
- 188
- Price-to-rent
- 8.8×
Monthly cashflow live
- Estimated rent
- $1,280 high interval (Pro) →
- Mortgage (P&I)
- −$707
- Tax from tax record
- −$134 /mo · $1,612/yr
- Insurance
- −$56
- HOA
- −$0
- Vacancy / Maint / Mgmt
- −$269
- Net cashflow
- $113
Break-even live
Sensitivity live
| Price | -10% $189 | -5% $151 | +0% $113 | +5% $75 | +10% $36 |
|---|---|---|---|---|---|
| Rent | -10% $12 | -5% $62 | +0% $113 | +5% $163 | +10% $214 |
| Rate | -1.0pp $181 | -0.5pp $147 | base $113 | +0.5pp $78 | +1.0pp $42 |
UW: 25.0% down · 7.5% · 30yr · 1.5% tax · 5.0% vac · 8.0% maint · 8.0% mgmt
Financing live
Cash to close
- Down payment
- $33,725
- Closing costs
- $4,047
- Reserves months
- —
- Total cash needed
- —
Loan-product check · same deal, 3 products live
Conventional
25% down · 7.5% · 30yr
- Down + closing
- —
- Monthly P&I
- —
- Monthly cashflow
- —
- DSCR
- —
- Eligible?
- —
Personal DTI + credit; lowest rate.
DSCR
20% down · 8.5% · 30yr
- Down + closing
- —
- Monthly P&I
- —
- Monthly cashflow
- —
- DSCR
- —
- Eligible?
- —
No personal income docs; deal must DSCR.
Hard money
10% down · 12.0% · 12mo
- Down + closing
- —
- Monthly P&I
- —
- Monthly cashflow
- —
- DSCR
- —
- Eligible?
- —
Short-term bridge; refi at stabilization.
Rent comps 40 comps
| Address | Beds | Baths | Sqft | Rent | $/sqft | DOM | Units | Dist |
|---|---|---|---|---|---|---|---|---|
| 608 Racine Ave #610 Columbus, OH | 3.0 | 1.0 | 1168 | $1,195 | $1.02 | 44d | 1 | 0.11mi |
| 616-618 S Ogden Ave Columbus, OH | 3.0 | 1.0 | 1100 | $1,125 | $1.02 | 44d | 1 | 0.19mi |
| 2709-2711 Sullivant Ave Unit 2709 Columbus, OH | 3.0 | 2.0 | 1344 | $1,380 | $1.03 | 4d | 1 | 0.20mi |
| 2709-2711 Sullivant Ave Columbus, OH | 3.0 | 2.0 | 1344 | $1,380 | $1.03 | 4d | 1 | 0.20mi |
| 661-663 S Burgess Ave Columbus, OH | 3.0 | 1.0 | 1100 | $1,028 | $0.93 | 44d | 1 | 0.22mi |
| 839-841 S Ogden Ave Columbus, OH | 2.0 | 1.0 | 727 | $1,000 | $1.38 | 3d | 1 | 0.25mi |
| 793 Wiltshire Rd Columbus, OH | 2.0 | 1.0 | 900 | $1,450 | $1.61 | 44d | 1 | 0.26mi |
| 475 S Ogden Ave Columbus, OH | 2.0 | 1.0 | 888 | $1,100 | $1.24 | 24d | 1 | 0.31mi |
| 2545-2547 Sullivant Ave Columbus, OH | 3.0 | 1.0 | 1064 | $1,100 | $1.03 | 11d | 1 | 0.37mi |
| 427 S Ogden Ave Unit 427 Columbus, OH | 2.0 | 1.0 | 980 | $1,350 | $1.38 | 8d | 1 | 0.37mi |
| 406 1/2 S Hague Ave Columbus, OH | 2.0 | 1.0 | 918 | $765 | $0.83 | 44d | 1 | 0.39mi |
| 530 S Terrace Ave Columbus, OH | 2.0 | 1.0 | 896 | $900 | $1.00 | 24d | 1 | 0.41mi |
| 396 S Powell Ave Unit 396 Columbus, OH | 2.0 | 1.0 | 1022 | $925 | $0.91 | 44d | 1 | 0.41mi |
| 2883-2889 Wicklow Rd Columbus, OH | 2.0 | 1.0 | 1200 | $1,099 | $0.92 | 44d | 1 | 0.42mi |
| 390 S Powell Ave Columbus, OH | 2.0 | 1.0 | 775 | $1,025 | $1.32 | 4d | 1 | 0.42mi |
| 695 S Eureka Ave Columbus, OH | 3.0 | 1.0 | 1344 | $1,425 | $1.06 | 22d | 1 | 0.44mi |
| 945 Hodges Dr Columbus, OH | 3.0 | 1.0 | 1078 | $1,640 | $1.52 | 24d | 1 | 0.46mi |
| 375 S Burgess Ave Columbus, OH | 2.0 | 1.0 | 732 | $950 | $1.30 | 20d | 1 | 0.46mi |
| 375 S Burgess Ave Columbus, OH | 2.0 | 1.0 | 732 | $950 | $1.30 | 4d | 1 | 0.46mi |
| 364 S Chase Ave Unit B Columbus, OH | 2.0 | 1.0 | 1010 | $975 | $0.97 | 44d | 1 | 0.47mi |
| 486-488 S Huron Ave Unit 488 Columbus, OH | 2.0 | 1.0 | 1104 | $1,150 | $1.04 | 44d | 1 | 0.48mi |
| 521-523 S Wayne Ave Columbus, OH | 3.0 | 1.0 | 1092 | $1,195 | $1.09 | 4d | 1 | 0.50mi |
| 322 S Powell Ave Columbus, OH | 2.0 | 1.0 | 1100 | $950 | $0.86 | 20d | 1 | 0.51mi |
| 1028 S Harris Ave Columbus, OH | 3.0 | 1.0 | 900 | $1,500 | $1.67 | 44d | 1 | 0.52mi |
| 548 S Wayne Ave Columbus, OH | 3.0 | 1.0 | 1008 | $1,225 | $1.22 | 20d | 1 | 0.53mi |
| 329 S Wayne Ave Columbus, OH | 3.0 | 1.0 | 1120 | $1,425 | $1.27 | 4d | 1 | 0.67mi |
| 1045 Binns Blvd Unit A Columbus, OH | 2.0 | 1.0 | 731 | $905 | $1.24 | 24d | 1 | 0.71mi |
| 148 S Powell Ave Unit B Columbus, OH | 2.0 | 1.0 | 900 | $1,000 | $1.11 | 8d | 1 | 0.75mi |
| 148 S Powell Ave Columbus, OH | 2.0 | 1.0 | 900 | $1,050 | $1.17 | 44d | 1 | 0.75mi |
| 252-254 S Wayne Ave Unit 254 Columbus, OH | 3.0 | 1.0 | 1120 | $1,300 | $1.16 | 18d | 1 | 0.77mi |
| 3285 Sullivant Ave Unit D Columbus, OH | 2.0 | 1.0 | 860 | $1,200 | $1.40 | 8d | 1 | 0.78mi |
| 947 E Forest Creek Dr Columbus, OH | 2.0 | 1.5 | 950 | $1,200 | $1.26 | 44d | 2 | 0.81mi |
| 2203 Clarendon Ln Unit 2203 Columbus, OH | 2.0 | 1.0 | 835 | $1,000 | $1.20 | 13d | 1 | 0.83mi |
| 92 S Hague Ave Columbus, OH | 3.0 | 2.0 | 1456 | $1,400 | $0.96 | 24d | 1 | 0.83mi |
| 2205 Sullivant Ave Columbus, OH | 3.0 | 1.0 | 1275 | $1,200 | $0.94 | 44d | 1 | 0.83mi |
| 80 S Warren Ave Columbus, OH | 3.0 | 1.0 | 1258 | $1,345 | $1.07 | 4d | 1 | 0.85mi |
| 80 S Warren Ave Columbus, OH | 3.0 | 1.0 | 1258 | $1,345 | $1.07 | 44d | 1 | 0.85mi |
| 2173 W Mound St Unit A Columbus, OH | 2.0 | 1.0 | 825 | $900 | $1.09 | 44d | 1 | 0.87mi |
| 2157 W Mound St Unit C Columbus, OH | 2.0 | 1.0 | 825 | $900 | $1.09 | 44d | 1 | 0.88mi |
| 2167 W Mound St Unit C Columbus, OH | 2.0 | 1.0 | 825 | $900 | $1.09 | 44d | 1 | 0.90mi |
Listing history 38 events
-
2026-06-21days on market $134,900 Active 51 DOM
-
2026-06-18days on market $134,900 Active 48 DOM
-
2026-06-17days on market $134,900 Active 47 DOM
-
2026-06-16days on market $134,900 Active 46 DOM
-
2026-06-15days on market $134,900 Active 45 DOM
-
2026-06-13days on market $134,900 Active 43 DOM
-
2026-06-13days on market $134,900 Active 42 DOM
-
2026-06-09days on market $134,900 Active 39 DOM
-
2026-06-08days on market $134,900 Active 38 DOM
-
2026-06-07days on market $134,900 Active 37 DOM
-
2026-06-05days on market $134,900 Active 34 DOM
-
2026-06-03days on market $134,900 Active 33 DOM
-
2026-06-02days on market $134,900 Active 32 DOM
-
2026-06-01days on market $134,900 Active 31 DOM
-
2026-05-31days on market $134,900 Active 30 DOM
-
2026-05-01$134,900 Active 385-char remark
-
2019-08-09soldstatus $59,600
-
2019-07-31soldstatus $59,501 Closed 451-char remark
Show marketing remark (451 chars)
Calling all investors! Excellent opportunity in Columbus' Wilshire Heights community. This 3 bedroom, 1 full bath two story is ready for finishing touches! Large living room with decorative fireplace and ceiling fan. Dining room which leads to the kitchen with oak cabinets and all appliances. 3 generous size bedrooms with hardwood flooring. Renovated full bath with ceramic tile shower surround. Deck. Fenced lot. 1 car detached garage. GREAT VALUE!
-
2019-07-24status Pending 451-char remark
Show marketing remark (451 chars)
Calling all investors! Excellent opportunity in Columbus' Wilshire Heights community. This 3 bedroom, 1 full bath two story is ready for finishing touches! Large living room with decorative fireplace and ceiling fan. Dining room which leads to the kitchen with oak cabinets and all appliances. 3 generous size bedrooms with hardwood flooring. Renovated full bath with ceramic tile shower surround. Deck. Fenced lot. 1 car detached garage. GREAT VALUE!
-
2019-07-17$59,500 Active 451-char remark
Show marketing remark (451 chars)
Calling all investors! Excellent opportunity in Columbus' Wilshire Heights community. This 3 bedroom, 1 full bath two story is ready for finishing touches! Large living room with decorative fireplace and ceiling fan. Dining room which leads to the kitchen with oak cabinets and all appliances. 3 generous size bedrooms with hardwood flooring. Renovated full bath with ceramic tile shower surround. Deck. Fenced lot. 1 car detached garage. GREAT VALUE!
-
2018-11-14historical
-
2018-06-27status Active
-
2018-06-22historical Contingent Finance and Inspection
-
2018-05-24$59,800 Active
-
2017-12-15historical
-
2017-07-12price $50,000
-
2017-05-23price $55,000
-
2017-03-28$65,000 Active
-
1998-02-20soldstatus $40,500
-
1996-06-21soldstatus $59,000
-
1996-06-21soldstatus $59,000
-
1996-05-20historical
-
1995-12-29soldstatus $38,714
-
1995-12-09soldstatus $38,714
-
1995-12-06$59,900
-
1994-12-31soldstatus $45,400
-
1994-10-10$42,900
-
1989-03-03soldstatus $42,900
ⓘ Source: listings_history table (triggers on properties + properties_extension) + one-shot
backfill from property_details.listing_events for pre-trigger history.
Tax reassessment forecast OH · Partial reset (capped growth)
- Current annual tax
- $1,612 · $134/mo
- Projected year-2 tax
- $1,858 · $155/mo
- Expected delta
- +$246/yr (+$21/mo · 15.3%)
ⓘ Screening estimate from a state-policy table — verify with the county assessor before closing.
Climate risk First Street
- Flood 1/10 Low FEMA zone X (unshaded) · 0% chance over 30 yrs
- Wildfire 1/10 Low
- Heat 4/10 Moderate 7 d/yr ≥102°F today · 18 d/yr by 30 yrs out
- Wind 2/10 Low 100% chance of damaging wind over 30 yrs
- Air quality 2/10 Low 1 unhealthy d/yr today · 2 by 30 yrs out
Nearby sold comps map
Loading sold comps map…
Walkable amenities ~0.75 mi
Loading nearby amenities…
Taxation est. · year 1
- Rental income
- $15,355
- − Mortgage interest
- −$7,556
- − Property taxes
- −$1,612
- − Insurance
- −$674
- − Repairs & maintenance
- −$1,228
- − Management
- −$1,228
- − Depreciation
- −$3,924
- Taxable loss
- −$870
- Est. tax savings @ 24.0%
- +$209
- After-tax cash flow
- $1,563/yr
For passive investors: Depreciation is non-cash, so a rental often shows a tax loss while cash-flowing — sheltering income. Rental losses are passive: they offset passive income freely, and up to $25,000/yr can offset ordinary (W-2) income if you actively participate and your MAGI is under $100k (phasing out to $0 by $150k); unused losses carry forward. On sale, claimed depreciation is recaptured at up to 25%, and gains may owe capital-gains tax (a 1031 exchange can defer both). Figures are a year-1 estimate at your 24.0% rate — not tax advice; consult a CPA.
Schools (NCES district)
- District
- Columbus City School District
- NCES district ID
- 3904380
- Math proficiency
- 15% ▼ -17.00%
- Reading proficiency
- 26% ▼ -12.00%
- Median HH income
- $38,483
- Composite
- 17.19/100
- National rank
- #9105
- State rank
- #626 of 656 in OH
Livability — Columbus
- Score
- 81/100
- State rank
- #97
- US rank
- #1491
Category grades
Schools grade is shown separately in the Schools card above.
Census & demographics
- Census place
- Columbus, OH
- County
- Franklin County · 1,351,780 people
- City population
- 612,189
- Metro
- Columbus, OH
- Population (ZIP)
- 42,962
- Household income
- $59,266
- Rent vs Own
- Severe rent burden
- 2290.0
Population outlook (Franklin County) Hauer SSP2
- Today (2025)
- 1,456,139 people
- By 2030
- 1,556,890 · +6.9%
- By 2040
- 1,757,349 · +20.7%
- By 2050
- 1,950,539 · +34.0%
- By 2075
- 2,376,171 · +63.2%
- By 2100
- 2,636,796 · +81.1%
Race, ethnicity, and origin ACS 2023
- Neighborhood character
- Diverse neighborhood (Simpson 0.58)
- Race & ethnicity
- White 61% Hispanic / Latino 16% Black 13% Two or more races 12% Asian 3%
- Hispanic origin (detail)
- Mexican 9%
- Common ancestry
- Lithuanian 1% Slovak 1% Romanian 1%
- Foreign-born
- 13% · Canada
- Languages at home
- 81% English-only · Spanish 13% Arabic 2% Other Asian/Pacific 1%
Political lean MEDSL · Franklin
- 2024 margin
- Strong D (+28.4) · D 63.7% · R 35.3% · Other 1.0%
- 2008→2024 swing
- +7.7pp toward D · 2008: 20.7pp · 2024: 28.4pp
- All cycles
- 2024: D+28.4 2020: D+31.4 2016: D+25.9 2012: D+21.7 2008: D+20.7
Not yet ingested
- Civics
- —
Market trends
- HPI YoY
- ▼ -220.67%
- Current HPI
- 265.7711
- Rent YoY
- ▲ 4.49%
- Metro
- Columbus, OH
- State GDP YoY
- ▲ 1.98%
- F500 in state
- 48
Industry mix (Fortune 500 HQ in OH)
| Industry | F500 HQs | Revenue |
|---|---|---|
| Insurance | 3 | $145B |
|
||
| Industrial Machinery | 3 | $49B |
|
||
| Financial Services | 3 | $24B |
|
||
| Consumer Goods | 2 | $93B |
|
||
| Aerospace / Defense | 2 | $47B |
|
||
| Utilities | 2 | $33B |
|
||
Price history
+214.5% since first listed23 events — show timeline
- 2026-05-01 Listed $134,900 CBRMLS
- 2019-08-09 Sold (Public Records) $59,600 Public Records
- 2019-07-31 Sold (MLS) $59,501 CBRMLS
- 2019-07-24 Pending — CBRMLS
- 2019-07-17 Listed $59,500 CBRMLS
- 2018-11-14 Listing Removed — CBRMLS
- 2018-06-27 Relisted — CBRMLS
- 2018-06-22 Contingent — CBRMLS
- 2018-05-24 Listed $59,800 CBRMLS
- 2017-12-15 Listing Removed — CBRMLS
- 2017-07-12 Price Changed $50,000 CBRMLS
- 2017-05-23 Price Changed $55,000 CBRMLS
- 2017-03-28 Listed $65,000 CBRMLS
- 1998-02-20 Sold (Public Records) $40,500 Public Records
- 1996-06-21 Sold (Public Records) $59,000 Public Records
- 1996-06-21 Sold (MLS) $59,000 CBRMLS
- 1996-05-20 Listing Removed — CBRMLS
- 1995-12-29 Sold (Public Records) $38,714 Public Records
- 1995-12-09 Sold (Public Records) $38,714 Public Records
- 1995-12-06 Listed $59,900 CBRMLS
- 1994-12-31 Sold (MLS) $45,400 CBRMLS
- 1994-10-10 Listed $42,900 CBRMLS
- 1989-03-03 Sold (Public Records) $42,900 Public Records
Property tax history
+3.5%/yrLatest (2024): $1,612 · +1.3% YoY. Source: county tax records.
Cash-flow waterfall
monthlySold comps — $/sqft
last 12 mo · ≤1 miLoading sold comps…