6505 N 107th St · Milwaukee, WI
Flood risk 1/10 · Minimal
- FEMA flood zone
- X (unshaded)
- Chance of flooding over 30 yrs
- 0.0%
- Est. flood insurance / yr
- $473 – $860
Fire risk 1/10 · Minimal
- Est. fire insurance / yr
- $636 – $1,182
Heat risk 2/10 · Minimal
- Hot days now (above 101°F)
- 7 days/yr
- Hot days in 30 yrs
- 13 days/yr
Wind risk 2/10 · Minimal
- Chance of severe wind over 30 yrs
- —
Air-quality risk 2/10 · Minimal
- Unhealthy air days now
- 2 days/yr
- Unhealthy air days in 30 yrs
- 2 days/yr
Risk factors via First Street. Map © Google.
Why this score? — see what drove the C- grade
The composite is a weighted blend of 9 inputs, each scored 0–100. Each bar is that input's sub-score; the figure is the points it added to the 100-point composite (weight × sub-score).
- Cash flow +16.1/30.0
- ARV discount +15.0/15.0
- 1% rule +6.7/10.0
- DSCR +5.0/10.0
- Rent growth +4.0/5.0
- Livability +4.0/5.0
- Condition / age +2.5/5.0
- Schools +1.2/10.0
- Appreciation +0.0/10.0
$150,000
🖨 Deal sheet 📄 Offer letter ✓ Due diligence
Listing remarks MLS
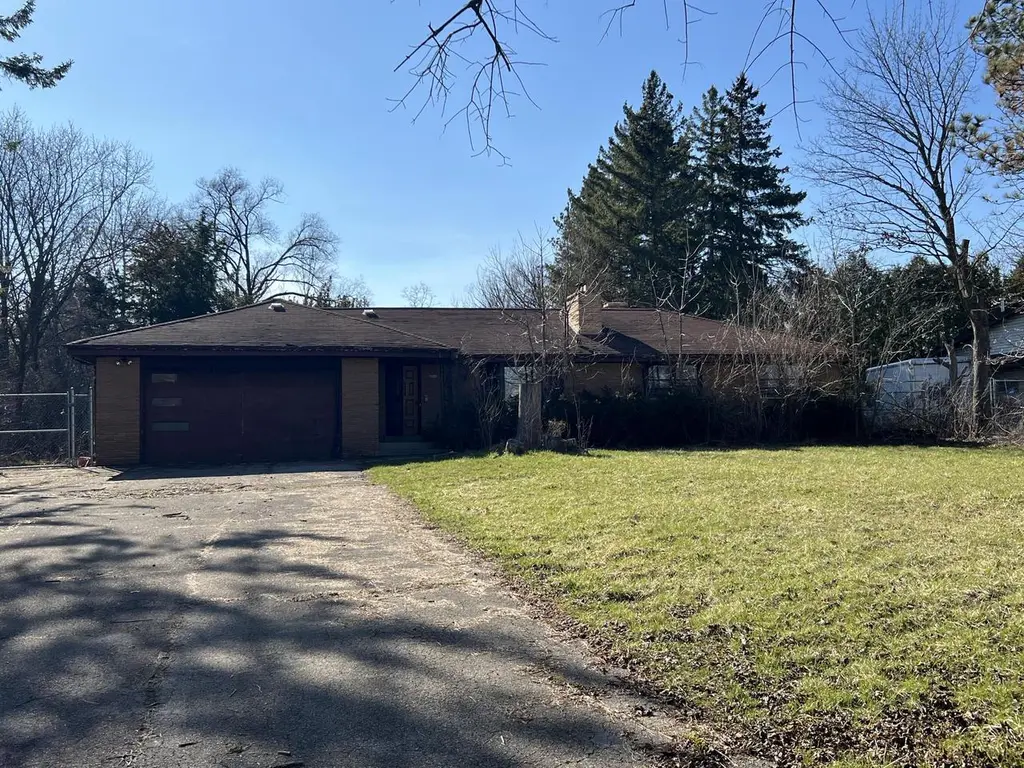
City Tax Foreclosure - 3BR, 1.5 BA Single Family Ranch w/ Attached Garage sitting on nice sized 1 acres lot. Home has 1,607 square feet, and more. City Scope of Essential Work is $20,600 Total scope of work is $22,600. Room and lot sizes are estimates & all information should be verified. Property being sold in 'as-is' condition. Bring flashlights & use caution when entering. Note: Property open to owner-occupant offers only first 30 days of listing
Key facts
- 1.08 acre lot
- Garage
- Built 1958
Neighborhood map
What this means for you Summary
Snapshot
- This is a 3-bed/1.5-bath single-family listed at $150k.
Deal economics
- At list price, monthly cash flow is $78 ($930/yr) — positive.
- The deal already cash-flows at list — no discount required.
- Meets the 1% rule at list price ($2k rent vs $150k).
- Recommended offer: $146k (3.0% below list) — sets the bar for market timing.
- Cap rate 6.9% vs local median 5.1% in Milwaukee — top-decile yield for the area; either an underpriced asset or a hidden risk that comps aren't pricing in. Stress-test before assuming the spread holds.
Location & tenants
- Location reads 81/100 on livability (#55 in WI, #1,534 nationally) — a professional / high-income tenant draw. Strengths: amenities A+, commute A+, cost of living A+; Watch: employment D+, schools F, crime F.
- Milwaukee School District (urban): math 10% / reading 18% proficiency, ranked #337 of 342 in WI (top 98%) — low school quality limits family demand, transient renter base, plan for 1-2y turnover; 77% free/reduced lunch — lower-income household profile, screen leases tightly.
- Market conditions: Rents rising fast (+6.0%/yr); 40 active listings in the ZIP; 15 comparable units currently listed for rent nearby; rentals at typical pace (median 20d on market — plan ~3-4 weeks tenant-placement turnaround); 1,017 units permitted in Milwaukee County in 2024 (803 in 5+ unit buildings).
- This rent runs 31% of the median local income ($68k/yr) — at the standard rent-burdened threshold; future hikes will face affordability resistance.
Forward outlook
- Local home prices are declining (-3.0%/yr); year-one equity from $1k of loan paydown is wiped out by about $4k of value loss. Plan a longer hold.
- Milwaukee County population projected at +4% by 2050 — modest demand growth; plan on rents tracking national, not racing it.
Negotiation context
- It's been on market 38 days — a 3% lower offer ($146k) is reasonable based on typical stale-listing flexibility.
- 2 sale attempts with the ask held roughly flat each time — persistent listings suggest the price (not the market) is what's stuck; bring a comps-based counter.
- Current owner paid $80k; list at $150k implies a 88% gain — meaningful room to come down on a strong offer.
Risks & watch-outs
- Watch-outs: property tax is 3.7% of price; built in 1958 — expect roof / HVAC / electrical / plumbing capex.
Questions for the listing agent
- It's been on market 38 days. Have you received any prior offers? Is the seller open to a 3% concession, seller financing, or rate buy-down credit?
- Built in 1958 — when were the roof, HVAC, electrical panel, plumbing, and water heater last replaced?
- Property tax is high relative to price — has the assessment been appealed recently, and will the sale trigger a re-assessment?
- Is there a deadline driving the sale (1031 exchange, divorce, estate, relocation)? That informs how much negotiation room exists.
- Schools are F-rated, which usually means shorter tenancies and higher turnover. Who's the typical renter profile here, and what's been the actual vacancy rate?
- Crime grade is F in this area — have there been break-ins, vandalism, or insurance claims at this property in the last 3 years? What carrier currently insures it and at what premium?
- What's the average days-on-market for RENTAL listings here right now (not sales)? A rising rental-DOM trend means longer vacancies and softer asking-rent achievability than the comps imply.
- What's the recent tenant-quality profile in this submarket — average credit score on applications, eviction rate, late-payment / NSF rate, and stable-employment percentage? A property-management company in the area should have these aggregated.
- How much new for-sale + rental construction is in the pipeline within 1–3 miles? Heavy new supply typically softens prices + rents 12–24 months out; constrained supply supports both.
Investment metrics
- 1% rule
- 1.17% ✓
- Cap rate
- 6.91%
- Cash-on-cash
- 2.21%
- DSCR
- 1.10
- GRM
- 7.1
CMA / ARV
- ARV (median comp)
- $249,264
- List price
- $150,000
- Delta
- -39.82%
- Verdict
- UNDERPRICED
- Comps
- 20 within 1.0 mi
Show comp detail 12 sales within ~0.75 mi
| Address | Dist | Beds/Ba | Sqft | Sold | Price | $/sf | Match |
|---|---|---|---|---|---|---|---|
| 6310 N 107th St | 0.25mi | 3/2.5 | 1,583 (-2%) | 7mo | $305,000 | $193 | 76 |
| 6401 N 106th St | 0.14mi | 3/2.0 | 1,453 (-10%) | 2mo | $230,000 | $158 | 74 |
| 6407 N 106th St | 0.13mi | 3/2.0 | 1,458 (-9%) | 6mo | $225,000 | $154 | 71 |
| 6172 N 116th St | 0.67mi | 3/1.5 | 1,618 (+1%) | 6mo | $280,000 | $173 | 62 |
| 6201 N 103rd St | 0.45mi | 3/1.5 | 1,727 (+8%) | 8mo | $217,000 | $126 | 60 |
| 11015 W Florist Ave | 0.68mi | 3/1.5 | 1,572 (-2%) | 6mo | $265,000 | $169 | 59 |
| 6371 N 118th St | 0.70mi | 3/2.0 | 1,611 (+0%) | 8mo | $325,000 | $202 | 58 |
| 6307 N 104th St | 0.32mi | 4/1.5 (+1) | 1,378 (-14%) | 0mo | $203,000 | $147 | 56 |
| 10101 W Beechwood Ave | 0.60mi | 3/1.0 | 1,412 (-12%) | 0mo | $270,000 | $191 | 50 |
| 10301 W Vera Ave | 0.70mi | 3/2.0 | 1,756 (+9%) | 1mo | $280,000 | $159 | 49 |
| 6212 N 106th St | 0.38mi | 2/3.0 (-1) | 1,392 (-13%) | 2mo | $242,650 | $174 | 48 |
| 10341 W Vera Ave | 0.67mi | 3/1.0 | 1,396 (-13%) | 6mo | $320,000 | $229 | 40 |
Match score weights: distance 35% · size 25% · config 20% · recency 20%. Top-matched comps best support the ARV.
Projected returns pro-forma
-3.0% appreciation · 5.95% rent growth · sell at horizon
- IRR
- -8.6%
- Equity multiple
- 0.67×
- Total profit
- $-13,801
- Equity at exit
- $22,365
- IRR
- 5.1%
- Equity multiple
- 1.44×
- Total profit
- $18,557
- Equity at exit
- $12,969
Cash invested: $42,000 (down + closing). Projections, not guarantees.
Landlord ↔ Tenant lean methodology
- Overall (STATE)
- 73 Landlord-Friendly
- State Wisconsin
- 73 Landlord-Friendly · R+2
- County
- — inherits STATE
- City
- — inherits STATE
ZIP-level market 53224
- Home prices YoY
- -17.2%
- Rents YoY
- 6.0%
- Active inventory
- 40
- Price-to-rent
- 7.1×
Monthly cashflow live
- Estimated rent
- $1,758 high interval (Pro) →
- Mortgage (P&I)
- −$787
- Tax from tax record
- −$462 /mo · $5,549/yr
- Insurance
- −$62
- HOA
- −$0
- Vacancy / Maint / Mgmt
- −$369
- Net cashflow
- $78
Break-even live
UW: 25.0% down · 7.5% · 30yr · 1.5% tax · 5.0% vac · 8.0% maint · 8.0% mgmt
Financing live
Cash to close
- Down payment
- $37,500
- Closing costs
- $4,500
- Reserves months
- —
- Total cash needed
- —
Loan-product check · same deal, 3 products live
Conventional
25% down · 7.5% · 30yr
- Down + closing
- —
- Monthly P&I
- —
- Monthly cashflow
- —
- DSCR
- —
- Eligible?
- —
Personal DTI + credit; lowest rate.
DSCR
20% down · 8.5% · 30yr
- Down + closing
- —
- Monthly P&I
- —
- Monthly cashflow
- —
- DSCR
- —
- Eligible?
- —
No personal income docs; deal must DSCR.
Hard money
10% down · 12.0% · 12mo
- Down + closing
- —
- Monthly P&I
- —
- Monthly cashflow
- —
- DSCR
- —
- Eligible?
- —
Short-term bridge; refi at stabilization.
Rent comps 15 comps
| Address | Beds | Baths | Sqft | Rent | $/sqft | DOM | Units | Dist |
|---|---|---|---|---|---|---|---|---|
| 10518 W Jonen St Milwaukee, WI | 3.0 | 1.5 | 1456 | $1,500 | $1.03 | 3d | 1 | 0.15mi |
| 10518 W Jonen St Milwaukee, WI | 3.0 | 1.5 | 1456 | $1,500 | $1.03 | 4d | 1 | 0.15mi |
| 5824 N 117th St Milwaukee, WI | 3.0 | 2.0 | 1146 | $1,695 | $1.48 | 4d | 1 | 1.06mi |
| 5721 N 94th St Milwaukee, WI | 2.0 | 1.0 | 1050 | $1,175 | $1.12 | 14d | 2 | 1.27mi |
| N72W12727 Good Hope Rd Unit B-214 Menomonee Falls, WI | 2.0 | 2.0 | 1174 | $1,995 | $1.70 | 23d | 1 | 1.40mi |
| N72W12929 Good Hope Rd Unit C-408 Menomonee Falls, WI | 2.0 | 2.0 | 1322 | $2,425 | $1.83 | 23d | 1 | 1.49mi |
| N72W12929 Good Hope Rd Unit C-228 Menomonee Falls, WI | 2.0 | 2.0 | 1322 | $2,350 | $1.78 | 43d | 1 | 1.49mi |
| N72W12929 Good Hope Rd Unit D2-110 Menomonee Falls, WI | 2.0 | 2.0 | 1322 | $2,295 | $1.74 | 43d | 1 | 1.49mi |
| N72W12929 Good Hope Rd Unit C-300 Menomonee Falls, WI | 2.0 | 2.0 | 1278 | $2,315 | $1.81 | 23d | 1 | 1.49mi |
| N72W12929 Good Hope Rd Unit D2-201 Menomonee Falls, WI | 2.0 | 2.0 | 1207 | $2,175 | $1.80 | 23d | 1 | 1.49mi |
| N72W12929 Good Hope Rd Unit D2-101 Menomonee Falls, WI | 2.0 | 2.0 | 1207 | $2,245 | $1.86 | 19d | 1 | 1.49mi |
| N72W12929 Good Hope Rd Unit D2-300 Menomonee Falls, WI | 2.0 | 2.0 | 1207 | $2,295 | $1.90 | 19d | 1 | 1.49mi |
| N72W12929 Good Hope Rd Unit C-301 Menomonee Falls, WI | 2.0 | 2.0 | 1278 | $2,315 | $1.81 | 43d | 1 | 1.49mi |
| N72W12929 Good Hope Rd Unit D1-212 Menomonee Falls, WI | 2.0 | 2.0 | 1207 | $2,245 | $1.86 | 4d | 1 | 1.49mi |
| N72W12929 Good Hope Rd Unit D1-200 Menomonee Falls, WI | 2.0 | 2.0 | 1207 | $2,175 | $1.80 | 4d | 1 | 1.49mi |
Listing history 4 events
-
2026-04-15$150,000 Active 466-char remark
Show marketing remark (466 chars)
City Tax Foreclosure - 3BR, 1.5 BA Single Family Ranch w/ Attached Garage sitting on nice sized 1 acres lot. Home has 1,607 square feet, and more. City Scope of Essential Work is $20,600 Total scope of work is $22,600. Room and lot sizes are estimates & all information should be verified. Property being sold in 'as-is' condition. Bring flashlights & use caution when entering. Note: Property open to owner-occupant offers only first 30 days of listing
-
2026-04-06historical 235-char remark
Show marketing remark (235 chars)
This is a tax foreclosed property. For the first 30-days of the listing period, no offers below the listing price will be considered per Wisconsin Foreclosure Law. Owner Occupants will be prioritized. BIDS DUE March 30, 2026 AT 10:00am
-
2026-02-23$278,800 Active 235-char remark
Show marketing remark (235 chars)
This is a tax foreclosed property. For the first 30-days of the listing period, no offers below the listing price will be considered per Wisconsin Foreclosure Law. Owner Occupants will be prioritized. BIDS DUE March 30, 2026 AT 10:00am
-
1984-08-01soldstatus $79,900
ⓘ Source: listings_history table (triggers on properties + properties_extension) + one-shot
backfill from property_details.listing_events for pre-trigger history.
Tax reassessment forecast WI · Partial reset (capped growth)
- Current annual tax
- $5,549 · $462/mo
- Projected year-2 tax
- $5,549 · $462/mo
- Expected delta
- $0/yr ($0/mo · 0.0%)
ⓘ Screening estimate from a state-policy table — verify with the county assessor before closing.
Climate risk First Street
- Flood 1/10 Low FEMA zone X (unshaded) · 0% chance over 30 yrs
- Wildfire 1/10 Low
- Heat 2/10 Low 7 d/yr ≥101°F today · 13 d/yr by 30 yrs out
- Wind 2/10 Low
- Air quality 2/10 Low 2 unhealthy d/yr today · 2 by 30 yrs out
Nearby sold comps map
Loading sold comps map…
Walkable amenities ~0.75 mi
Loading nearby amenities…
Taxation est. · year 1
- Rental income
- $21,099
- − Mortgage interest
- −$8,402
- − Property taxes
- −$5,549
- − Insurance
- −$750
- − Repairs & maintenance
- −$1,688
- − Management
- −$1,688
- − Depreciation
- −$4,364
- Taxable loss
- −$1,341
- Est. tax savings @ 24.0%
- +$322
- After-tax cash flow
- $1,252/yr
For passive investors: Depreciation is non-cash, so a rental often shows a tax loss while cash-flowing — sheltering income. Rental losses are passive: they offset passive income freely, and up to $25,000/yr can offset ordinary (W-2) income if you actively participate and your MAGI is under $100k (phasing out to $0 by $150k); unused losses carry forward. On sale, claimed depreciation is recaptured at up to 25%, and gains may owe capital-gains tax (a 1031 exchange can defer both). Figures are a year-1 estimate at your 24.0% rate — not tax advice; consult a CPA.
Schools (NCES district)
- District
- Milwaukee School District
- NCES district ID
- 5509600
- Math proficiency
- 10% ▼ -5.00%
- Reading proficiency
- 18% ▬ 0.00%
- Median HH income
- $36,339
- Composite
- 11.61/100
- National rank
- #9696
- State rank
- #337 of 342 in WI
Livability — Milwaukee
- Score
- 81/100
- State rank
- #55
- US rank
- #1534
Category grades
Schools grade is shown separately in the Schools card above.
Census & demographics
- Census place
- Milwaukee, WI
- County
- Milwaukee County · 926,379 people
- City population
- 573,768
- Metro
- Milwaukee-Waukesha, WI
- Population (ZIP)
- 21,223
- Household income
- $67,803
- Rent vs Own
- Severe rent burden
- 1137.0
Population outlook (Milwaukee County) Hauer SSP2
- Today (2025)
- 995,758 people
- By 2030
- 1,009,124 · +1.3%
- By 2040
- 1,028,128 · +3.3%
- By 2050
- 1,040,066 · +4.4%
- By 2075
- 1,057,849 · +6.2%
- By 2100
- 1,039,774 · +4.4%
Race, ethnicity, and origin ACS 2023
- Neighborhood character
- Diverse neighborhood (Simpson 0.62)
- Race & ethnicity
- Black 57% White 18% Asian 13% Hispanic / Latino 7% Two or more races 7% Native American 2%
- Hispanic origin (detail)
- Mexican 4% Puerto Rican 2% Dominican 1%
- Common ancestry
- Romanian 2% Italian 2% Portuguese 1%
- Foreign-born
- 7% · Canada
- Languages at home
- 86% English-only · Spanish 6% Other Asian/Pacific 5% German/W. Germanic 1%
Political lean MEDSL · Milwaukee
- 2024 margin
- Solid D (+38.5) · D 68.3% · R 29.8% · Other 1.8%
- 2008→2024 swing
- +2.7pp toward D · 2008: 35.9pp · 2024: 38.5pp
- All cycles
- 2024: D+38.5 2020: D+39.9 2016: D+37.5 2012: D+34.6 2008: D+35.9
Not yet ingested
- Civics
- —
Market trends
- HPI YoY
- ▼ -66.27%
- Current HPI
- 318.5025
- Rent YoY
- ▲ 5.95%
- Metro
- Milwaukee-Waukesha, WI
- State GDP YoY
- ▲ 2.10%
- F500 in state
- 20
Industry mix (Fortune 500 HQ in WI)
| Industry | F500 HQs | Revenue |
|---|---|---|
| Industrial Machinery | 4 | $23B |
|
||
| Industrial Technology | 2 | $36B |
|
||
| Insurance | 1 | $36B |
|
||
| Professional Services | 1 | $19B |
|
||
| Utilities | 1 | $9B |
|
||
| Consumer Goods | 1 | $3B |
|
||
Price history
+87.7% since first listed4 events — show timeline
- 2026-04-15 Listed $150,000 METROMLS
- 2026-04-06 Listing Removed — METROMLS
- 2026-02-23 Listed $278,800 METROMLS
- 1984-08-01 Sold (Public Records) $79,900 Public Records
Property tax history
-1.1%/yrLatest (2024): $5,549 · -18.3% YoY. Source: county tax records.
Cash-flow waterfall
monthlySold comps — $/sqft
last 12 mo · ≤1 miLoading sold comps…