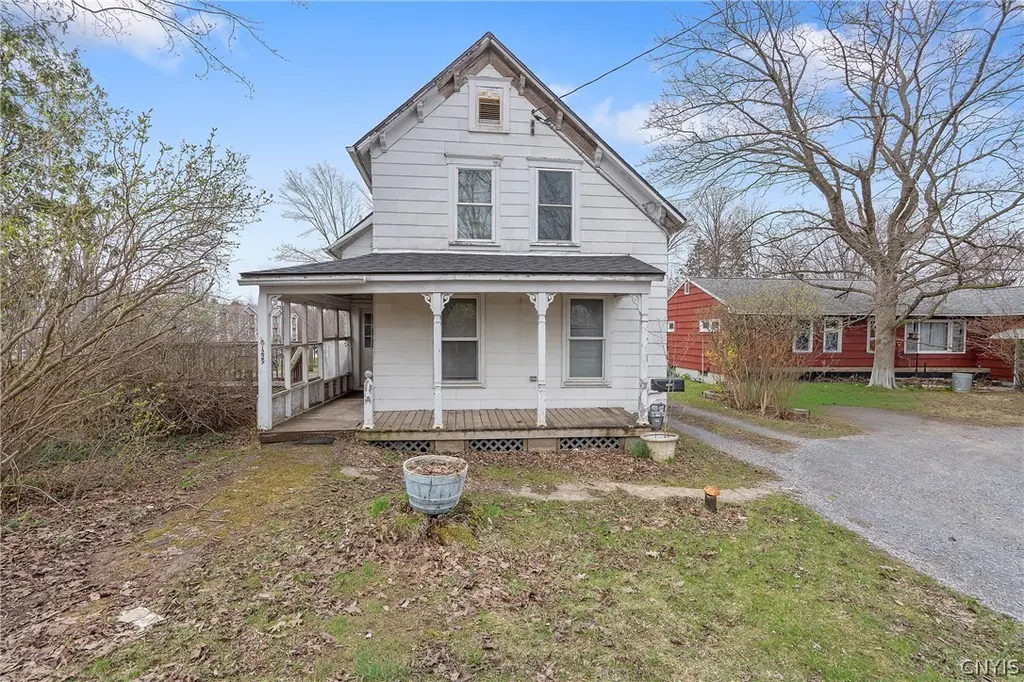
1229 Tulip St · Liverpool, NY
Flood risk 1/10 · Minimal
- FEMA flood zone
- X (unshaded)
- Chance of flooding over 30 yrs
- 0.0%
- Est. flood insurance / yr
- $473 – $860
Fire risk 1/10 · Minimal
- Est. fire insurance / yr
- $691 – $1,283
Heat risk 3/10 · Minor
- Hot days now (above 95°F)
- 7 days/yr
- Hot days in 30 yrs
- 15 days/yr
Wind risk 1/10 · Minimal
- Chance of severe wind over 30 yrs
- 0.0%
Air-quality risk 2/10 · Minimal
- Unhealthy air days now
- 0 days/yr
- Unhealthy air days in 30 yrs
- 1 days/yr
Risk factors via First Street. Map © Google.
Why this score? — see what drove the C+ grade
The composite is a weighted blend of 9 inputs, each scored 0–100. Each bar is that input's sub-score; the figure is the points it added to the 100-point composite (weight × sub-score).
- Cash flow +22.0/30.0
- ARV discount +15.0/15.0
- 1% rule +7.0/10.0
- DSCR +7.0/10.0
- Schools +4.3/10.0
- Livability +4.3/5.0
- Rent growth +2.5/5.0
- Condition / age +2.5/5.0
- Appreciation +0.0/10.0
$144,900
🖨 Deal sheet (PDF) 📄 Offer letter ✓ Due diligence
Listing remarks MLS
This home needs a complete update inside & out. Also see MlS # 253098. an additional 6.2 acres is offered for $120,000. House and the total acreage is offered for $140,000. (a little over 7 acres. ) House alone- $40K w/ 70 x 188 lot. It's an old farmhouse. Check it out!
Key facts
- Brand new roof
- Radiant flooring
- Shopping
Tags
Neighborhood map
What this means for you Summary
Snapshot
- This is a 2-bed/1.0-bath single-family listed at $145k.
Deal economics
- At list price, monthly cash flow is $230 ($3k/yr) — positive.
- The deal already cash-flows at list — no discount required.
- Meets the 1% rule at list price ($2k rent vs $145k).
- Cap rate 8.2% vs local median 5.0% in Liverpool — top-decile yield for the area; either an underpriced asset or a hidden risk that comps aren't pricing in. Stress-test before assuming the spread holds.
Location & tenants
- Location reads 86/100 on livability (#16 in NY, #363 nationally) — a professional / high-income tenant draw. Strengths: commute A+, housing A+, health & safety A+.
- Liverpool Central School District (suburban): math 49% / reading 49% proficiency, ranked #381 of 590 in NY (top 65%) — families likely to look elsewhere, expect single-tenant / working-renter base with shorter leases.
- Market conditions: 95 active listings in the ZIP; 8 comparable units currently listed for rent nearby; rentals lingering (median 45d on market — plan ~5-8 weeks vacancy on turnover, expect pricing pressure); 62% of comp listings sitting > 30 days — soft ceiling on asking rent; solid renter incomes; 616 units permitted in Onondaga County in 2024 (256 in 5+ unit buildings).
Forward outlook
- Local home prices are declining (-3.0%/yr); year-one equity from $1k of loan paydown is wiped out by about $4k of value loss. Plan a longer hold.
- Onondaga County population projected to shrink 9% by 2050 — rents likely to lag national; underwrite the cash flow, not the appreciation.
Negotiation context
- Only 6 days on market — expect competitive offers; lowballing is unlikely to land.
- 2 sale attempts since 15y ago with the ask held roughly flat each time — persistent listings suggest the price (not the market) is what's stuck; bring a comps-based counter.
- Current owner paid $30k; list at $145k implies a 383% gain — meaningful room to come down on a strong offer.
Risks & watch-outs
- Watch-outs: property tax is 2.7% of price; built in 1910 — expect roof / HVAC / electrical / plumbing capex.
Questions for the listing agent
- Built in 1910 — when were the roof, HVAC, electrical panel, plumbing, and water heater last replaced?
- Property tax is high relative to price — has the assessment been appealed recently, and will the sale trigger a re-assessment?
- Is there a deadline driving the sale (1031 exchange, divorce, estate, relocation)? That informs how much negotiation room exists.
- What's the average days-on-market for RENTAL listings here right now (not sales)? A rising rental-DOM trend means longer vacancies and softer asking-rent achievability than the comps imply.
- What's the recent tenant-quality profile in this submarket — average credit score on applications, eviction rate, late-payment / NSF rate, and stable-employment percentage? A property-management company in the area should have these aggregated.
- How much new for-sale + rental construction is in the pipeline within 1–3 miles? Heavy new supply typically softens prices + rents 12–24 months out; constrained supply supports both.
Investment metrics
- 1% rule
- 1.20% ✓
- Cap rate
- 8.20%
- Cash-on-cash
- 6.81%
- DSCR
- 1.30
- GRM
- 6.9
CMA / ARV
- ARV (on-the-fly)
- $188,292
- Comps found
- 1
Show comp detail 1 sale within ~0.75 mi
| Address | Dist | Beds/Ba | Sqft | Sold | Price | $/sf | Match |
|---|---|---|---|---|---|---|---|
| 810 Tulip St | 0.42mi | 2/1.0 | 800 (-6%) | 0mo | $176,777 | $221 | 70 |
Match score weights: distance 35% · size 25% · config 20% · recency 20%. Top-matched comps best support the ARV.
Projected returns pro-forma
-3.0% appreciation · 3.0% rent growth · sell at horizon
- IRR
- -5.8%
- Equity multiple
- 0.79×
- Total profit
- $-8,692
- Equity at exit
- $21,605
- IRR
- 4.0%
- Equity multiple
- 1.29×
- Total profit
- $11,798
- Equity at exit
- $12,528
Cash invested: $40,572 (down + closing). Projections, not guarantees.
Landlord ↔ Tenant lean methodology
- Overall (STATE)
- 15 Strongly Tenant-Friendly
- State New York
- 15 Strongly Tenant-Friendly · D+10
- County
- — inherits STATE
- City
- — inherits STATE
ZIP-level market 13090
- Active inventory
- 95
- Price-to-rent
- 6.9×
Monthly cashflow live
- Estimated rent
- $1,746 high interval (Pro) →
- Mortgage (P&I)
- −$760
- Tax from tax record
- −$329 /mo · $3,945/yr
- Insurance
- −$60
- HOA
- −$0
- Vacancy / Maint / Mgmt
- −$367
- Net cashflow
- $230
Break-even live
Sensitivity live
| Price | -10% $312 | -5% $271 | +0% $230 | +5% $189 | +10% $148 |
|---|---|---|---|---|---|
| Rent | -10% $92 | -5% $161 | +0% $230 | +5% $299 | +10% $368 |
| Rate | -1.0pp $303 | -0.5pp $267 | base $230 | +0.5pp $193 | +1.0pp $155 |
UW: 25.0% down · 7.5% · 30yr · 1.5% tax · 5.0% vac · 8.0% maint · 8.0% mgmt
Financing live
Cash to close
- Down payment
- $36,225
- Closing costs
- $4,347
- Reserves months
- —
- Total cash needed
- —
Loan-product check · same deal, 3 products live
Conventional
25% down · 7.5% · 30yr
- Down + closing
- —
- Monthly P&I
- —
- Monthly cashflow
- —
- DSCR
- —
- Eligible?
- —
Personal DTI + credit; lowest rate.
DSCR
20% down · 8.5% · 30yr
- Down + closing
- —
- Monthly P&I
- —
- Monthly cashflow
- —
- DSCR
- —
- Eligible?
- —
No personal income docs; deal must DSCR.
Hard money
10% down · 12.0% · 12mo
- Down + closing
- —
- Monthly P&I
- —
- Monthly cashflow
- —
- DSCR
- —
- Eligible?
- —
Short-term bridge; refi at stabilization.
Rent comps 8 comps
| Address | Beds | Baths | Sqft | Rent | $/sqft | DOM | Units | Dist |
|---|---|---|---|---|---|---|---|---|
| 1217 Tulip St Unit 128 Liverpool, NY | 2.0 | 2.0 | 1100 | $1,650 | $1.50 | 44d | 1 | 0.06mi |
| 1217 Tulip St Unit 133 Liverpool, NY | 1.0 | 1.0 | 620 | $1,400 | $2.26 | 44d | 1 | 0.06mi |
| 1217 Tulip St Unit 125 Liverpool, NY | 1.0 | 1.0 | 620 | $1,400 | $2.26 | 22d | 1 | 0.06mi |
| 1219 Tulip St Unit 215 Liverpool, NY | 1.0 | 1.0 | 620 | $1,400 | $2.26 | 44d | 1 | 0.09mi |
| 24 Town Garden Dr Liverpool, NY | 1.0–2.0 | 1.0 | 825 | $1,435 | $1.74 | 14d | 1 | 0.98mi |
| 213 Sunflower Dr Liverpool, NY | 3.0 | 1.0 | 936 | $2,450 | $2.62 | 14d | 1 | 1.06mi |
| 66 Grampian Rd Liverpool, NY | 1.0–2.0 | 1.0 | 840 | $1,300 | $1.55 | 44d | 1 | 1.13mi |
| 4294 Candlelight Ln Unit top Liverpool, NY | 1.0 | 1.0 | 900 | $1,100 | $1.22 | 44d | 1 | 1.24mi |
Listing history 5 events
-
2026-04-17status Pending
-
2026-04-11$144,900 Active
-
2012-10-22historical 279-char remark
Show marketing remark (279 chars)
This home needs a complete update inside & out. Also see MlS # 253098. an additional 6.2 acres is offered for $120,000. House and the total acreage is offered for $140,000. (a little over 7 acres. ) House alone- $40K w/ 70 x 188 lot. It's an old farmhouse. Check it out!
-
2012-10-15soldstatus $30,000 279-char remark
Show marketing remark (279 chars)
This home needs a complete update inside & out. Also see MlS # 253098. an additional 6.2 acres is offered for $120,000. House and the total acreage is offered for $140,000. (a little over 7 acres. ) House alone- $40K w/ 70 x 188 lot. It's an old farmhouse. Check it out!
-
2011-05-04$40,000 279-char remark
Show marketing remark (279 chars)
This home needs a complete update inside & out. Also see MlS # 253098. an additional 6.2 acres is offered for $120,000. House and the total acreage is offered for $140,000. (a little over 7 acres. ) House alone- $40K w/ 70 x 188 lot. It's an old farmhouse. Check it out!
ⓘ Source: listings_history table (triggers on properties + properties_extension) + one-shot
backfill from property_details.listing_events for pre-trigger history.
Tax reassessment forecast NY · Partial reset (capped growth)
- Current annual tax
- $3,945 · $329/mo
- Projected year-2 tax
- $3,945 · $329/mo
- Expected delta
- $0/yr ($0/mo · 0.0%)
ⓘ Screening estimate from a state-policy table — verify with the county assessor before closing.
Climate risk First Street
- Flood 1/10 Low FEMA zone X (unshaded) · 0% chance over 30 yrs
- Wildfire 1/10 Low
- Heat 3/10 Moderate 7 d/yr ≥95°F today · 15 d/yr by 30 yrs out
- Wind 1/10 Low 0% chance of damaging wind over 30 yrs
- Air quality 2/10 Low 0 unhealthy d/yr today · 1 by 30 yrs out
Nearby sold comps map
Loading sold comps map…
Walkable amenities ~0.75 mi
Loading nearby amenities…
Taxation est. · year 1
- Rental income
- $20,952
- − Mortgage interest
- −$8,117
- − Property taxes
- −$3,945
- − Insurance
- −$724
- − Repairs & maintenance
- −$1,676
- − Management
- −$1,676
- − Depreciation
- −$4,215
- Taxable income
- $598
- Est. tax owed @ 24.0%
- −$144
- After-tax cash flow
- $2,621/yr
For passive investors: Depreciation is non-cash, so a rental often shows a tax loss while cash-flowing — sheltering income. Rental losses are passive: they offset passive income freely, and up to $25,000/yr can offset ordinary (W-2) income if you actively participate and your MAGI is under $100k (phasing out to $0 by $150k); unused losses carry forward. On sale, claimed depreciation is recaptured at up to 25%, and gains may owe capital-gains tax (a 1031 exchange can defer both). Figures are a year-1 estimate at your 24.0% rate — not tax advice; consult a CPA.
Schools (NCES district)
- District
- Liverpool Central School District
- NCES district ID
- 3617520
- Math proficiency
- 49% ▼ -6.00%
- Reading proficiency
- 49% ▲ 1.00%
- Median HH income
- $59,134
- Composite
- 42.84/100
- National rank
- #3134
- State rank
- #381 of 590 in NY
Livability — Liverpool
- Score
- 86/100
- State rank
- #16
- US rank
- #363
Category grades
Schools grade is shown separately in the Schools card above.
Census & demographics
- Census place
- Liverpool, NY
- County
- Onondaga County · 247,257 people
- City population
- 29,004
- Metro
- Syracuse, NY
- Population (ZIP)
- 29,004
- Household income
- $88,492
- Rent vs Own
- Severe rent burden
- 733.0
Population outlook (Onondaga County) Hauer SSP2
- Today (2025)
- 467,894 people
- By 2030
- 463,381 · -1.0%
- By 2040
- 447,697 · -4.3%
- By 2050
- 426,399 · -8.9%
- By 2075
- 373,661 · -20.1%
- By 2100
- 307,967 · -34.2%
Race, ethnicity, and origin ACS 2023
- Neighborhood character
- Predominantly White (79%)
- Race & ethnicity
- White 79% Two or more races 9% Hispanic / Latino 7% Black 6% Asian 3%
- Hispanic origin (detail)
- Mexican 1% Puerto Rican 4%
- Common ancestry
- Romanian 7% Lithuanian 4% Italian 2%
- Foreign-born
- 6% · Canada, China, South Korea
- Languages at home
- 93% English-only · Other Indo-European 2% Spanish 1% Russian/Polish/Slavic 1%
Political lean MEDSL · Onondaga
- 2024 margin
- D (+17.3) · D 58.6% · R 41.4%
- 2008→2024 swing
- -3.0pp toward R · 2008: 20.3pp · 2024: 17.3pp
- All cycles
- 2024: D+17.3 2020: D+20.6 2016: D+12.8 2012: D+21.1 2008: D+20.3
Not yet ingested
- Civics
- —
Market trends
- HPI YoY
- ▼ -228.53%
- Current HPI
- 320.4989
- Rent YoY
- —
- Metro
- Syracuse, NY
- State GDP YoY
- ▲ 2.60%
- F500 in state
- 92
Industry mix (Fortune 500 HQ in NY)
| Industry | F500 HQs | Revenue |
|---|---|---|
| Financial Services | 10 | $950B |
|
||
| Consumer Goods | 9 | $162B |
|
||
| Insurance | 4 | $225B |
|
||
| Telecommunications | 2 | $144B |
|
||
| Pharmaceuticals | 2 | $112B |
|
||
| Media / Entertainment | 2 | $69B |
|
||
Price history
+262.2% since first listed5 events — show timeline
- 2026-04-17 Pending — CNYIS
- 2026-04-11 Listed $144,900 CNYIS
- 2012-10-22 Listing Removed — CNYIS
- 2012-10-15 Sold (MLS) $30,000 CNYIS
- 2011-05-04 Listed $40,000 CNYIS
Property tax history
+1.4%/yrLatest (2025): $3,945 · +0.3% YoY. Source: county tax records.
Cash-flow waterfall
monthlySold comps — $/sqft
last 12 mo · ≤1 miLoading sold comps…