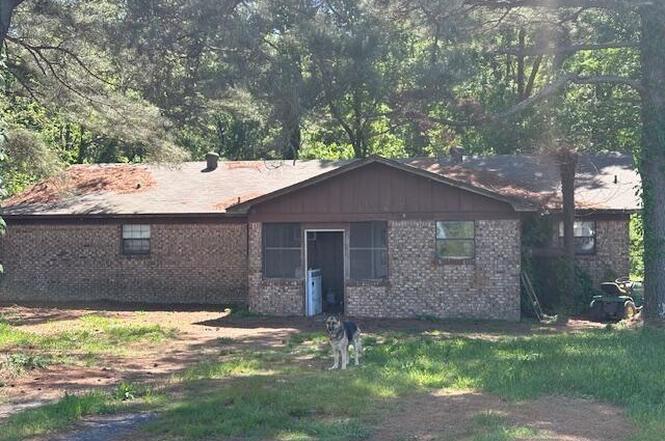
180 Welch Rd · Lonoke, AR
Flood risk No data
- FEMA flood zone
- —
- Chance of flooding over 30 yrs
- —
- Est. flood insurance / yr
- —
Fire risk No data
- Est. fire insurance / yr
- —
Heat risk No data
- Hot days now (above threshold)
- —
- Hot days in 30 yrs
- —
Wind risk No data
- Chance of severe wind over 30 yrs
- —
Air-quality risk No data
- Unhealthy air days now
- —
- Unhealthy air days in 30 yrs
- —
Risk factors via First Street. Map © Google.
Why this score? — see what drove the C- grade
The composite is a weighted blend of 9 inputs, each scored 0–100. Each bar is that input's sub-score; the figure is the points it added to the 100-point composite (weight × sub-score).
- Cash flow +25.8/30.0
- DSCR +8.6/10.0
- 1% rule +6.4/10.0
- Livability +3.2/5.0
- Schools +2.6/10.0
- Rent growth +2.5/5.0
- Condition / age +2.5/5.0
- ARV discount +0.0/15.0
- Appreciation +0.0/10.0
$139,000
🖨 Deal sheet 📄 Offer letter ✓ Due diligence
Listing remarks
Great investment property ~ it is currently occupied. Property is being sold as is where is * * * * AGENTS SEE REMARKS * * * *
Key facts
- 5.06 acre lot
- Built 1960
- Listed 124 days
Property features AI
Finance
- Other: Approximately 5.06 acres (survey); Approximate living area reported from tax records
- Financial info: Financing options include conventional loan or cash
Exterior
- Parking: Parking pads
- Utilities: Septic system; Private well; Electric service (Entergy available)
- Home design: Brick exterior
- Construction: Composition roof; Slab foundation
- Exterior features: Rural property; Not in a subdivision; Paved road access
Interior
- Kitchen: Kitchen equipment: Other (see remarks)
- Flooring: Carpet; Vinyl
- Bathrooms: 2 full bathrooms
- Heating & cooling: Heating/cooling: Other (see remarks)
- Interior features: Washer connection; Electric dryer connection
- Laundry & utility: Washer connection; Electric dryer connection
Neighborhood map
What this means for you Summary
Snapshot
- This is a 3-bed/2.0-bath single-family listed at $139k.
Deal economics
- At list price, monthly cash flow is $337 ($4k/yr) — positive.
- The deal already cash-flows at list — no discount required.
- Meets the 1% rule at list price ($2k rent vs $139k).
- Recommended offer: $122k (12.0% below list) — sets the bar for market timing.
- Cap rate 9.2% vs local median 5.7% in Lonoke — top-decile yield for the area; either an underpriced asset or a hidden risk that comps aren't pricing in. Stress-test before assuming the spread holds.
Location & tenants
- Location reads 63/100 on livability (#195 in AR) — a middle-class / working-renter tenant base. Strengths: cost of living A+, health & safety A, housing A-; Watch: crime F, amenities F, commute F.
- Lonoke School District (town): math 30% / reading 31% proficiency, ranked #146 of 238 in AR (top 61%) — families likely to look elsewhere, expect single-tenant / working-renter base with shorter leases.
- Zoned schools: Lonoke Primary School (401 students, 65% FRL); Lonoke High School (math 20% / reading 31%, grade F, #182 of 292 statewide, top 63%, 487 students, 60% FRL).
- Market conditions: 61 active listings in the ZIP; 185 units permitted in Lonoke County in 2024 (0 in 5+ unit buildings).
Forward outlook
- Local home prices are declining (-3.0%/yr); year-one equity from $961 of loan paydown is wiped out by about $4k of value loss. Plan a longer hold.
- Lonoke County population projected at +12% by 2050 — modest demand growth; plan on rents tracking national, not racing it.
Negotiation context
- It's been on market 124 days — a 12% lower offer ($122k) is reasonable based on typical stale-listing flexibility.
- 2 sale attempts; this cycle's ask has dropped $10k (7%) from the opening price — seller is motivated, your offer sets the floor, not the list.
Questions for the listing agent
- It's been on market 124 days. Have you received any prior offers? Is the seller open to a 12% concession, seller financing, or rate buy-down credit?
- Built in 1960 — when were the roof, HVAC, electrical panel, plumbing, and water heater last replaced?
- Why hasn't it sold? Are there any deal-killer items the seller is aware of (foundation, flood, title, zoning, code violations)?
- Is there a deadline driving the sale (1031 exchange, divorce, estate, relocation)? That informs how much negotiation room exists.
- Schools are F-rated, which usually means shorter tenancies and higher turnover. Who's the typical renter profile here, and what's been the actual vacancy rate?
- Crime grade is F in this area — have there been break-ins, vandalism, or insurance claims at this property in the last 3 years? What carrier currently insures it and at what premium?
- What's the average days-on-market for RENTAL listings here right now (not sales)? A rising rental-DOM trend means longer vacancies and softer asking-rent achievability than the comps imply.
- What's the recent tenant-quality profile in this submarket — average credit score on applications, eviction rate, late-payment / NSF rate, and stable-employment percentage? A property-management company in the area should have these aggregated.
- How much new for-sale + rental construction is in the pipeline within 1–3 miles? Heavy new supply typically softens prices + rents 12–24 months out; constrained supply supports both.
Investment metrics
- 1% rule
- 1.14% ✓
- Cap rate
- 9.20%
- Cash-on-cash
- 10.39%
- DSCR
- 1.46
- GRM
- 7.3
CMA / ARV
- ARV (on-the-fly)
- $110,466
- Comps found
- 1
Show comp detail 1 sale within ~0.75 mi
| Address | Dist | Beds/Ba | Sqft | Sold | Price | $/sf | Match |
|---|---|---|---|---|---|---|---|
| 180 Welch Rd | 0.00mi | 3/2.0 | 1,938 (0%) | 0mo | $110,000 | $57 | 100 |
Match score weights: distance 35% · size 25% · config 20% · recency 20%. Top-matched comps best support the ARV.
Projected returns pro-forma
-3.0% appreciation · 3.0% rent growth · sell at horizon
- IRR
- -0.7%
- Equity multiple
- 0.97×
- Total profit
- $-1,075
- Equity at exit
- $20,725
- IRR
- 8.9%
- Equity multiple
- 1.69×
- Total profit
- $26,672
- Equity at exit
- $12,018
Cash invested: $38,920 (down + closing). Projections, not guarantees.
Landlord ↔ Tenant lean methodology
- Overall (STATE)
- 92 Strongly Landlord-Friendly
- State Arkansas
- 92 Strongly Landlord-Friendly · R+14
- County
- — inherits STATE
- City
- — inherits STATE
ZIP-level market 72086
- Home prices YoY
- -18.4%
- Active inventory
- 61
- Price-to-rent
- 7.3×
Monthly cashflow live
- Estimated rent
- $1,585 medium interval (Pro) →
- Mortgage (P&I)
- −$729
- Tax from tax record
- −$128 /mo · $1,539/yr
- Insurance
- −$58
- HOA
- −$0
- Vacancy / Maint / Mgmt
- −$333
- Net cashflow
- $337
Break-even live
UW: 25.0% down · 7.5% · 30yr · 1.5% tax · 5.0% vac · 8.0% maint · 8.0% mgmt
Financing live
Cash to close
- Down payment
- $34,750
- Closing costs
- $4,170
- Reserves months
- —
- Total cash needed
- —
Loan-product check · same deal, 3 products live
Conventional
25% down · 7.5% · 30yr
- Down + closing
- —
- Monthly P&I
- —
- Monthly cashflow
- —
- DSCR
- —
- Eligible?
- —
Personal DTI + credit; lowest rate.
DSCR
20% down · 8.5% · 30yr
- Down + closing
- —
- Monthly P&I
- —
- Monthly cashflow
- —
- DSCR
- —
- Eligible?
- —
No personal income docs; deal must DSCR.
Hard money
10% down · 12.0% · 12mo
- Down + closing
- —
- Monthly P&I
- —
- Monthly cashflow
- —
- DSCR
- —
- Eligible?
- —
Short-term bridge; refi at stabilization.
Listing history 7 events
-
2026-04-13status Under Contract
-
2026-03-04price $139,000
-
2025-12-04$149,000 New Listing
-
2025-11-14historical
-
2025-09-11price $215,000
-
2025-07-16price $225,000
-
2025-04-24$234,000 New Listing
ⓘ Source: listings_history table (triggers on properties + properties_extension) + one-shot
backfill from property_details.listing_events for pre-trigger history.
Tax reassessment forecast AR · Resets to sale price
- Current annual tax
- $1,539 · $128/mo
- Projected year-2 tax
- $1,539 · $128/mo
- Expected delta
- $0/yr ($0/mo · 0.0%)
ⓘ Screening estimate from a state-policy table — verify with the county assessor before closing.
Nearby sold comps map
Loading sold comps map…
Walkable amenities ~0.75 mi
Loading nearby amenities…
Taxation est. · year 1
- Rental income
- $19,016
- − Mortgage interest
- −$7,786
- − Property taxes
- −$1,539
- − Insurance
- −$695
- − Repairs & maintenance
- −$1,521
- − Management
- −$1,521
- − Depreciation
- −$4,044
- Taxable income
- $1,910
- Est. tax owed @ 24.0%
- −$458
- After-tax cash flow
- $3,584/yr
For passive investors: Depreciation is non-cash, so a rental often shows a tax loss while cash-flowing — sheltering income. Rental losses are passive: they offset passive income freely, and up to $25,000/yr can offset ordinary (W-2) income if you actively participate and your MAGI is under $100k (phasing out to $0 by $150k); unused losses carry forward. On sale, claimed depreciation is recaptured at up to 25%, and gains may owe capital-gains tax (a 1031 exchange can defer both). Figures are a year-1 estimate at your 24.0% rate — not tax advice; consult a CPA.
Schools (NCES district)
- District
- Lonoke School District
- NCES district ID
- 0509060
- Math proficiency
- 30% ▼ -10.00%
- Reading proficiency
- 31% ▼ -2.00%
- Median HH income
- $46,440
- Composite
- 26.28/100
- National rank
- #7247
- State rank
- #146 of 238 in AR
Livability — Lonoke
- Score
- 63/100
- State rank
- #195
- US rank
- #15446
Category grades
Schools grade is shown separately in the Schools card above.
Census & demographics
- Population (ZIP)
- 12,250
Population outlook (Lonoke County) Hauer SSP2
- Today (2025)
- 78,072 people
- By 2030
- 80,673 · +3.3%
- By 2040
- 84,977 · +8.8%
- By 2050
- 87,778 · +12.4%
- By 2075
- 91,398 · +17.1%
- By 2100
- 87,858 · +12.5%
Race, ethnicity, and origin ACS 2023
- Neighborhood character
- Predominantly White (79%)
- Race & ethnicity
- White 79% Black 10% Hispanic / Latino 6% Two or more races 5%
- Hispanic origin (detail)
- Mexican 6%
- Common ancestry
- Lithuanian 1% Portuguese 1% Slovak 1%
- Foreign-born
- 4% · Canada
- Languages at home
- 94% English-only · Spanish 5% Other Asian/Pacific 1%
Political lean MEDSL · Lonoke
- 2024 margin
- Solid R (+53.7) · D 22.2% · R 75.8% · Other 2.0%
- 2008→2024 swing
- -6.2pp toward R · 2008: -47.5pp · 2024: -53.7pp
- All cycles
- 2024: R+53.7 2020: R+52.8 2016: R+53.3 2012: R+50.9 2008: R+47.5
Not yet ingested
- Civics
- —
Market trends
- HPI YoY
- ▼ -44.46%
- Current HPI
- 197.6009
- Rent YoY
- —
- Metro
- —
- State GDP YoY
- ▲ 3.80%
- F500 in state
- 10
Industry mix (Fortune 500 HQ in AR)
| Industry | F500 HQs | Revenue |
|---|---|---|
| Retail | 1 | $681B |
|
||
| Food / Agriculture | 1 | $53B |
|
||
| Retail / Energy | 1 | $22B |
|
||
| Transportation / Logistics | 1 | $12B |
|
||
| Energy | 1 | $4B |
|
||
Price history
-40.6% since first listed7 events — show timeline
- 2026-04-13 Pending — CARMLS
- 2026-03-04 Price Changed $139,000 CARMLS
- 2025-12-04 Listed $149,000 CARMLS
- 2025-11-14 Listing Removed — CARMLS
- 2025-09-11 Price Changed $215,000 CARMLS
- 2025-07-16 Price Changed $225,000 CARMLS
- 2025-04-24 Listed $234,000 CARMLS
Property tax history
+1.2%/yrLatest (2025): $1,539 · +0.0% YoY. Source: county tax records.
Cash-flow waterfall
monthlySold comps — $/sqft
last 12 mo · ≤1 miLoading sold comps…